Application of Remote Sensing and Geographical Information Systems in Determining the Groundwater Potential in the Crystalline Basement of Bulawayo Metropolitan Area, Zimbabwe ()
1. Introduction
Groundwater plays a crucial role in arid and semi-arid regions in most parts of the world especially in Africa. However, in Africa most arid and semi-arid regions are underlain by crystalline basement rocks and groundwater development is complicated by the high variability of geological and hydrogeological settings of the basement aquifers [1-3]. The situation is not good for Bulawayo Metropolitan which is covered by crystalline complex rock and frequent water shortages are being faced annually due to unreliable surface water supplies [4].
There has been comparatively little research conducted on the occurrence of groundwater in the whole crystalline basement aquifer of the Bulawayo Metropolitan, despite its significance in mitigating problems of water shortages in semi-arid regions. Most of the research conducted on part of the area has focused on groundwater quality monitoring, groundwater resource evaluation and partial characterisation of the subsurface e.g. [4-11]. Consequently, there is insufficient information to explain the occurrence and distribution of groundwater in the Bulawayo basement complex aquifer. This has slowed down the exploitation and development of groundwater in the Bulawayo City as a complimentary water source to the surface water. In [2], it was also reported that the lack of understanding of the occurrence, movement and recharge of groundwater in basement terrain has frequently contributed to the unsustainable use of this resource.
Through the use remote sensing and GIS, suitable areas for recharging basement aquifers can be delineated which have porous lithologies, maximum fractures, highly weathered region and regions of null slope. The exploration of surface features by integrating the remote sensing data and GIS techniques proved to be an essential in identifying aquiferous zones for potential groundwater exploitation in Bulawayo crystalline basement rock. This study provided preliminary information which will enhance the success of the quantitative subsurface geophysical investigation that will subsequently follow the study. The regional lineament map produced in this study is not only essential to groundwater but will be used as a reconnaissance study in mineral exploration, as well as in identifying earthquake potential zones. Zimbabwe has been facing tectonic movements in most parts of the country including the western part of Bulawayo recent that are being investigated [12,13].
The objectives of this study, therefore were to produce a regional structural lineament map of Bulawayo Metropolitan from remotely sensed data, topographic, geological inference and structural data; prepare thematic maps of the area such as lithology, lineaments, drainage density, slope and land use/land cover from remotely sensed data and other data sources; assess the hydrogeological implication of the lineaments by integrating them with the available ancillary data especially digital elevation models (DEM), and finally identify and delineate groundwater potential zones through integration of various thematic maps within a GIS environment.
2. Description of Study Area
The study area lies in the water-distressed, western region of Zimbabwe. It is located between longitude 28˚22'05"S and 28˚46'12"S and between latitude 20˚18'04"E and 20˚00'00"E. The gross command area is approximately 400 km2 in areal extent. Bulawayo is the second largest city in Zimbabwe with a population of over 1 million people, and is regarded as the industrial and business capital of Zimbabwe and is home to the National Railways of Zimbabwe because of its strategic position near Botswana and South Africa. It is the nearest large city to most tourist resort areas in Zimbabwe such as Hwange National Park, Matopo National Park and Victoria Falls. Figure 1 shows the study area and inserts of the map of Africa and the climate is semi-arid with dry winters and wet summers. The mean annual rainfall is 550 mm [14]. Rainfall is not evenly distributed throughout the year and droughts are a frequent phenomenon. Mean annual maximum and minimum temperatures for the study area is 25.8˚C and 12.7˚C, respectively.
3. Materials and Methods
3.1. Geology of the Study Area
The geology of Bulawayo is mainly constituted by the crystalline basement rock. The crystalline basement encompasses the Bulawayo greenstone belt and the surrounding granite rock. According to the geological report by [15] the greenstone belt is flanked by a belt of phyroblastic tonalitic to granodioritic gneisses, penetrated by later granitic bodies. The greenstones comprise a succession of tightly-folded metavolcanic and metasedimentary rocks with generally steep dips away from the margins of the granitic rocks. A second phase of deformation is associated with thrusting directed from the eastern part of the area over a western hinterland consisting of granitic gneiss and lower greenstone rocks. Superimposed in this phase is an episode in which a strong east-west cleavage was developed. Faulting and shearing later occurred mainly along north to north-north-west trends with some off-setting boundaries. The general lithology underlay the study area shown in Figure 2.
3.2. Preparing the Thematic Maps
This study was mainly carried out using Remote Sensing (RS) and Geographical Information Systems (GIS). In addition to that, an extensive desk study was done in collection, collation and analyzing aeromagnetic data. Remote sensing have the advantages of spatial, spectral and temporal availability of data covering large and inaccessible areas within a short time and has become a very rapid and cost effective tool in assessing, monitoring and conserving groundwater resources [16]. On the other hand, GIS is powerful environment for real time database development, especially in studies such as delineating groundwater pollution potential zones [17-19] and recharge sites [20], groundwater modeling studies [21,22] among others. The data for this study were obtained mainly from geologic maps, topographic maps, LANDSAT 7 enhanced thematic mapper plus (ETM+) image of October 2005, ASTER DEM, aeromagnetic data, geologic reports and climatological records coupled with intensive fieldwork.
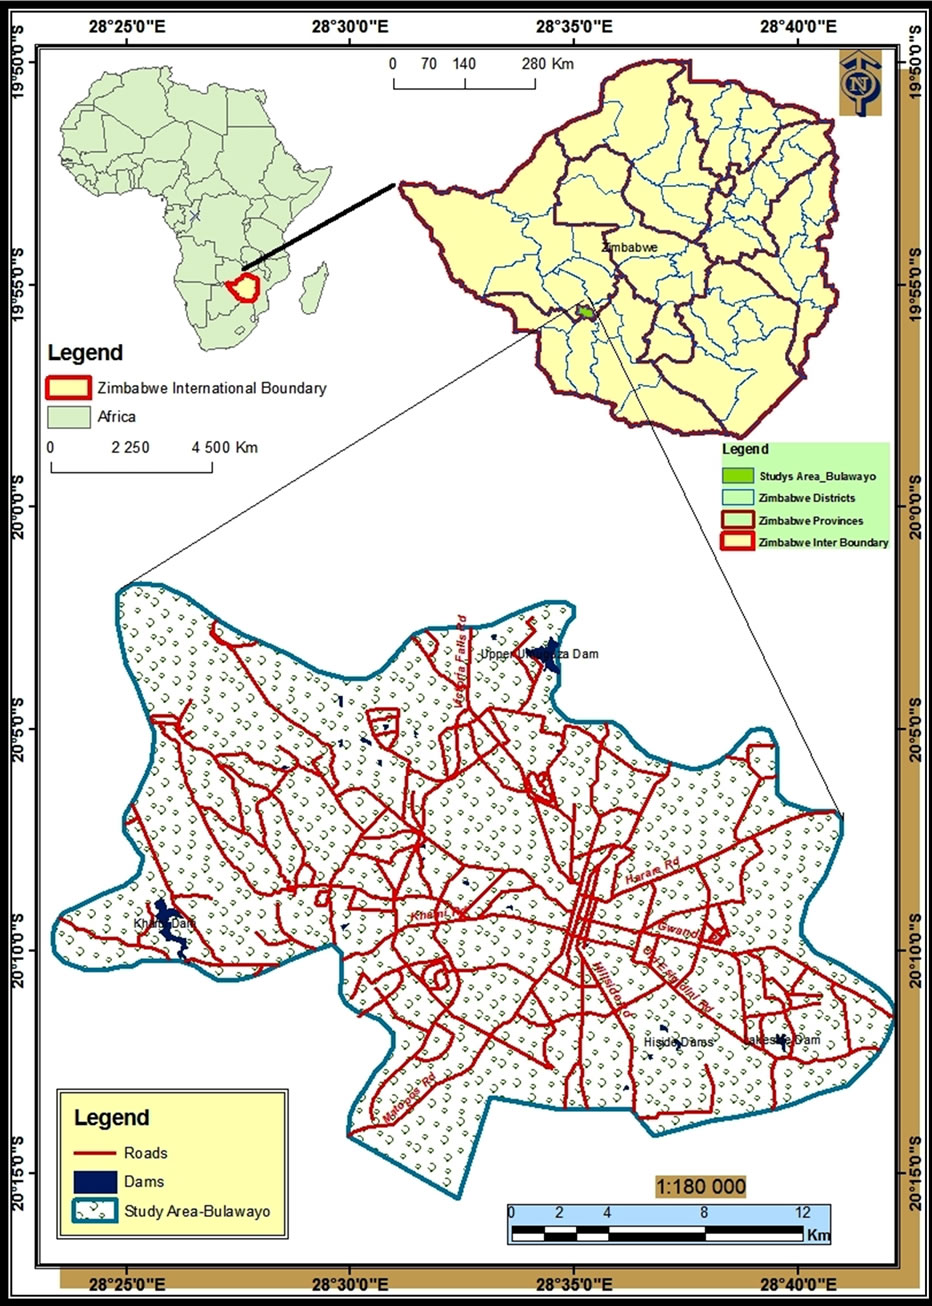
Figure 1. Study area showing the roads, dams and inserts of Africa and Zimbabwe.
The methodology adopted in this study is simplified by the schematic flow chart in Figure 3. There were four correlated processing pathways followed: the LANDSAT ETM+ data, ASTER DEM data, aeromagnetic data and geological data. Remote sensing data were processed separately from the other data from which land-cover classes were determined through image classification. Additionally, lineaments in the study area were identified visually. Ancillary data were further processed to provide the layers, and classes for each layer needed for the ArcGIS Model.
The lineaments were identified by visual interpretation of both LANDSAT ETM+ and ASTER DEM processed images (Figure 4). In order to clearly identify the lineaments from LANDSAT ETM+ data, a false color composite band combination of 754 (RGB) was used which was preceded with principal component analysis and directional filtering using Environment for Visualizing Image software (ENVI 4.7). The lineaments observed on the imagery are shadowed with radiation from the sun, and were traced onto the base map. Since the area was built up there, very few lineaments were identified from
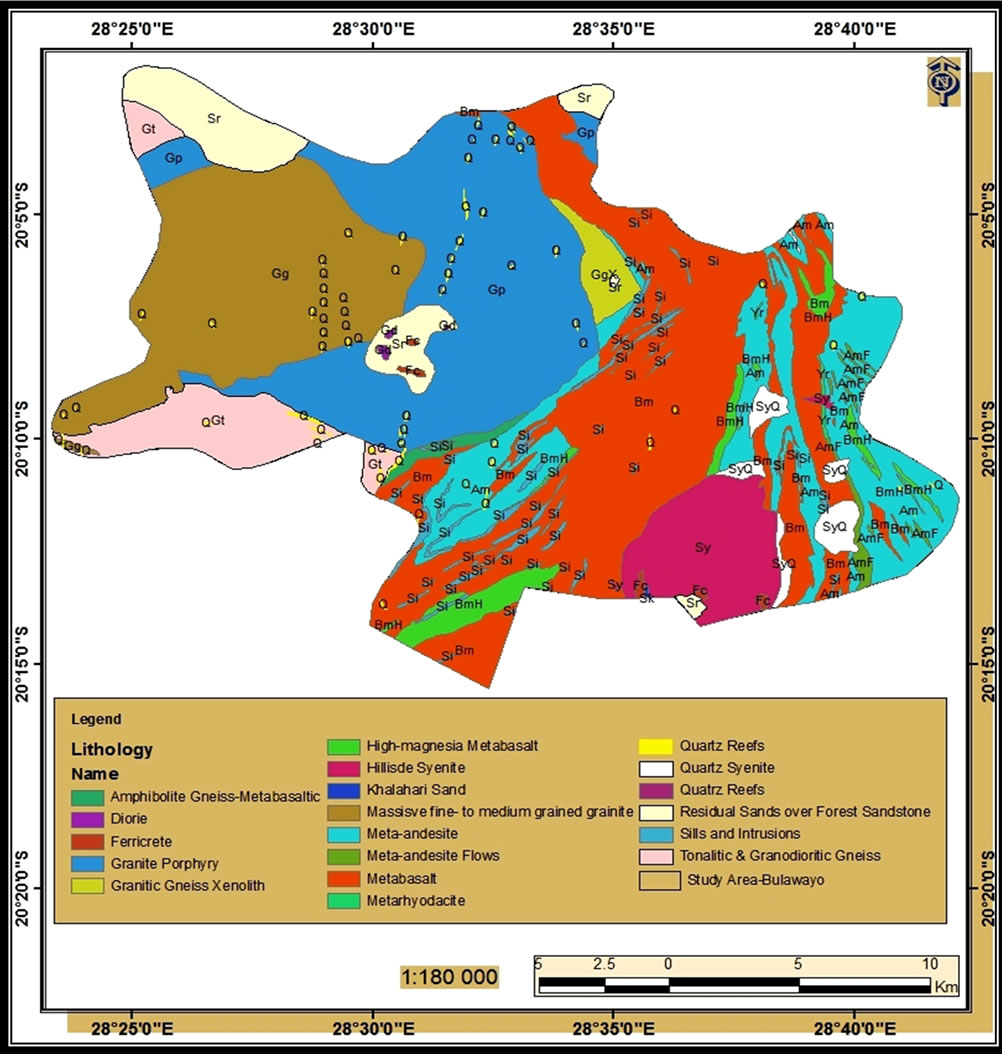
Figure 2. Map showing the geological pattern in the study area.
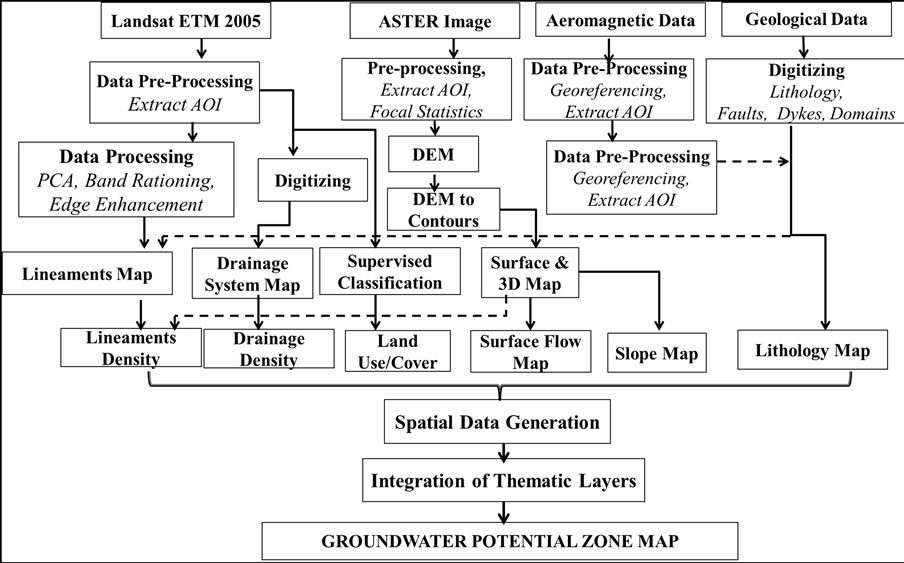
Figure 3. The methodology used to determine the groundwater potential zones in the study area.
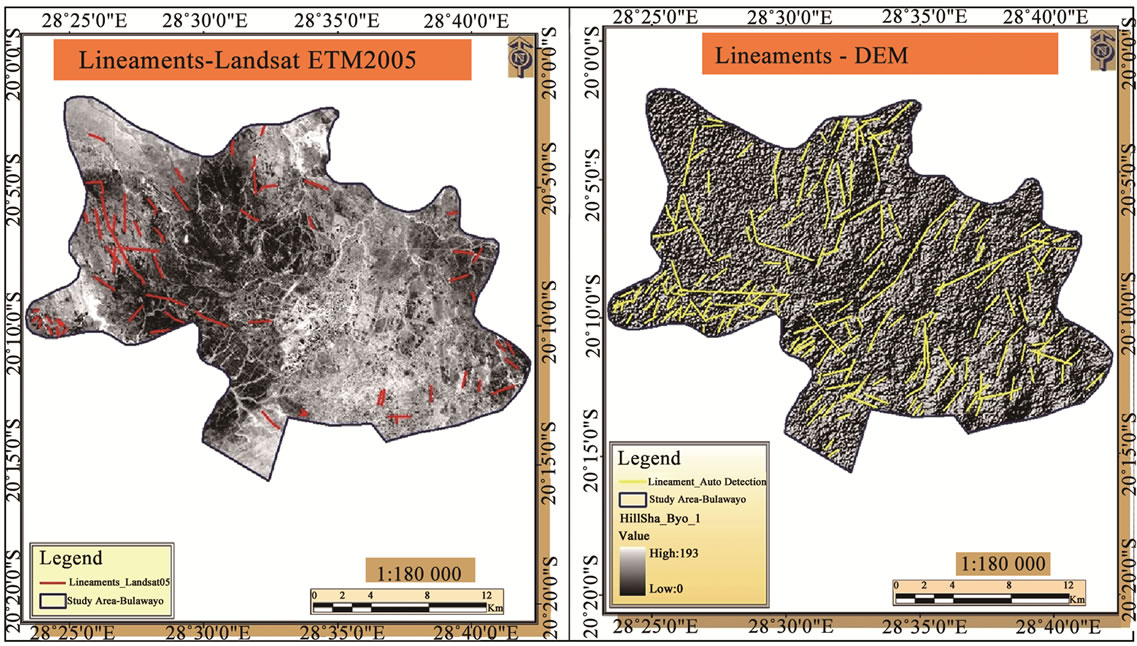
Figure 4. The lineaments observed from the LANDSAT EMT (right) and ASTER DEM data (left).
the LANDSAT ETM+ image. The ASTER DEM data were converted to a hillside terrain map using ArcGIS (ArcMap). From the hillshade surface lineaments were observed by a drop in elevation for a short distance.
Drainage pattern is one of the most important indicators of hydrogeological features, because drainage pattern and density are controlled in a fundamental way by the underlying lithology [23]. The drainage map was prepared by hand digitizing the drainage lines from processed LANDSAT ETM+ and geological map. Drainage density is the length of streams per unit area (Equation (1)). It is usually measured in km/km2.
 (1)
(1)
where Dd is the drainage density, Ls is the total length of streams, and As is the total area of the whole basin.
The slope amount map was prepared using contours produced from ASTER DEM 90m data and topographic map. Surfer 8 was then used to produce a three dimension surface map.
Land use and land cover (LULC) influences the occurrence of sub-surface groundwater occurrence, as a result supervised classification using the maximum likelihood classification was performed on the LANDSAT EMT+ image using ERDAS Imagine version 9.2. A false color combination of 432 (RGB) was used to identify the different themes in the image.
3.3. Groundwater Potential Modelling
In order to delineate potential groundwater sites in the project area, all the data sets were integrated using the model constructed in ArcGIS Model builder engine [24]. The final map produced by Weighted Linear Combination (WLC) where each class individual’s weight was multiplied by the map scores and then adds to the results as in Equation (2).
 (2)
(2)
where S is the suitability, Wi is the weight for each map score and Xi is the individual map.
3.4. Weighting of Thematic Maps
Finally the six thematic layers were converted into a grid with related item weight generated from the Analytic Hierarchy Process (AHP) by [25,26]. The final six thematic maps were reclassified in the ArcMap according to the importance of each factor in each raster image as follows:
• Reclassification of land use/cover for analysis was done based on their character to infiltrate water into the ground and to hold water on the ground.
• Drainage density raster was reclassified based on the recharge potential.
• Pairwise comparison done and the weight calculated for slope angle was based on the fact that the flatter the topography (low slope angle) is the better are the chances for groundwater accumulation.
• Reclassified map of lineament was produced based on the weight calculated after a pair-wise comparison done based on the fact that areas closer to lineaments are the highest zone of increased porosity and permeability which in turn have greater chance of accumulating groundwater.
• Reclassification of the lithologies weight was based on the susceptibility of the rock to weathering.
• Contacts density map was based on the nature of the rocks in contact and the density of the contacts. Contacts normally act as conduit of groundwater movement in basement rocks.
In the AHP method the relative importance of each individual class within the same map and vector maps were compared to each other. As a result important matrices were produced using calculated weights from the IDRSIS module (Table 1). MatLab software was used to solve the matrices and calculate the consistence value. The grids in the integrated layer were grouped into different groundwater potential zones by a suitable logical reasoning and conditioning with emphasis on the hydrogeological condition of each grid cell. The layers were then overlaid using a weighted sum in the ArcMap module. Figure 5 illustrates the overlaying of the six factors that affects the occurrence of groundwater in the ArcSene environment.
The different polygons in the thematic layers were labeled separately and then registered. In the final thematic layer initially each of the polygons was designated on the basis of interpretation of groundwater occurrence and weights in terms of interpreting the probability level of occurrence that was assigned to each polygon.
4. Results and Discussion
Geospatial analysis of the aeromagnetic data was useful in delineating the extent of the Bulawayo crystalline basement rock as shown in Figure 6. The high magnetic susceptibility values observed indicate the presence of igneous rocks which are mainly composed of basalt and granite. These two rock formations gave what is known as the Bulawayo Crystalline Basement mentioned in [27]. Therefore, the study area is mainly underlaid by a basement aquifer. Groundwater is mainly controlled by secondary porosity, which is due to mechanical and chemical weathering.
The high magnetic values are associated with serpentinised volcanic activity whilst the sills and other intrusions that developed over the years. Crystalline basement rocks (i.e. usually of Precambrian age) have generally been subjected to multiple tectonic events under varying stress conditions that resulted in complex patterns of ductile folding and brittle fracturing in the near-surface regions of the earth’s crust [28]. According to [1] basement aquifers are essentially phreatic in character, but may respond to localized abstraction in a semi-confined fashion, if the rest water level occurs in a low permeability horizon (e.g., in a clayey regolith). The greenstone belt in Bulawayo forms the crystalline rock formation which favors the occurrence of the basement aquifer in the study area.
4.1. Regional Structural Lineaments Analysis
Lineaments being a surface manifestation of structurally controlled features such as faults, fractures and rock contacts their high density may present incipient highly connected fractures that are favorable for the accumulation of groundwater. Therefore, lineament analysis of the study area extracted from both the remotely sensed data and geological images gave important information on subsurface features that controls the movement and or storage of groundwater (Figure 7). In addition to that, lineaments like joints, fractures etc., developing generally due to tectonic stress and strain, provide important clue on surface features and are responsible for the infiltration of surface runoff into the subsurface and also for the movement and storage of groundwater [29]. Most topographic lineaments in the study area correlate with faults, fracture zones, and lithological contrasts along fold belts and in crystalline basement rocks.
A detailed structure of the Bulawayo Greenstone Belt evidently is elucidated within the overall setting and framework of deformation of the Zimbabwean craton (Figure 8). Dolerite dykes; quartz and pegmatite veins traverse the area both in concordant and discordant fashions, which represent a later phase of basic igneous activity. All the rock types except the younger intrusive have suffered several phases of deformation and have been metamorphosed. These deep-seated structures and tectonic features include, for example, buried uplifts, buried igneous plugs and salt diapirs, subsurface folds and faults (both thrust and normal faults), strata affected
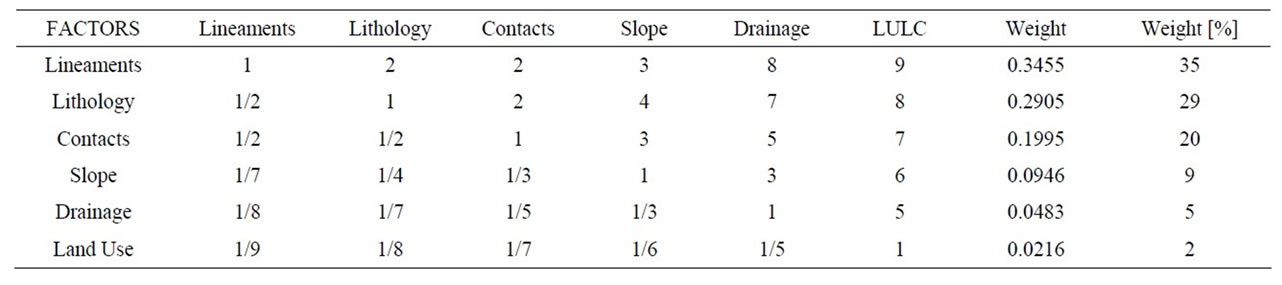
Table 1. Weight applied in ArcMap weight sum scheme.
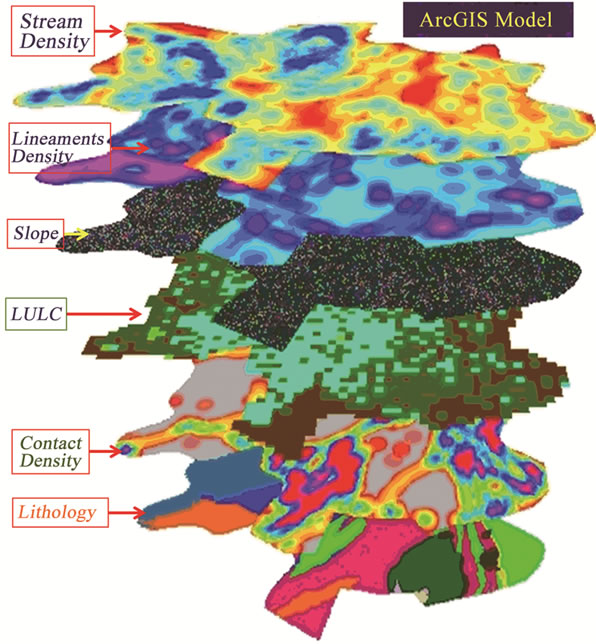
Figure 5. Integration of the thematic maps which gives the potential zones.

Figure 6. The geospatial analysis of aeromagnetic data indicating Bulawayo crystalline basement rocks.
by subtle regional warping, and stratigraphic pinch-outs [30].
From the regional structural lineament map a rose diagram was produced using Integrated Land and Water Information System 3.3 (ILWIS) software which shows the direction and magnitude of lineaments (Figure 8). Fracture zones usually occur along lineaments and often correspond to the surface drainage patterns. Fractures, dykes and zones of weathering and/or overburden deposits are targets for the exploitation of groundwater.
The main direction of the lineaments is north-westerly with more west-north-west trends in the west of the study area. The ENE-WSW to NE-SW lineaments are largely due normal faults with possibly of a small amount of transcurrent movement. As a result most of the rivers flow in the western direction of the study area as shown by the drainage map overlaid on the DEM in Figure 9. Bulawayo has four major rivers; Umatseumhlope River which runs from south to north, Khami River which runs east to west, Mpopoma River and Umguza River which run from south-east to north-west. All the small river and large rivers, which are found in the project area drain from central part to west and north direction.
4.2. Analysis of Factors Affecting the Occurrence of Groundwater
All surface and subsurface factors that affect the occurrence of groundwater were acquired, processed and analyzed. The reclassified thematic maps of all the six parameters which were incooperated in the APH system are shown in Figure 10.
Comparison of the drainage system of the area and structure has shown that the drainage system of the area is structurally controlled following lineaments directions. Dendritic and parallel drainage pattern are recognized, which are indicative of the presence of structures that act as conduits or storage for sub-surface water. Structurally controlled drainage patterns are observed in western and eastern part of the project area. Dendritic are formed on impervious rock whereas parallel drainage system form on uniform gentle slope. Overally, the drainage pattern in Bulawayo shows that the area very high drainage density is found in the west and north parts of the study area. Moderate and low drainage density concentrates in the southern and central part of the project area. The distribution is mainly attributed to the weak zones that are created due faulting, shearing and geological contacts.
Evaluation of LANDSAT ETM+ image and topographic map of year 2005 has shown that there is remarkable expansion of settlements since the independence of Zimbabwe in 1980, which negatively affect the groundwater recharge of the area. The original vegetation is more preserved in area far from the City Centre. This is due to the fact that people had made the natural forest to disappear on the flat lands near to the main road and cleared the land for construction. Generally settlements

Figure 7. Geological structures, extracted lineaments and contacts.

Figure 8. Rose diagram showing directions and lengths of lineaments in Bulawayo.
are found to be the least suitable for infiltration and after pair-wise comparison of each class weight for each class was calculated.
Based on the susceptibility of the rock to weathering, about nine classes were observed which shows have an intensive analysis of the crystalline basement rock. Results have shown that basalt rocks are easily weathered compared to the surrounding granite. Basalt rocks are associated with presence of structures such fractures, fissures, veins, joint and other structural deformations that occur in basement complex which controls the flow of ground water and also influence the rate of recharge and

Figure 9. Drainage pattern overlaid on the DEM.
discharge of the main aquiferous units. This agrees with the aeromagnetic imaging of the area which shows a contact between the granite rocks and the metabasalt rocks
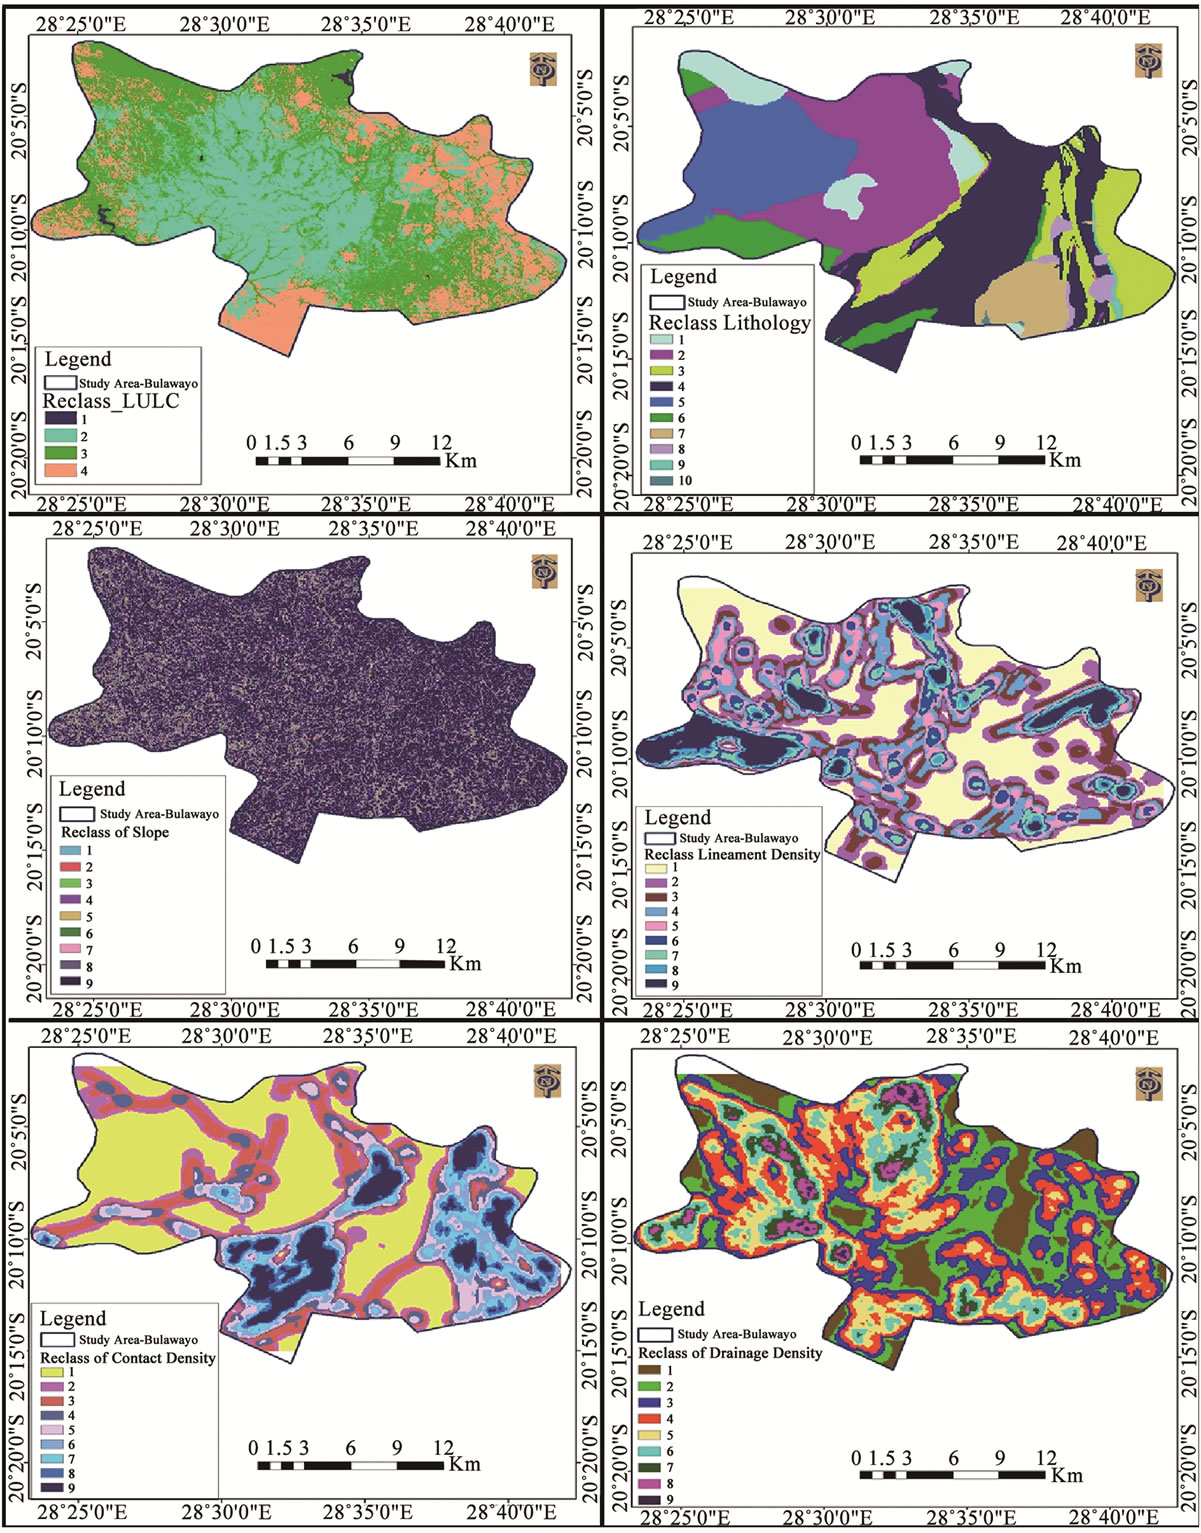
Figure 10. Reclassified thematic maps of the study indicating the land use and densities of slope, drainage, lineaments and contacts.
which are penetrated intrusions in the south west part of the study area.
Figure 11 portrays a three dimensional surface map of the study area that was produced from the ASTER DEM data which was processed and analyzed in the Surfer 8 software. The surface map is showing an abrupt change