A Stability Indicating Reverse Phase-HPLC Method Development and Validation for the Estimation of Bimatoprost 0.3% & Timolol 0.5% Pharmaceutical Ophthalmic Dosage Form ()
1. Introduction
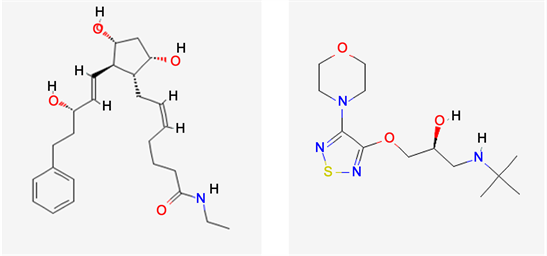
Bimatoprost chemically, (Z)-7-[(1R, 2R, 3R, 5S)-3,5-dihydroxy-2-[(E,3S)-3-hydroxy-5-phenylpent-1-enyl]cyclopentyl]-N-ethylhept-5-enamide is a synthetic prostamide and structural prostaglandin analogue [1]. Bimatoprost mimics the effects of the endogenous prostamides and reduces intraocular pressure by increasing outflow of aqueous humor through both the pressure-sensitive outflow pathway (the trabecular meshwork), and the pressure-insensitive outflow pathway (the uveoscleral routes). It is not clear whether Bimatoprost lowers intraocular pressure by stimulating F-Prostanoid receptors or by acting on specific prostamide receptors.
Timololchemically, (2S)-1-(tert-butylamino)-3-[(4-morpholin-4-yl-1,2,5-thiadiazol-3-yl)oxy]propan-2-ol is a nonselective beta-adrenergic receptor blocker that is widely used for the therapy of hypertension, angina pectoris and prevention of vascular headaches [2]. Timolol is a beta-adrenergic antagonist; both the hemihydrate and the maleate salt are used in the management of glaucoma, hypertension, angina pectoris and myocardial infarction, and for the prevention of migraine. Timolol is a nonselective beta-adrenergic antagonist given in an eye drop solution to reduce intraocular pressure, or pressure in the eyes.
The complete information with data supplemented from the literature that there are only a few methods like HPLC [3] - [9] techniques but these methods are not for Bimatoprost + Timolol combination and the method is not stability indicating. Therefore, there was no simple method developed to date, which is accurate and simple for the analysis of Bimatoprost + Timolol Ophthalmic Solution. Hence, it felt necessary to establish a new, easier, cost-effective, precise, accurate, and specific stability-indicating analytical method that can be easily applicable to routine drug performance evaluations.
2. Materials and Methods
2.1. Materials
The investigated sample Bimatoprost [Fleming Laboratories Ltd.] and Timolol [Enaltec Labs] were procured from local market, Dhaka. The Bimatoprost & Timolol Ophthalmic Eye Drops was collected from local Pharmaceutical Company in Dhaka. Acetonitrile [Merck], Methanol [Merck], Ortho Phosphoric Acid [Merck], Sodium Dihydrogen Phosphate [Merck], were of HPLCgradeand Purified water was generated using HPLC Mille-Q.
2.2. Equipment
Waters HPLC system equipped with UV detector and L11, Zorbex SB phenyl (4.6 mm × 250 mm internal diameter) 5 µm analytical column was used for quantitation of Bimatoprost and Timolol. The processing was done with complete data obtained from Empower-3 software. The sample’s solubility in the mobile phase was enhanced using Ultra-sonic Bath (DU22 model) Coply Scientific UK. All the samples prepared were weighted using Micro Balance (EP205) by Mettler Toledo.
3. Methodology
3.1. Chromatographic Conditions
The reverse-phase chromatography was performed on Waters HPLC using UV detection. The separation was done by using L11, Zorbex SB phenyl (4.6 mm × 250 mm internal diameter) 5 µm analytical column containing Phosphate buffer (0.02 M), methanol, and acetonitrile [50:30:20 % v/v] mobile phase. The method was run at 1 ml·min−1 at 210 nm for Bimatoprost and 295 nm for Timolol UV detection. The elution time for the Bimatoprost drug was 10.81 min and Timolol for 3.77 min.
3.2. Preparation of Bimatoprost and Timolol Stock Working Standard Solutions
3.2.1. Preparation of Stock Standard Solution of Bimatoprost
Weigh accurately and transfer about 24 mg of Bimatoprost working standard into a 100 ml clean and dried volumetric flask. Add about 65 ml of mobile phase, shake and sonicate to dissolve. Cool the solution to room temperature, make volume up to 100 ml with mobile phase, and mix well. The concentration of Bimatoprost will be 0.24 mg/ml.
3.2.2. Preparation of Stock Standard Solution of Timolol
Weigh accurately and transfer about 27.3 mg of Timolol Maleate working standard into a 100 ml clean and dried volumetric flask. Pipette 5 ml of the stock standard solution of Bimatoprost into the same volumetric flask. Add about 60 ml of mobile phase, shake and sonicate to dissolve. Cool the solution to room temperature, make volume up to 100 ml with mobile phase, and mix well. The concentration of Bimatoprost will be 0.012 mg/ml and the Concentration of Timolol Maleate will be 0.273 mg/ml.
3.3. Preparation of Sample Solution
Pipette 4 ml of the Bimatoprost 0.03% & Timolol 0.5% eye drop into 100 ml clean and dried volumetric flask. Make volume up to 100 ml with mobile phase and mix well. Concentration of Bimatoprost will be 0.012 mg/ml and Concentration of Timolol Maleate will be 0.273 mg/ml.
4. Method Validation
As per ICH guidelines, the checked validation parameters were Specificity, linearity, Accuracy, Precision, Range, Ruggedness, and Robustness was checked [10] [11].
4.1. System Suitability
For evaluating the suitability of the HPLC system and procedure, the Bimatoprost & Timolol standard solution of about 10 µl was introduced into the HPLC system Six-time and recorded the chromatogram. The acceptance criteria of RSD of six injections were not more than 2.0.
4.2. Specificity
Specificity is the ability of the method to accurately measure the analyte responses in presence of all formulation ingredients. A study was designed to demonstrate the effective separation of Bimatoprost and Timolol. In addition, the study was intended to ensure the effective separation of degradation peaks of formulation ingredients at the retention time of Bimatoprost and Timolol.
4.3. Linearity
The Linear response of Bimatoprost and Timolol was established by plotting a graph of concentration versus area and determining the correlation coefficient. Standard solutions of Bimatoprost and Timolol to about 50%, 80%, 100%, 120%, and 150% of the target concentration were prepared single time and injected each solution three times. A graph was plotted by placing concentration (mg/ml) on X-axis versus area on Y-axis. The correlation coefficient was calculated for principal peaks. From the results slope, intercept, and correlation coefficient (r) of the least regression line was calculated.
4.4. Accuracy
The test sample solutions were prepared as per spiked sample preparation at about 50%, 100% & 150% of the target concentration. Each sample solution was prepared three times at each spiked level and injected into the HPLC system a single time. The % recovery for the assay was calculated.
4.5. Precision
4.5.1. Intra-Day Assay Precision
To evaluate the intra-day precision, 10 µg/ml concentration solution was injected for five times under unchanged conditions within a short period. The peak areas for the five replicate injections were collected and calculated the % Relative standard deviation.
Procedure: (Day 01, Repeatability)
The precision of the test method was evaluated by six spiked samples. The system suitability parameters were evaluated. A standard solution was injected into the HPLC system and chromatograms were recorded.
4.5.2. Intermediate Precision
To Evaluate the Intermediate precision, the sample was analyzed on different days under unchanged conditions.
Procedure: (Day 02, Intermediate precision)
The Intermediate precision of the test method was evaluated by six samples.
4.6. Range
From the linearity, accuracy, and precision of the method, the range was determined over a range of concentrations.
4.7. Ruggedness
Robustness was evaluated by slightly changing the chromatographic conditions, which includes percent organic solvent and flow rate. System to System, Analyst to Analyst, and Column to column variation was considered for the ruggedness study.
4.8. Robustness
Standard solution stability, Sample solution stability, Mobile phase stability, Flow rate variation, Column oven temperature Variation, Flush volume variation (Filter), Variation in pH of the buffer of the mobile phase, and Mobile phase composition variation were considered during the robustness study.
4.8.1. Solution Stability
1) Standard Solution Stability
Standard preparation was injected for precision study at different time intervals such as initial and after 72 hours. The solution was stored at two different conditions i.e. at room temperature and 2˚C - 8˚C temperature during the course of the validation experiment and the peak area for Bimatoprost & Timolol was recorded and potency was calculated for the standard and compared with the initial result (100%). Each time a freshly prepared standard solution was injected and re-analyzed.
2) Sample Solution Stability
Sample preparation used for the precision study was injected at different time intervals such as initial and after 72 hours. The solution was stored at two different conditions i.e. at room temperature and 2˚C - 8˚C temperature during the course of the validation experiment and the peak area was recorded for Bimatoprost & Timolol to calculate the recovery of Bimatoprost & Timolol in comparison with the initial result. Each time a freshly prepared standard solution was injected and re-analyzed.
3) Mobile Phase Stability
System suitability parameters were monitored for the standard solution at different time intervals during the course of the validation experiment using the mobile phase that is prepared at least 72 hours before. The standard solution was injected six times and six sample preparations were used for the precision study. System suitability was monitored and the % assay of six individual samples was calculated.
4) Variation in Flow Rate
Six standard solutions and six sample solutions were injected to use for precision study at two different flow rates (0.9 ml/minute and 1.1 ml/minute). System suitability was monitored and the % assay of six individual samples was calculated.
5) Column Oven Temperature Variation
Six standard solutions and six sample solutions were injected to use for precision study at two different column temperatures (35˚C & 37˚C). System suitability was monitored and the % assay of six individual samples was calculated.
6) Variation in Flush volume (Filter)
Discard the volume of sample solution (5 ml, 10 ml, 15 ml, and 20 ml), and the assay of Bimatoprost & Timolol was calculated in each time to check the effectiveness of discard volume during filtration. Samples without filters were also injected.
7) Effect of Mobile Phase Composition (Buffer and organic Phase) Variation
The standard solution was injected six times and six samples were used for precision study by using two different mobile phase composition (buffer: organic phase = 48:52 & 52:48). System suitability was monitored and the % assay of six individual samples was calculated.
4.8.2. Effect of Variation in pH of Buffer of Mobile Phase
The standard solution was injected six times and six samples were used for preparations used for precision study by using two different pH of the buffer of mobile phase (pH 2.7 and 2.9). System suitability was monitored and the % assay of six individual samples was calculated.
5. Forced/Stress Degradation Studies
The specificity of the method was determined by subjecting the active drug to force/stress conditions such as acid Hydrolysis, Base Hydrolysis, Peroxide Oxidation, Thermal degradation, and Photolytic Degradation. In addition, a control solution was analyzed to determine the degradation.
The samples and standards under stress condition were monitored in order to demonstrate detectable interference due to degradants or any other compounds formed. In order to see the reactivity of inactive placebo with Bimatoprost and Timolol under stress conditions, the placebo mixture (without the actives) was also treated under the same conditions. Chromatograms were recorded and the purity of the peak was determined by calculating the % of degraded amount and % of the active amount.
5.1. Acid Degradation
Concentrated Hydrochloric acid solution was added to the sample and standard solution. The solution was heated in the water bath at 85˚C which was obtain approximately 10% to 20% degradation of assay value, wherever practically possible. This solution neutralized with the same volume and same strength alkali solvent and diluted to 100 ml with the mobile phase.
5.2. Basic Degradation
Concentrated Sodium Hydroxide solution added to the sample and standard solution. The solution was heated in the water bath at 85˚C which was obtain approximately 10% to 20% degradation of assay value, wherever practically possible. This solution neutralized before dilution with the same volume and same strength acid and diluted to 100 ml with the mobile phase.
5.3. Oxidative Degradation
Concentrated Hydrogen Peroxide solutions added to the sample and standard solution. The solution heated in the water bath at 85˚C, which will obtain approximately 10% to 20% degradation of assay value, wherever practically possible. This solution diluted to 100 ml with the mobile phase.
5.4. Thermal Degradation
The solution in the water bath was heated at 85˚C, to obtain approximately 10% to 20% degradation of assay value, wherever practically possible, and diluted to 100 ml with the mobile phase.
5.5. Photo Degradation
The sample exposed to direct sunlight to obtain approximately 10% to 20% degradation of assay value, wherever practically possible, and diluted to 100 ml with the mobile phase.
5.6. Control
Without treatment.
6. Results and Discussions
6.1. Method Development
For this method development, various ratios and combinations of mobile phases, different stationary phases, and flow rates were tried to elute the drug with good peak parameters and to provide good performance in the assay. Finally, the best separation was achieved on 4.6 mm × 250 mm, 5 µm, L11, Zorbex SB phenyl column comprising mobile phase of pH 2.8 phosphate buffer, methanol, and acetonitrile at a ratio of (50:30:20). The method was run at a flow rate of 1.0 ml·min−1 and the eluent was detected at 10.81 min for Bimatoprost and 3.77 min for Timolol by UV detector at 210 nm for Bimatoprost and 295 nm for Timolol. The chromatogram showed the peak with good shape, and more theoretical plates and the tailing factor was also found to be within the limits. All the method development trials with various mobile phase compositions, column and flow rates results were shown in Table 1.
The standard chromatogram of Bimatoprost and Timolol drug was presented in Figure 1(a) & Figure 1(b).
6.2. Analytical Method Validation
6.2.1. System Suitability
The theoretical plate number, peak asymmetry, and percentage relative standard deviation obtained were within the acceptance criteria and demonstrated that the method can generate accurate and precise results. The results were presented in Table 2.
6.2.2. Specificity
It was found that the peak of Bimatoprost and Timolol was effectively separated in presence of all formulation ingredients. Acceptance criteria were “there should be no interfering peak in the chromatogram obtained from diluent or placebo solution at the retention time corresponding to Bimatoprost and Timolol”, results should be comparable with respect to retention time and purity angle must be less than purity threshold for Bimatoprost and Timolol. The measured results were found satisfactory which is provided in Table 3(a) & Table 3(b).
6.2.3. Linearity.
Linear response of Bimatoprost and Timolol was established by plotting a graph to concentration versus area and determining the correlation coefficient. Standard solutions of Bimatoprost and Timolol to about 50%, 80%, 100%, 120%, and
![]()
Figure 1. (a): Optimized chromatogram standard (Bimatoprost). (b): Optimized chromatogram standard (Timolol).
150% of the target concentration were prepared single time and injected each solution three times. A graph was plotted by placing concentration (mg/ml) on X-axis versus the area on Y-axis. The correlation coefficient was calculated for
![]()
Table 1. Method development trials and observation.
(a) ![]() (b)
(b) ![]()
Table 3. Bimatoprost & timolol peak identification and peak purity with placebo interference. (a) Peak identification and peak purity. (b) Placebo Interference.
principal peaks. Acceptance criteria for Bimatoprost and Timolol were not less than 0.999 and the % limit of the Y-intercept should be within ±2 of the corresponding Y-co-ordinate of the working level. From the results slope, intercept, and correlation coefficient (r) of the least regression line was calculated and the results were within the limit. These results are summarized in Table 4 and Figure 2(a) & Figure 2(b).
6.2.4. Accuracy
The test sample solutions were prepared as per spiked sample preparation at about 50%, 100% & 150% of the target concentration. Each sample solution was prepared three times at each spiked level and injected into the HPLC system a single time. Acceptance criteria were “percentage of recovery should be less than 98.0 and should not be more than 102.0 and RSD of nine determination should not be more than 2.0”. The % recovery for the assay was calculated. The mean recovery of Bimatoprost and Timolol actual versus theoretical concentration was calculated to be 99.41% ± 0.49% for Bimatoprost and 100.30% ± 0.29% for Timolol. Hence the HPLC method can be considered to be accurate for Bimatoprost and Timolol determinations. The measured results are provided in Table 5.
6.2.5. Precision
The precision of the test method was evaluated by six spiked samples and the system suitability parameters were evaluated and found within the limits. The % RSD obtained was within the limits indicating the methods precision. Acceptance criteria were “% RSD of Bimatoprost and Timolol retention time should be not more than 2.0, % RSD of Bimatoprost and Timolol area should not be more than 2.0, The tailing factor of the Bimatoprost and Timolol peak is not more than 2.0 and Theoretical plate count for the Bimatoprost and Timolol peak is not
![]()
Figure 2. (a) and (b): Linearity curve for Bimatoprost and Timolol.
![]()
Table 4. Linearity of Bimatoprost and Timolol.
(a) ![]() (b)
(b) ![]()
Table 5. Accuracy of Bimatoprost and Timolol. (a) Accuracy (Bimatoprost). (b) Accuracy (Timolol).
less than 2000. Results of intraday precision and intermediate precision respectively are depicted in Table 6 & Table 7.
6.2.6. Range of Assay Method
The linearity, precision, and accuracy of the HPLC assay method were determined over a range of concentrations.
(a) ![]() (b)
(b) ![]()
Table 6. Precision (Day-01, Repeatability). (a) Sample precision (Assay of Bimatoprost). (b) Sample precision (Assay of Timolol).
The HPLC method was shown to be linear and had an intercept of zero over a concentration range of 0.0060 mg/ml to 0.0180 mg/ml for Bimatoprost and 0.10 mg/ml to 0.30 mg/ml for Timolol. This corresponded to a concentration range of 50% to 150% sample concentrations.
The precision of the HPLC system was determined at a concentration of 100%. It was determined by performing six preparations. The % RSD of recovery of Bimatoprost (0.30%) and Timolol (0.12%) exhibited that the system was precise at 100%.
The accuracy of the HPLC method was determined over the range of 0.0060 mg/ml to 0.0180 mg/ml for Bimatoprost and 0.10 mg/ml to 0.30 mg/ml for Timolol. This corresponds to a concentration range of 50% to 150% sample concentrations.
6.2.7. Raggedness
System-to-system variability study was conducted on two HPLC systems by using two different columns by using six different test preparations under similar conditions. The system suitability parameters were evaluated as per the test method on both the systems and found within limits. Results were presented in Table 8.
(a) ![]() (b)
(b) ![]()
Table 7. Precision (Day-02, Repeatability). (a) Sample precision (Assay of Bimatoprost). (b) Sample precision (Assay of Timolol).
![]()
Table 8. Ruggedness-system to system variability.
6.2.8. Robustness
Upon slight changes in the Solution column oven temperature variation, flow rate, pH of buffer solution, and percent organic solvent, the results confirmed the reliability of the method. Results were presented in Tables 9-12.
6.2.9. Forced Degradation Studies
The forced degradation results showed that the Bimatoprost and Timolol drug was liable to acid and degraded to about 10.94% for Bimatoprost & 10.32% for Timolol. In basic degradation, it was found to be degraded to about 5.95% for Bimatoprost & 12.22% for Timolol. Upon oxidation, it was degraded to about 9.02% for Bimatoprost & 19.21% for Timolol and in thermal degradation to about 17.61% for Bimatoprost & 1.49% for Timolol. Very less degradation was observed in photolytic degradation to about 4.99% for Bimatoprost & 13.04% for Timolol. For the validation of any chromatographic assay, 5% to 20% of degradation is acceptable [12].
Therefore, in the present method, the % degraded amount is within the specified limits and moreover, the successful separation of active pharmaceutical products from degradation products without any interference proved the stability indicating the nature of the method and also proves that there was no influence of temperature on the performance of the newly developed method. The obtained chromatograms during stress testing were depicted in Figures 2-6. The measured values are provided in Table 13.
7. Conclusions
The present established stability indicates the Reverse phased High performance liquid chromatographic method is new, fast, and easier to quantify the Bimatoprost and Timolol drug with precise and accurate results. The successful separation of all the degradation products from the active pharmaceutical ingredient proved the specificity and the stability indicating the nature of the developed method. In comparison to the reported method for Bimatoprost and Timolol separate method validation study, this method is more perfect for Bimatoprost and Timolol combination ophthalmic preparation. In addition to that available reported methods are not having stability indications for combination preparation of Bimatoprost and Timolol ophthalmic solution. The run time of the
![]()
Figure 3. Acid degradation chromatogram of Bimatoprost and Timolol.
![]()
Figure 4. Basic degradation chromatogram of Bimatoprost and Timolol.
![]()
Figure 5. Oxidative degradation chromatogram of Bimatoprost and Timolol.
![]()
Figure 6. Thermal degradation chromatogram of Bimatoprost and Timolol.
method is 10.81 min for Bimatoprost and 3.77 min for Timolol which proves that this is a faster stability indication method with common column and mobile phase.
Thus, the shorter duration of analysis time, more sensitivity, and cost-effectiveness revealed that it is suitably applied for routine laboratory use for regular testing and also stability testing of pharmaceutical ophthalmic products.