Decomposition of Independence Using the Logit Uniform Association Model and Equality of Concordance and Discordance for Two-Way Classifications ()
1. Introduction
Consider the  contingency tables with ordered categories, let X and Y denote the row and column variables, and let
  (>0) for
  and
and . Goodman [1] considered the uniform association (U) model which was defined by
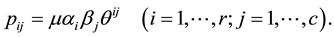
See also Agresti ([2] , p. 76). The U model may also be expressed as
where

Namely this model indicates the constant of the  local odds ratios
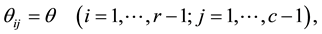
  defined for adjacent rows and adjacent columns. A special case of the U model obtained by putting
  is the independence (I) model.
If the I model holds, the correlation coefficient of X and Y equals zero; but the converse does not hold. We are interested in what structure between X and Y is necessary for obtaining the I model, in addition to the correlation coefficient being to zero.
Tomizawa, Miyamoto and Sakurai [3] give the theorem that the I model holds if and only if the Pearson’s correlation coefficient  for X and Y equals zero and the U model holds.
Tomizawa et al. [3] also give the theorem that the I model holds if and only if the Kendall’s  equals zero and the U model holds. For
 , see Kendall [4] and Agresti ([2] , p. 161).
Tahata, Miyamoto and Tomizawa [5] give the theorem that the I model holds if and only if the Spearman’s  equals zero and the U model holds. For
 , see Stuart [6] , Kendall and Gibbons ([7] , p. 8), and Agresti ([2] , p. 164). Also, Tahata and Tomizawa [8] review topics related to the quasi-uniform association model (Goodman [1] ), and the decomposition of symmetry into some models for the analysis of square contingency tables.
Suppose that the column variable Y is a response variable. Let  denote the jth cumulative logit within row i; i.e.,
![]()
where
![]()
![]()
The logit uniform association (logit U) model (Agresti [2] , p. 122) is defined by
![]()
namely
![]()
where
![]()
Thus the logit U model indicates the constant of the odds ratios for the ![]()
![]() tables obtained by taking all pairs of adjacent rows and all dichotomous collapsing of the response (Agresti [2] , p. 122). A special case of the logit U model obtained by putting
tables obtained by taking all pairs of adjacent rows and all dichotomous collapsing of the response (Agresti [2] , p. 122). A special case of the logit U model obtained by putting ![]() (i.e.,
(i.e.,![]() ) is the I model. We are now interested in what structure of probabilities
) is the I model. We are now interested in what structure of probabilities ![]() is necessary for obtaining the I model, in addition to the logit U model (instead of the U model).
is necessary for obtaining the I model, in addition to the logit U model (instead of the U model).
The purpose of the present paper is to give the decomposition of the I model by using the logit U model (in Section 2).
2. Decomposition of Independence
Let
![]()
and
![]()
For a randomly selected pair of observations, 1) ![]() is the probability of concordance such that the
is the probability of concordance such that the
member that ranks in row ![]() rather than in row i also ranks in column
rather than in row i also ranks in column ![]() or above rather than in column
or above rather than in column
j or below, and 2) ![]() is the probability of discordance such that the member that ranks in row
is the probability of discordance such that the member that ranks in row ![]()
rather than in row i ranks in column j or below rather than in column ![]() or above. Therefore
or above. Therefore ![]() and
and ![]() indicate the sum of probabilities of such concordance and those of such discordance, respectively.
indicate the sum of probabilities of such concordance and those of such discordance, respectively.
We shall consider the model of equality of concordance and discordance (say, CDE model) by
![]()
Then we obtain the following theorem.
Theorem 1. The I model holds if and only if both the CDE model and the logit U model hold.
Proof. If the I model holds, i.e., ![]() , then
, then
![]()
and
![]()
Thus, the CDE model holds. Also, if the I model holds, then the logit U model (with![]() ) holds.
) holds.
Assuming that both the CDE model and the logit U model hold, then we shall show that the I model holds. Since the logit U model holds, we see
![]()
Thus
![]()
Since the CDE model holds, we obtain![]() . The proof is completed.
. The proof is completed. ![]()
Let ![]() denote the observed frequency in the
denote the observed frequency in the ![]() cell
cell![]() . Assume that a multinomial distribution applies to the
. Assume that a multinomial distribution applies to the ![]() table. Let
table. Let ![]() denote the likelihood ratio chi-squared statistic for testing goodness-of-fit of model M defined by
denote the likelihood ratio chi-squared statistic for testing goodness-of-fit of model M defined by
![]()
where ![]() is the maximum likelihood estimate of expected frequency
is the maximum likelihood estimate of expected frequency ![]() under the model M. The numbers of degrees of freedom (df) for testing the I, logit U, and CDE models are
under the model M. The numbers of degrees of freedom (df) for testing the I, logit U, and CDE models are![]() ,
, ![]() , and 1, respectively.
, and 1, respectively.
3. An Example
The data in Table 1 are taken directly from Agresti ([2] , p. 12), which originally was presented by Grizzle, Starmer and Koch [9] . Four different operations for treating duodenal ulcer patients correspond to removal of various amounts of the stomach. Operation A is drainage and vagotomy, B is 25% resection (antrectomy) and vagotomy, C is 50% resection (hemigastrectomy) and vagotomy, and D is 75% resection. The categories of operation variable have a natural ordering. The dumping severity variable describes the extent of an undesirable potential consequence of the operation. The categories of this variable are also ordered. For these data, the I model fits well with ![]() based on
based on![]() . The logit U model also fits these data well with
. The logit U model also fits these data well with ![]()
![]()
Table 1. Cross-classification of duodenal ulcer patients according to operation and dumping severity.
Source: Grizzle et al. [9] .
based on ![]() (see Agresti ([2] , p.123) and Tomizawa [10] ). Note that the U model also fits well with
(see Agresti ([2] , p.123) and Tomizawa [10] ). Note that the U model also fits well with ![]() based on
based on ![]() (see Agresti ([2] , p.81) and Tomizawa [10] ).
(see Agresti ([2] , p.81) and Tomizawa [10] ).
For testing the hypothesis that the I model holds assuming that the logit U model holds, the difference be- tween the ![]() values for the I model and the logit U model is 6.61 based on
values for the I model and the logit U model is 6.61 based on![]() . Therefore this hypothesis is rejected at the 0.05 level. Hence the logit U model is preferable to the I model for these data.
. Therefore this hypothesis is rejected at the 0.05 level. Hence the logit U model is preferable to the I model for these data.
Also the CDE model fits these data poorly with ![]() based on
based on![]() . We see that the rejection of the hypothesis that the I model holds assuming that the logit U model holds is caused by the influence of the lack of structure of the CDE model (i.e., the lack of equality of the sum of probabilities of concordance and those of discordance), because the hypothesis that the I model holds assuming that the logit U model holds is equivalent to the CDE model from Theorem 1.
. We see that the rejection of the hypothesis that the I model holds assuming that the logit U model holds is caused by the influence of the lack of structure of the CDE model (i.e., the lack of equality of the sum of probabilities of concordance and those of discordance), because the hypothesis that the I model holds assuming that the logit U model holds is equivalent to the CDE model from Theorem 1.
4. Concluding Remarks
When the I model fits the data poorly, Theorem 1 may be useful for seeing the reason for the poor fit; namely, which of the lack of structure of the CDE model and that of the logit U model influences stronger.
From Theorem 1 we point out that the hypothesis that the I model holds under the assumption that the logit U model holds is equivalent to the hypothesis that the CDE model holds.
The U model indicates the constant of the ![]() local odds ratios defined for adjacent rows and adjacent columns. On the other hand, the logit U model indicates the constant of the odds ratios for the
local odds ratios defined for adjacent rows and adjacent columns. On the other hand, the logit U model indicates the constant of the odds ratios for the ![]()
![]() tables obtained by taking all pairs of adjacent rows and all dichotomous collapsing of the response. Thus, when the I model fits the data poorly, if the user wants to see the structure of cumulative probabilities (i.e., the structures of
tables obtained by taking all pairs of adjacent rows and all dichotomous collapsing of the response. Thus, when the I model fits the data poorly, if the user wants to see the structure of cumulative probabilities (i.e., the structures of ![]() collapsed
collapsed ![]() tables), then Theorem 1 may be preferable to preceding studies which are described in Section 1.
tables), then Theorem 1 may be preferable to preceding studies which are described in Section 1.
Acknowledgements
We thank the referee for comments and suggestions.