1. Introduction
Cassava bacterial blight (CBB) caused by Xanthomonas axonopodis pv. manihotis is the most important bacterial disease of cassava, a major root crop widely grown in the tropics. Typical symptoms of CBB include watersoaked angular leaf spots, blighting, wilting, defoliation, vascular necrosis of the stem, production of exudates on leaves, petioles or stems, and stem dieback [1] [2] .
If no management strategies are in place, losses caused by CBB can exceed 90%. Defoliation caused by CBB resulted in starvation during epidemic periods in the 1970s [2] [3] . The upsurge in the disease in Africa has been attributed to the introduction of susceptible cassava varieties from Brazil and Colombia, where the disease was highly virulent and destructive [4] . Variations among Xanthomonas axonopodis pv. manihotis strains based on pathogenicity, biochemical, physiological, serological, and genomic characteristics have been well documented [5] -[8] . Previous reports confirmed that African and Asian strains of Xanthomonas axonopodis pv. manihotis have a common center of origin in South America [9] . Losses caused by this disease have been significantly reduced in recent years around the world by the use of resistant varieties, biological control methods and sanitation practices. But CBB continues to cause cassava yield loss in various areas in the DR-Congo.
Genetic diversity and resistance to CBB revealed that the resistance is polygenic [10] . Interactions between the host and the pathogen are usually significant. Development of Cassava varieties resistant to several strains is of a paramount importance in a breeding program. The release of resistant varieties has been limited in the past for lack of knowledge on pathogen variation [11] . The level of variability of strains in areas where the disease has been endemic in the DR-Congo has not been described. Information on the pathogen’s population structure and geographic diversity is a prerequisite for studying the epidemiology of the disease and, subsequently, for selecting disease resistance sources for crop breeding [8] [12] -[14] .
The main objective of the present study was to characterize Xanthomonas axonopodis pv. manihotis strains collected from various regions across DR-Congo based on morphological and physiological traits. Incidence and aggressiveness of Congolese strains of Xanthomonas axonopodis pv. manihotis were also analyzed.
2. Materials and Methods
2.1. Sample Collection
Leaf and stems samples were collected from cassava plants affected with the CBB from four main cassava growing regions in the DR-Congo during the A 2010 and B 2011 growing seasons. The sites included Gandajika and Luputa territories (Eastern Kasai), Kiyaka (Bandundu), M'vuazi (Bas-Congo) and Boketa (Ecuador). Isolations of the pathogen were based on the procedure described by Olutiala et al. [15] and Ogunjobi et al. [7] [16] .
2.2. Morphological Characterization of Xanthomonas axonopodis pv. manihotis Strains
Leaf and stem samples from CBB affected plants were disinfected in a solution of NaCl (5%) with Tween 20 and then cut with a scalpel and suspended in sterile distilled water for about 30 minutes. The bacterial suspensions obtained were spread on a LPGA medium (yeast extract, 7 g; Bacto Peptone, 7 g; glucose, 7 g; agar-agar, 15 g; H2O, 1,000 ml) in Petri dishes. The colonies were grown at 37˚C for 48 hours before morphometric examination. Colony shape (form), color, aspect and contour (margin) were recorded at different growing stages following the methods described by Bradbury and Fahy and by Persley [17] [18] .
Cultural Characteristics and Microscopic
A 2 mm fragment of a bacterial culture was subcultured on a LPGA (Difco) medium and placed in the center of a Petri dish. They were incubated at 27˚C in the dark for 4 days. The observations were recorded daily under daylight. Staining with methylene blue solution was used to determine the basic morphology and cell size. The methylene solution consisted of two solutions. Solution A of 0.3 g methylene blue and alcohol and 30 ml of solution B (0.01 g KOH and 100 ml distilled water) were mixed. The final solution was kept for 24 h with continued magnetic stirring before being filtered. Each bacterial isolate was smeared with a drop of water on a cleaned, grease-free glass and air-dried. The stained slides were examined under a light microscope with oil immersion objectives and the images were documented with a digital camera.
2.3. Physiological Characterization
Motility of bacterial strains was determined following the method described by Olutiola et al., Aygan and Arikan and by Ogunjobi et al. [15] [16] [19] using a motility medium with 0.5% to 1% agarose. Bacterial growth was observed after incubation (48 h/37c), based on growth along the axis from the inoculation spot.
2.4. Pathogenicity Tests
2.4.1. Plant Material Plant materials used to assess the pathogenicity of various bacterial strains were obtained from cassava cuttings from disease-free areas of the station INERA/M’vuazi research station, in Bas-Congo Province. They were selected because of their susceptibility to the CBB. They were grown in a greenhouse at the plant clinic unit of the Center for tropical agronomy and veterinary in Kinshasa (DR-Congo) (Figure 1). The experimental design consisted of 3 replicates of 4 plants totaling 12 plants for each strain in a completely randomized block. Cuttings were taken from plants that showed no CBB symptoms. Plant samples measuring 20 cm long with 4 - 5 nodes were planted in plastic pots filled with previously sterilized soils. Regular watering was done every two days.
2.4.2. Pathogenicity Trials
All the 9 strains listed in table 2 were evaluated for pathogenicity. The bacterial concentration in CFU after incubation at 30˚C for 36 - 48 h in a water bath was measured using the method of direct enumeration. Cells were reinforced with a cover slide for microscopic observation. Concentration of CFU after dilution of the bacterial suspension to 1: 200 was estimated using 10 - 20 small squares under the microscope (x400). The number of cells was calculated as described by Duveiller et al. [20] : number of cells/ml = (Total cells counted × 200 × 20.108)/number of squares were counted.
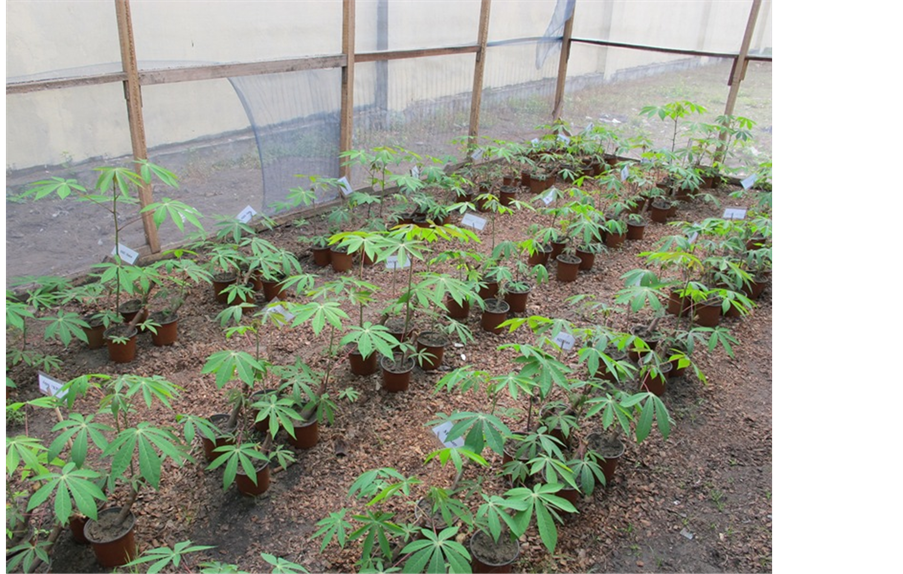
Figure 1. A greenhouse experimental trial assessing pathological characteristics of Xanthomonas axonopodis pv. manihotis strains collected across DR-Congo.
2.4.3. Inoculation Techniques
One month after cuttings planting, artificial infestation with Xanthomonas axonopodis pv. manihotis was carried out by pricking the stem below the insertion of the first leaf (to the leaflets fully deployed) with a needle whose tip was immersed in a bacterial suspension for 48 hours. The bacterial concentration was 1010 cells/ml of distilled water adjusted to a volume of 2.5 ml for each strain. Before injection, the stem was superficially disinfected with 70%. Thirty days after inoculation (30 DAI), plants were rated on a scale of 0 to 3 where 0 represents plants with healing bite and no symptoms, 1 for plants with one or two wilted leaves with gummosis at the injection site, 2 represented plants with more than two wilted leaves and gummosis extent on the stem, 3 for plants with wilting of all leaves and apex or plant death. Strains with an average score ≤ 1 were classified as virulent strains, while those with an average score >1 are classified as aggressive as described by Sanchez et al. [21] .
2.4.4. Assessment of Pathogenicity
Disease symptoms were recorded weekly to determine the interval of time between the inoculation and the appearance of different symptoms and the severity of the disease. Typical CBB foliar symptoms that include wilting, drying, defoliation and apical die back were recorded. Disease incidence was calculated as described by Bansal et al. [22] using the following formula:

Disease severity (SD) was evaluated by the formula:
SD (%) = Σ (number of diseased plants in a rating category × that rating category) / (total number of plants × category maximum score) × 100 [22] . The level of mortality was expressed as the percentage of plants completely dry compared to the total number of plants inoculated.
The Area Under Disease Progress Curve (AUDPC) was calculated using CBB incidence as described by [23]
as follows:  where xi is CBB incidence at the time i, n is the number of data taken and t is the number of days between the registration of xi and xi+1.
2.4.5. Statistical Analysis
Incidence, severity, and AUDPC values were log-transformed to stabilize variances and the analysis of variance was performed using the Statistic 8.0 software. LSD values were calculated to compare the means.
3. Results and Discussion
Nine strains of Xanthomonas axonopodis pv. manihotis were isolated from leaf samples from different regions across DR-Congo (Table 1). Symptoms commenced about three to five days post inoculation with an olivegreen colored water-soaked spot developed first at the inoculation point, followed by the appearance of yellowish to yellow brown exudates on the inoculation point and along the stem in case of severe infections. Subsequently, wilting of leaves and defoliation occurred, and finally, dieback of the apex and plant death in case of highly virulent strains.
3.1. Characterization of Xanthomonas axonopodis Strains in Culture
3.1.1. Morphology and Appearance
Characteristics of isolates grown on the LPGA medium are described in table 2. In general, the bacterial isolates causing CBB were very similar to one another in color and opacity. Figure 2 shows a colony of Xanthomonas axonopodis strain under our experimental conditions. However Musakatshi strain has a distinctive shape (form) and differences among strains were observed for colony contour (margin) and elevation. Differences in morphological characteristics have also been reported by McGuire and Jones [24] [25] and Willems et al. [26] . Rodriguez et al. [27] and other researchers reported variations in color, shape, elevation and contour (margin) among Xanthomonas axonopodis pv. manihotis strains. Cultural characteristics of bacteria can be used in connection with the degree of pathogenicity to differentiate Xanthomonas axonopodis pv. manihotis strains.

Table 1. Xanthomonas axonopodis pv manihotis (X.a.pv.m) strains identification.
Table 2. Macroscopic characters of Xanthomonas axonopodis pv. manihotis strains from different locations in the DRCongo.
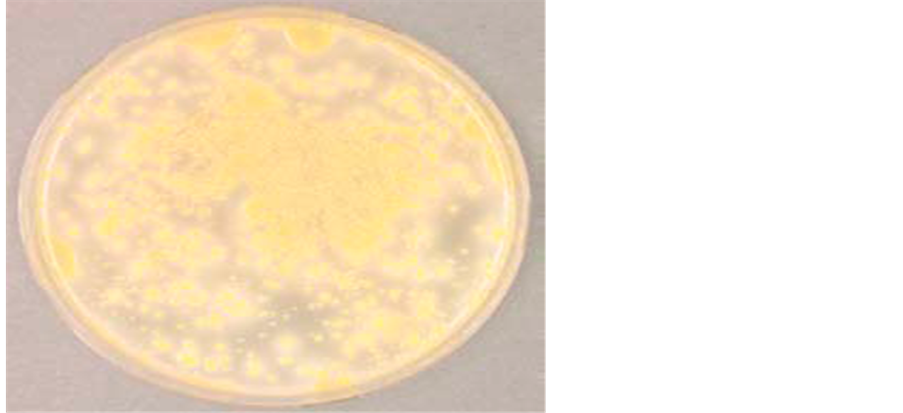
Figure 2. A Colony of Xanthomonas axonopodis 10 days after an inoculation of a LPGA medium.
3.1.2. Radial Growth
Two distinctive groups were identified based on radial growth. They include, Luputa, Gandajika, Inera/Stat, Musakatshi and Mulumba strains on one hand and M’vuazi, Boketa and Kiyaka strains on the other hand (Figure 3). The first group was characterized by a faster growth (7.8 - 10.5 mm/d) compared to the second group (4.8 - 6.9 mm/d). All the strains in the first group were from locations in the Eastern Kasai province while the second group includes strains from different provinces.
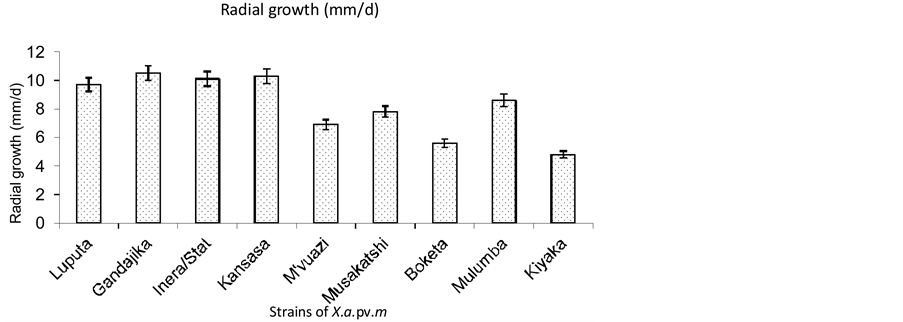
Figure 3. Growth rate of Xanthomonas axonopodis pv. manihotis strains on LPGA medium.
3.1.3. Individual Cell Characteristics
Characteristics of cells produced by different strains of Xanthomonas axonopodis pv. manihotis on LPGA medium are described in table 3. Most of cells were straight rods. Differences in length and width among strains were observed. The largest cell size was observed in Inera/Stat strain with an average of 24.1 µm (long) × 11.3 µm (wide) and the smallest in the Kiyaka strain with a cell size of 11.4 µm × 4.2 µm. Cells from Kasansa strain appeared circular, thus their size could not be compared with that of other strains.
3.1.4. Physiological Characterization of Strains
The physiological characterization of strains used in the present study is summarized in table 4. All the Xanthomonas axonopodis pv. manihotis strains showed a measurable motility with a radial diffusion in the medium with the exception of the Kasansa strains that was not motile. Growth of this strain was localized to the point of inoculation.
3.1.5. Pathogenicity of Xanthomonas axonopodis pv. manihotis Strains
Table 5 shows ratings of damages caused by the strains used. Assessment of the degree of pathogenicity of the strains was based on the degree of their virulence or aggressiveness thirty days after inoculation (30 DAI). Inera/Stat, Kasansa, Mulumba and Musakatshi strains with a damage rating ≤ 1 were classified as virulent while Luputa, M'vuazi, Boketa and Kiyaka strains with a damage rating ˃ 1 were aggressive. There were small within-site variabilities and a high intersite variability for the strains analyzed. Variation in virulence has also been found among X. axonopodis pv. manihotis strains from Brazil [6] [28] , from Africa [2] [29] [30] , and from Asia and South America [5] . X. axonopodis pv. manihotis strains collected from different geographic regions in Africa revealed great differences in virulence as well as in physiological, biochemical and serological features [31] , but the latter characteristics were not correlated with virulence. Verdier et al. [9] on the other hand reported differences in the speed of symptom development among X. axonopodis pv. manihotis strains, suggesting variations in aggressiveness. The variation in aggressiveness of strains was reported in other studies [2] [8] . Grousson et al. [29] confirm the existence of such variability in aggressiveness of Xanthomonas axonopodis pv. manihotis strains. According to this study, there is a link between aggression and the geographical origin of strains.
The variability of aggressiveness among Xanthomonas axonopodis pv. manihotis strains led to a wide range of classifications of strains into different groups of virulence, but overall correlation between aggressiveness and geographic origin couldn’t be documented in the present study because of a small number of locations sampled in some provinces. Similar finding was reported by Alves and Takatsu [6] and Fessehaie [30] . However, Restrepo and Verdier [8] reported high levels of diversity and geographic differentiation in Colombia. Banito [14] reported only slight differences in virulence among 14 strains he tested in Togo. His data showed that differences in virulence were independent of their origin in agroecological zones. An ecozonal differentiation in the occurrence of highly virulent strains was also not observed among strains from Ghana, Benin, Nigeria, Cameroon and Uganda by Wydra et al. [31] .
Table 3. Cell size for Xanthomonas axonopodis pv. manihotis strains from different locations in the DR-Congo.
Table 4. Motility of Xanthomonas axonopodis pv. manihotis strains from different locations in the DR-Congo.
Table 5. Mean levels of pathogenicity of Xanthomonas axonopodis pv. manihotis strains from different locations in the DRCongo.
Disease rating is based on a 0 to 3 sclae; 0 being the least virulent and 3 the most aggressive.
Differences were also found among strains for disease onset, incidence and plant mortality. Luputa, M'vuazi, Boketa and Kiyaka strains were distinguished from others by their ability to induce early symptoms (Table 6) and higher incidence of the disease (Table 7) based on the severity criterion AUDPC (Figure 4). Significant differences among strains were also revealed for plant mortality. The data on symptom expression are consistent with other reports [32] and were correlated with the variability observed among strains. Similar results on variability of strains aggressiveness were also documented in cassava infection by Xanthomonas campestris pv. manihotis [29] .
It should be pointed out that the comparative analysis of strains in the current study was based on test with susceptible cultivars only and no cassava genotype Xanthomonas axonopodis pv. manihotis strains interaction was assessed. Restrepo and Verdier [8] reported strain x genotype interactions on stem level. In addition, pathotypes were identified among X. axonopodis pv. manihotis strains in Colombia [13] . Wydra et al. [31] reported
Table 6. Average time interval (days) between the cuttings and the time of onset of various symptoms and plant mortality rate (%).
Means in columns with a common letter are not significantly different at p = 0.05.
Table 7. Incidence of disease CBB in a greenhouse tests using Xanthomonas axonopodis pv. manihotis strains from different locations in the DR-Congo.

Figure 4. Disease incidence expressed as the Area Under Disease Progress Curve (AUDPC) recorded 56 days after infestation.
on differences between genotypes in reaction towards leafcompared to stem-inoculation and suggested the existence of independent mechanisms of resistance on leaf level. This may contribute to the differences observed between field evaluation and reaction to stem-inoculation in the glasshouse in some studies. Detailed analysis of genotype x strain interaction in Togo is described by Banito [14] .
3.1.6. Evolution of Different Symptoms
The evolution of different symptoms from the time of their occurrence is shown in table 6. Symptoms appear early on plants inoculated with Luputa, M’vuazi, Boketa and Kiyaka strains. All inoculated plants in the greenhouse showed typical symptoms of bacterial blight that starts with wilting and progressing to dryness, defoliation and eventually plant mortality. The highest mortality rate was recorded with Boketa and Kiyaka strains with 91.6% and 100%, respectively. The numbers of days to death were reduced when these two strains were used as inoculants compared to other strains (Table 6).
3.1.7. Disease Incidence (%)
Incidence of cassava bacterial blight on plants inoculated with 9 bacterial strains is described in table 7. The highest incidence of CBB 21 DAI was observed with the Boketa strain (33%) that was considered the most aggressive, followed by the Kasansa strain (16.7%). INERA/STAT and Musakatshi strains had the lowest incidence (0%) 21 DAI. Significant differences were noted among strains for disease incidence at various times after infestation. Kasansa and Boketa, reached 100% of incidence 35 DAI, M’vuazi at 42 DAI, and Luputa, Musakatshi, Mulumba and Kiyaka at 49 DAI. All the strains reached 100% of incidence at 56 DAI.
3.1.8. Area under Disease Progress Curve (AUDPC)
The total amount of disease that occurred was calculated and expressed as the Area Under Disease Progress Curve (AUDPC). AUDPC calculated over a period of 56 days after inoculation revealed significant differences (P = 0.05) among strains. There was a distinctive discrimination between two groups with regard to the AUDPC. Boketa, INERA/Stat, Kiyaka, Luputa, Musakatshi, M’vuazi and Gandajika strains in one hand and Kasansa and Mulumba strains on the other hand. The aggressiveness of Boketa, INERA/Stat, Kiyaka, Luputa, Musakatshi and M'vuazi strains is supported by the AUDPC data described in figure 3. The virulence classification of the strains based on the statistical analysis of the area under the disease progress curve (AUDPC) provided similar results as the classification based on the time of symptom development on the plants developed by Wydra et al. [31] . A similar, but less exact classification method, with evaluation of disease symptom classes 1, 2 and 4 weeks after inoculation was used by Restrepo and Verdier [8] to evaluate the virulence of X. axonopodis pv. manihotis strains from Latin America. Thus, the inoculation of few strains—from different ecozones selected among the highly virulent group is recommended to test genotypes for resistance to cassava bacterial blight [14] .
4. Conclusion
The identity of Xanthomonas axonopodis pv. manihotis strains collected from various locations in the DRCongo as causal agent of bacterial blight of cassava was established. In fact, despite their geographical origin, the 9 strains induced typical symptoms of cassava bacterial blight, starting with wilting with spots angular, drying with exudation of gummosis to evolve to defoliation and die-back of plants. Morphological differences among strains were observed for shape (form), contour (margin) and elevation in LPDA medium. However, Musakatshi strain has a distinctive shape (form) and differences among strains were observed for colony contour (margin) and elevation. Significant differences in CBB incidence were noted among strains at various times after infestation. The aggressiveness of Boketa, INERA/Stat, Kiyaka, Luputa, Musakatshi and M’vuazi strains was supported by the AUDPC data. Significant differences among strains were also revealed for plant mortality. No clear association between an aggressiveness and geographic origin of the strains was established because of limited number of strains tested.
Acknowledgements
This research was conducted through a partnership between Laurentian University (Ontario, Canada), DRCongo universities, and Caritas Congo. The authors are grateful to the Canadian International Development Agency (CIDA) for financial support.
NOTES
*Corresponding author.