Extracavity Parametric Oscillation with Continuous and/or Discontinuous Frequency Tuning ()
1. Introduction
Tunable laser optical sources with laser wavelength of 1.4 - 4.5 um are of great practical utility. In particular they are widely used to solve spectroscopy tasks in the field of atmosphere components remote sensing. Tunable lasers based on optical parametric oscillation with nonlinear crystals are of greatest interest. Nd pulse lasers are conventionally used as a source of parametric oscillator pumping, while nonlinear crystals (NLC) KNbO3, LiNbO3, KTP, KTA, etc. [1] serve for frequency conversion. The principal OPO characteristics important for atmosphere remote sensing are low angular divergence combined with narrow spectral width and high OPO output performance.
At present the feature analysis of extra-cavity OPO with LiNbO3 resulted in a quantity of optical schemes [2-7]. The study of basic linear networks of OPO cavities [3,4] has shown that at satisfactory energy indictors the oscillator’s divergence angle is rather high and runs up at the pumping energy increase.
The implementation of OPO confocal unstable cavity [7,8] provides for high quality of output beam at a divergence angle that is close to a diffraction one. However, such cavities are extra sensitive to disalignment and are suitable only to provide oscillation at a stable wavelength. Basic research of OPO cavities [9] and their computer simulation [10] show that image-rotation cavities ensure high quality of the output beam.
Our experimental research findings [11] as well as some other works [6] prove that three-mirror ring OPO cavities provide for low beam divergence at high output performance.
The purpose of our study is to create a high performance OPO capable of continuous or/and discontinuous tuning of output wavelength within the range of 1.41 - 4.24 um. In order to provide for the above mentioned OPO output tuning types within the limits of the present study we chose a LiNbO3 NLC with high non-linear and electrooptical factors. The choice of the three-mirror ring cavity is stipulated by the advantage of this optical scheme over the linear ones because it ensures parametrical oscillation in the travelling wave mode. The threemirror cavity is less sensitive to disalignment. This cavity excludes stationary waves and has relatively homogeneous radiation intensity in comparison with linear cavities. The latter reason is of much importance because of low optical break-down of LiNbO3 crystal (300 МW/cm2). The three-mirror cavity rotates an image after each round trip. It compensates for inhomogeneity of the transverse structure of an OPO oscillated beam significantly, and diminishes the influence of optical inhomogeneities of LiNbO3 crystal pumping beam.
2. Materials and Methods
For OPO pumping a laser with an active element YAG: Nd3+ of Æ6.3 ´ 100 mm is used. Pumping laser design is that of a telescopic unstable cavity. Radiation energy at the wavelength of λ = 1.064 um amounted to 180 mJ, and radiation pulse duration was 10 ns. Parametric conversion results in pulse duration of 8 ns at the total signal and idler waves, pulse energy of up to 50 mJ that is equal to ≈28% of the conversion efficiency. Optimal pulse frequency when the power differs slightly from the average power in low pulse frequency mode was at a level of 20 - 30 Hz. One should mention that at the increasing pulsed frequency (>30 Hz) considerable power instability (over 30%) occurs. This is connected with induced thermal lens effect and induced optical inhomogeneity (optical damage) effect in LiNbO3 nonlinear crystal. The study is linear-polarized horizontally. Beam section intensity distribution has the appearance of concentric rings.
Figure 1 shows an optical scheme of a three-mirror ring OPO cavity having the shape of an equal triangle with the perimeter of 90 cm.
Active element (АE) from LiNbO3 NLC of 10 × 10 × 30 mm is oriented at θ = 47 , j = –90 NLC input pumping beam diameter is 6 mm. NLC is located on a rotating platform with a stepping motor (SM), rotating accuracy and step size are 3 arcsec and 0.03 cm–1 correspondingly. AE yaw movement provides for smooth OPO output wavelength tuning.
In case it is necessary to narrow the spectral bandwidth there is a Fabry-Perot etalon (FPE) of 500 um width on a rotating platform in OPO cavity. OPO spectral bandwidth narrowing in the whole frequency tuning range is achieved by synchronous rotation of AE and FPE. Scan time for the whole OPO tuning spectral bandwidth (1.41 - 1.85, 2.9 - 4.2 um) was equal to 5.2 s, while smooth tuning step size corresponded to 0.7 cm–1. FPE influences directly the signal wave that narrows an idler wave automatically. FPE is placed into OPO part where there is no powerful pumping wave emission.
Discontinuous OPO tuning is performed by DC voltage supply to NLC nonworking surfaces with the voltage value specifying the discontinuous tuning step. In our study the maximum DC voltage value was equal to 4500 V. The value had to be changed at a step of 50 V that
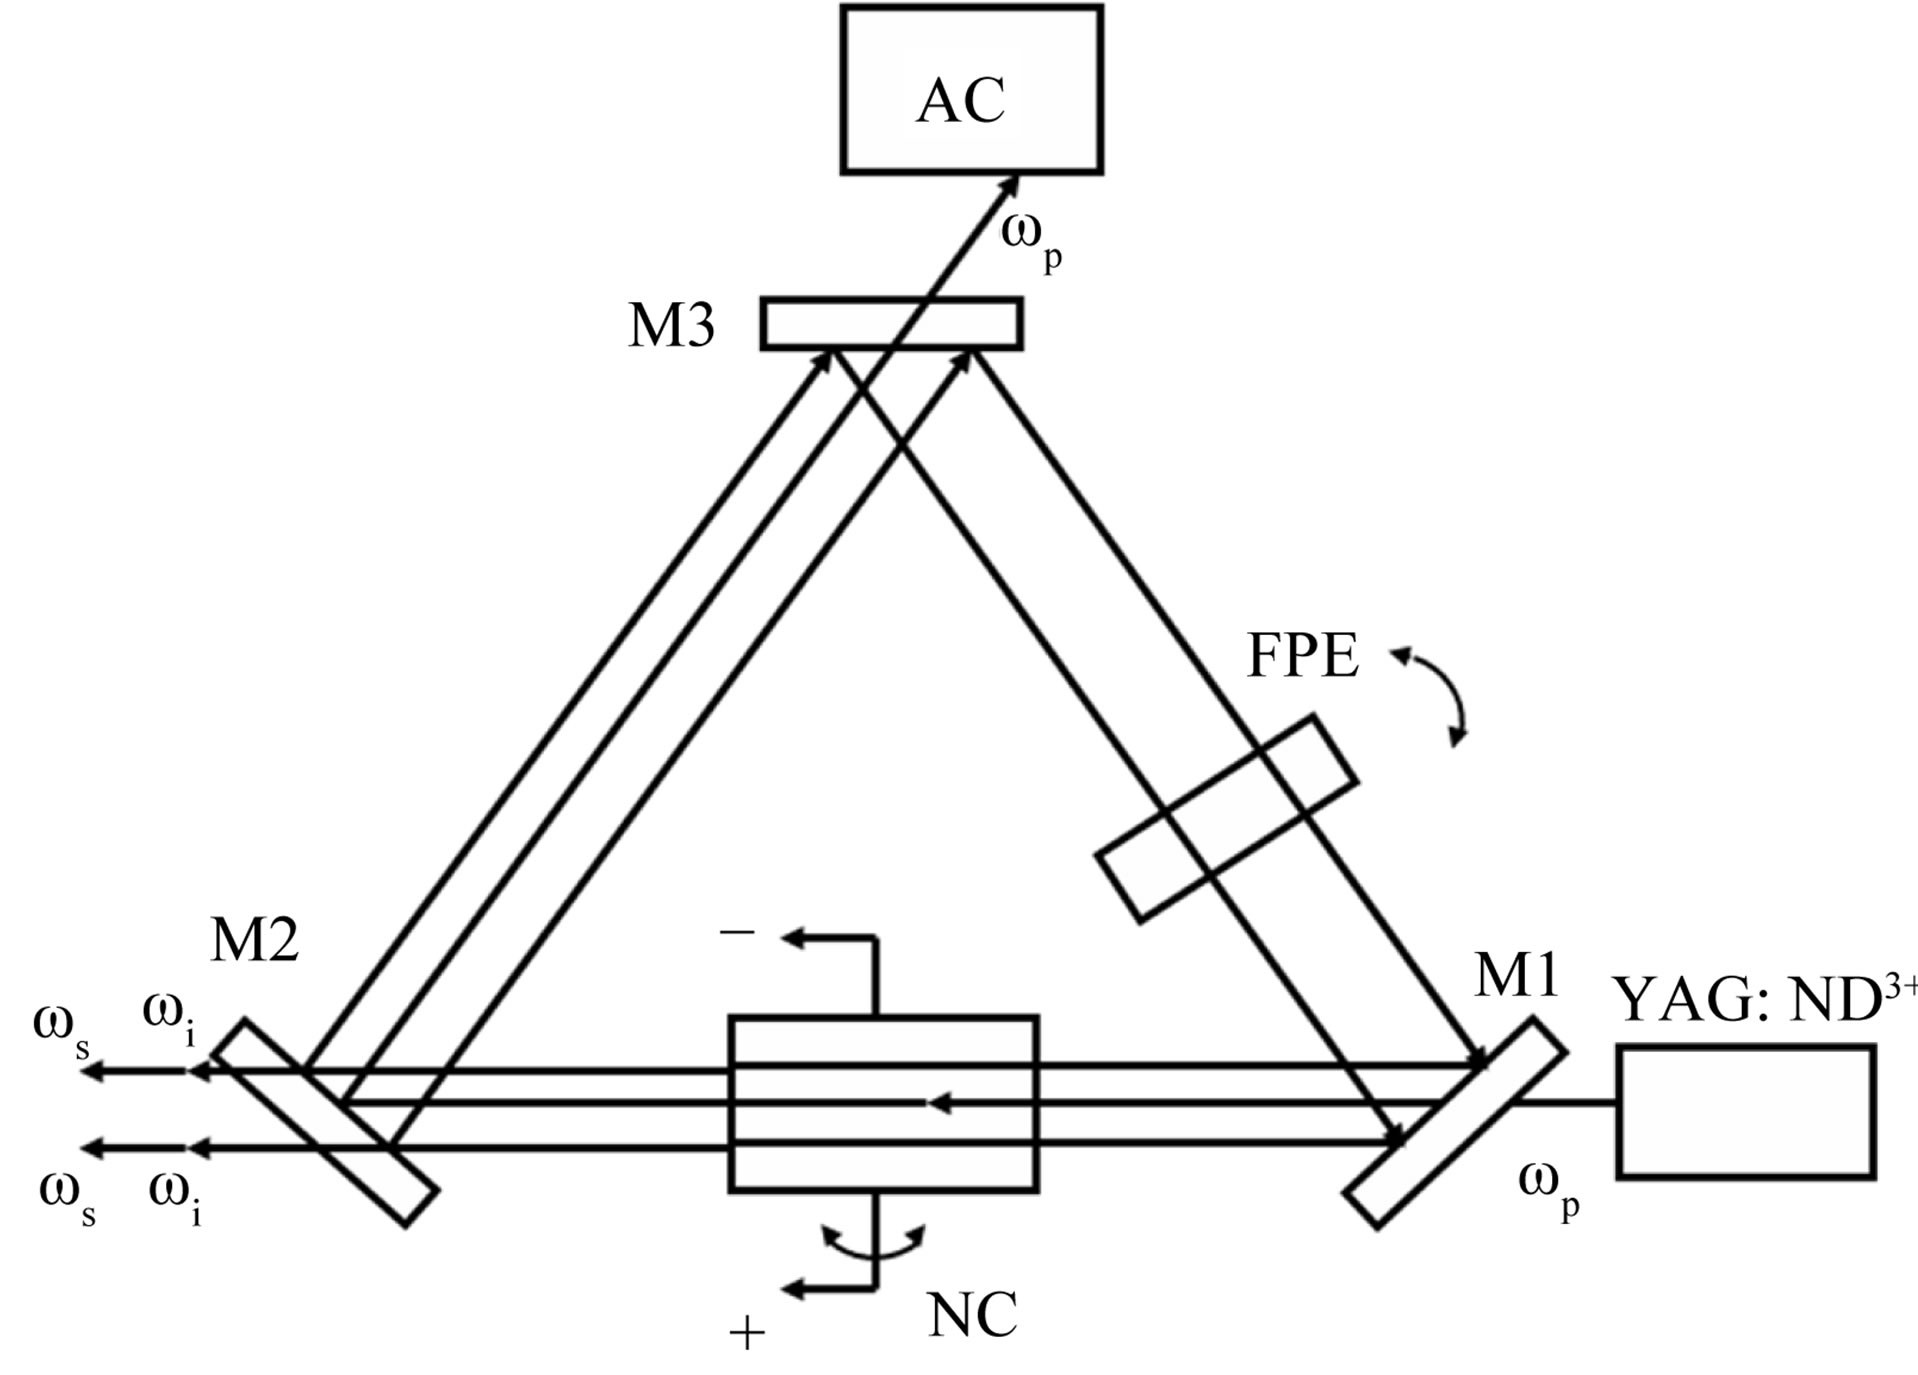
Figure 1. The scheme of a ring OPO cavity. YAG: Nd3+— pumping laser; NC—nonlinear crystal LiNbO3; М1, М2, М3—mirrors; FPE—Fabry-Perot Etalon; AC—pumping laser absorber cell; ωs, ωi, ωp—signal and idler frequencies, and pumping laser frequency.
corresponds to the minimum OPO discontinuous tuning step of 0.133 nm. So, at the zero external field (Е = 0) there is no discontinuous tuning, while at the external field voltage of U = 4500 V the maximum discontinuous tuning value is equal to 12 nm.
OPO wavelength shift at NCL heating is controlled and compensated by software to a tolerance of 0.1˚C.
Figure 2 shows an optical scheme of OPO bandwidth and wavelength measurement.
The definition of absolute value of the measured OPO wavelength (λmeas) is performed by λmeas correction method at a known gas absorption line or this purpose part of OPO emission (~3%) reflects from plane-parallel СаF2-plate (3) and enters diffuse scattering sphere (8). Detector (5) receives stray radiation of the first channel after gas cell (7) with known gas (here methane 90%, at the pressure of 1 atm). Simultaneously the similar detector (5) receives stray radiation of the second channel. Then the electric signals run from the detectors to two inputs of ADC (4) which is connected to PC (10). The PC display shows a vibration rotation absorption spectrum υ3 of the methane band, which central branch Q is a benchmark. Specialized software processes the data received, correlates them with Q-branch and displays the true value of OPO wavelength (lmeas). For OPO wavelength calibration on the diffusing sphere there is a possibility to install IR-fibre (9) to transfer lasing to the entrance slit of monochromator МDR-12 (11).
OPO output energy was measured by calorimetric power meter S310 (USA).
3. Results and Discussion
The study of OPO power performance has been executed under extreme environment temperature conditions in the laboratory (Т = +30˚C) and in the open air (Т = –10˚C). Under the given conditions after 30 minutes of laser activity at a pulse frequency of 25 Hz the energy instability was within ±6%.
Figure 3 shows signal wavelength (l = 1.42 - 1.75 um) and idler wavelength (l = 2.9 - 4.2 um) dependence of OPO radiation energy.
An abrupt fall of the signal wave at 1.69 um and lack of idler wave oscillation at 2.85 are connected with heavy absorption of lithium niobate at 2.85 um. The implemented OPO scheme achieved the total conversion factor of 27%. The numerical value of beam angular divergence was calculated according to [9] as the relation of diaphragm diameter to the lens focus distance (d/l) with the diaphragm receiving 86% of total OPO pulse energy. Moreover the diaphragm was placed in the lens’ plane.
While OPO oscillation is given as superposition of signal and idler waves, knowing the far field beam parameters helps to evaluate separate wave energy distribution
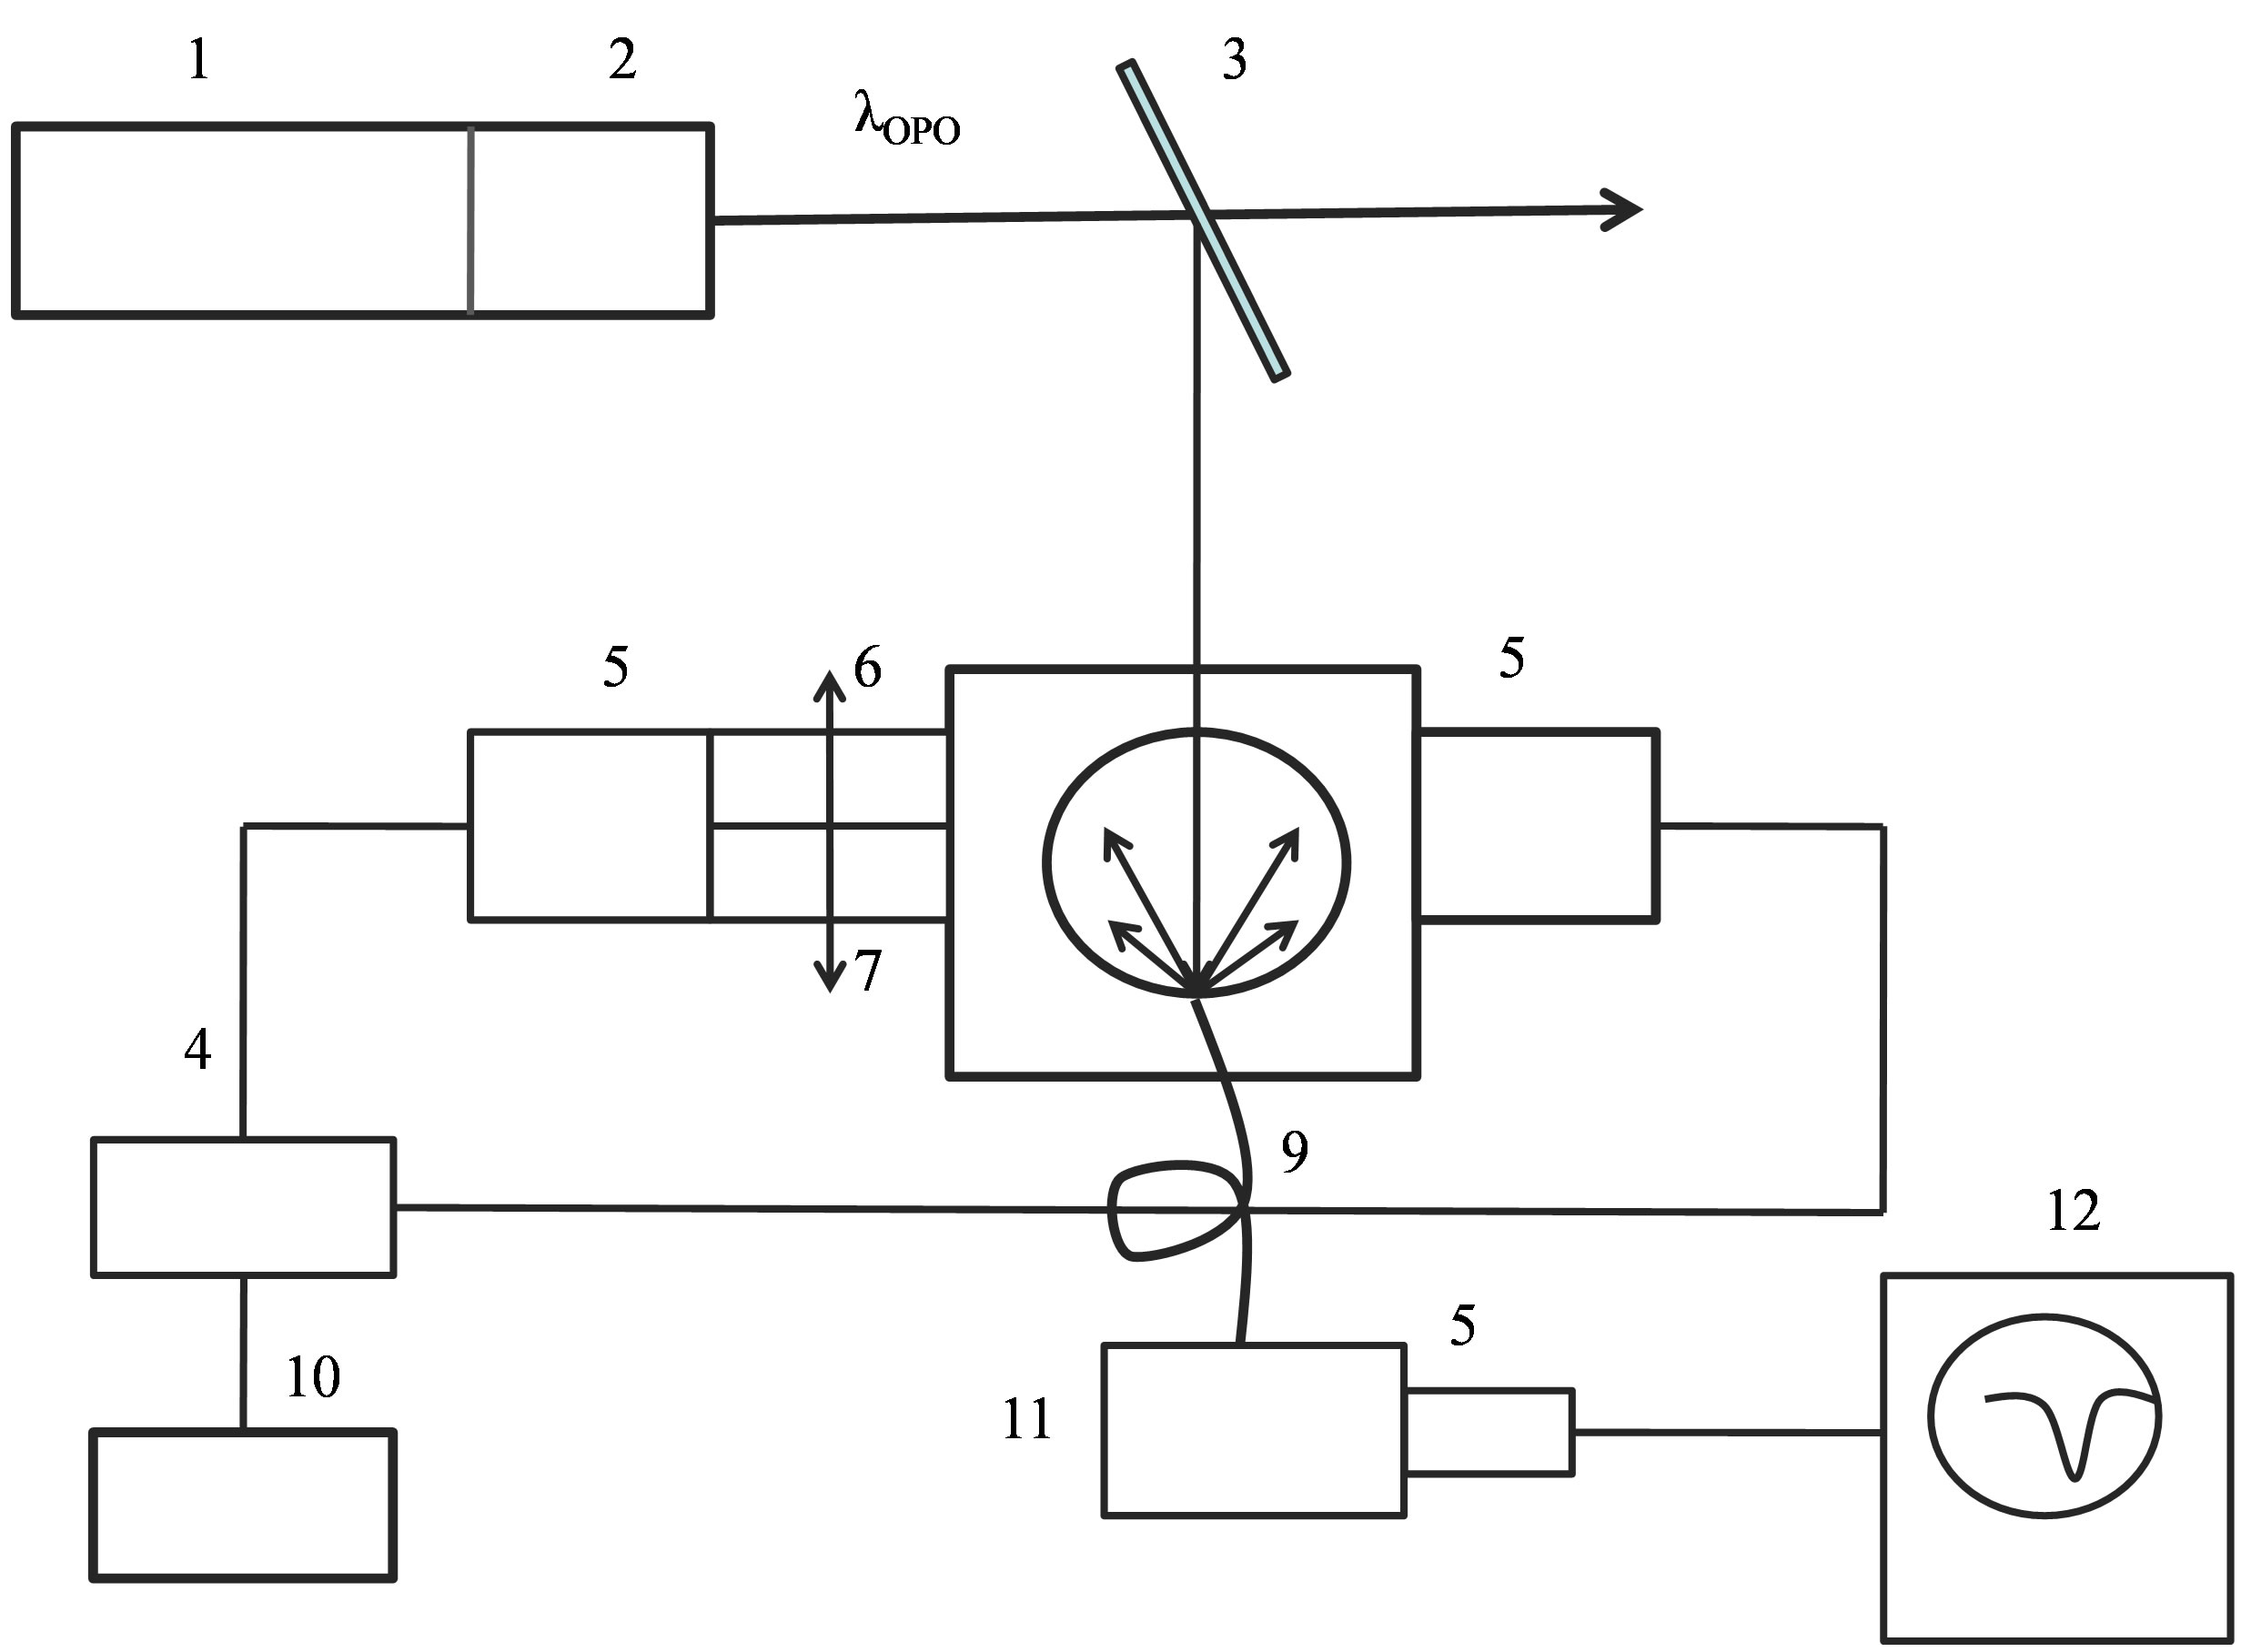
Figure 2. The optical scheme of OPO bandwidth and wavelength measurement. 1—pumping laser YAG:Nd3+; 2—OPO unit; 3—CaF2 plane-parallel plate; 4—analog-digital converter (ADC); 5—FD-219 photodetector with PbSe preamplifier; 6—methane cell; 7—gas cell; 8—diffusing sphere; 9—IR-fiber of CaF2; 10—PC; 11—MDR-12 monochromator; 12—С1-91 os-cillograph.
character. Experimental OPO signal and idler wave divergence values were limited by 3.5 millirad within the whole oscillation range (Figure 3). At minor cavity length variation the value did not change significantly. The received result corresponded to the divergence calculation according to М2 method [12]. Figure 4 shows OPO emission spectra obtained for signal and idler waves.
Figure 4(a) corresponds to OPO emission spectrum without FPE in the cavity. Figure 4(b) shows the degree of OPO emission spectrum narrowing at FPE introduction. Similar spectra were received within the whole range of OPO tuning wavelengths. The narrowing of OPO emission spectrum half width varied from 4 to 5 times. Here the change of OPO emission power was insignificant.