Capital Allocation and International Equilibrium with Pollution Permits ()
1. Introduction
One of the most interesting developments in environmental policy in recent years has been the emergence of global environment as a North-South issue. The close link between global environment and development calls for new insights. In a world of global externalities, national policies have important international repercussions through trade and factor mobility. To be sure that the full impact of environmental policies can be analyzed through to its ultimate effects on factor markets, income and pollution, a general equilibrium approach is needed. This is the way pioneered by Copeland and Taylor [1,2] and Chichinilsky [3] who study the links between trade and environment in a North-South context. Copeland and Taylor [1,4], examine linkages between national income, pollution and international trade in a simple model of North-South trade. By isolating the scale, composition and technical effects of international trade on pollution, they show that free trade increases world pollution. Moreover, an increase in the North’s production possibilities increases pollution while similar growth in the South lowers pollution. In their papers, pollution has only a local nature, in the sense that damages are confined to the emitting country, and they analyze the same questions with transboundary pollution in Copeland and Taylor [5] where countries differed only in their endowment of efficient labor which is the one primary factor. Chichinilsky [3], consider two primary factors, physical capital and environmental resource, and focuses mainly on the consequences of differences in property rights on the common-property problem, giving answers to the presumed comparative advantage in “dirty industries” for developing countries or the compatibility of trade policies based on traditional comparative advantages with environmental preservation. In this paper, we adopt the Copeland-Taylor framework with global pollution produced jointly with consumption good, but we introduce international markets for physical capital and pollution permits.1 Since tradeable emission permits have been introduced in economic theory by J. H. Dales [6] as a new instrument for environmental policy, they have been the object of many studies (Tietenberg [7]). Many of these studies deal with the comparison between emission permits and emission fees and there is now a growing body of literature on their practical application (Noll [8], Hahn [9], Kete [10], Hahn and Stavins [11]). As suggested by Chichinilsky and Heal [12], tradeable emission permits are also a means to secure the biosphere and Chichinilsky et al. [13] have analyzed their use as a policy instrument against greenhouse warming. They show that the manner in which emission rights are initially distributed determines the possibility of the market attaining a Pareto efficient outcome (Jouvet et al. [14] and Jouvet et al. [15]).
Since the Kyoto agreement of 1997, the idea of setting up pollution rights as an instrument of environmental policy for the reduction of greenhouse gases has progressed significantly. Europe, which had been hostile to the creation of such an international market for a long time, seems to have converted to this approach. In spite of the advantages which pollution permits seem to possess in comparison to other systems of environmental regulation (Bohm and Russel [16]), the institutionalizetion of an international market of pollution permits entails several problems (Baumol and Oates [17] Cropper and Oates [18], Pearce and Turner [19]). Among these difficulties, the first one to be aware of is without doubt the definition of an environmental norm necessary for the initial issue of permits.
In fact, seemingly intractable problems emerge as soon as we try to establish what would be the appropriate proportionality parameter in order to implement the initial allocation of permits. Opinions vary greatly in this respect and the list of appropriate parameters, which have been actually been put forward in submissions to the Intergovernmental Panel on Climate Change, is very large (Müller [20]). We have mainly the following:
o Per capita emission.
o Per capita GDP.
o Relative historical responsibility.
o Land area.
o Size of population.
The main question that remains to be solved concerns the economical consequences of those different rules. This question is particularly relevant in the North-South trade context where developing countries are unlikely to participate in the Kyoto agreement expecting that their costs exceed their benefits. For this reason, Bohm and Larsen [21] do not consider developing countries. They evaluate the distributional implications of the reduction costs brought about by various permit allocations in a tradeable permit regime for carbon emissions reductions, for a region consisting of Europe and the states of the former Soviet Union (FSU). They show that initial permit allocations by population and/or GDP are unlikely to induce the participation of most countries of Eastern Europe and FSU because of the net costs involved. They identify a set of initial allocations that would at least compensate these countries. But their analysis only focuses on the distribution of the economic burden of abatement and misses the general equilibrium implications of the allocation rules. In the same way, Koutstaal [22] focuses on the design, implementation and conesquences of a system of tradeable carbon permits to reduce greenhouse gas emissions within the context of the European Union.
In this paper we study an international equilibrium in a two-country model with capital and permit market. We analyze the effects of allocation rules of permits on capital allocation (and consequently on international equilibrium) by considering permit allocation rules proportional to production, emissions, physical capital (in level or per capita) and to population in a general equilibrium framework.
We use the standard technology of production with three factors (capital, labor and emission) in the form proposed by Stokey [23].
We first analyze the international equilibrium. A permit market does not modify the competitive world equilibrium without permits when the total allocation is large enough. When it is not, there exists a unique equilibrium with under-use of the technology, or with full use of the technology in the two countries.
When allocation of permits is not proportional to the emissions in the world without permits, there is a reducetion factor of emissions which results from the equilibrium allocation of capital. The equilibrium level of use of technology is the same in the two countries. It depends both on the total world dotation of permits and its distribution among countries.
The second and main part of the paper is devoted to studying the economic consequences of different permit allocations rules. Three different types of conclusions hold.
A level allocation rule (proportional to outputs, emissions or physical capital) reduces production and emissions in both countries proportionally with a change in the technology used. In this case, each country uses exactly its dotation of permits and the equilibrium allocation of capital is the same as in the economy without permits. In fact, such an allocation is efficient, i.e. it allows maximum production for a given total world dotation of permits. The level allocation rules proportionally diminish output in the two countries whatever their relative wealth.
A North-South distinction (Copeland and Taylor [1]) assumes higher level of efficient labor per capita in the North. This implies that population allocation rule leads to a North-South ratio of permits smaller than the level allocation. This allocation is beneficial for the developing country, increasing capital and production. Moreover, the South is net seller of permits, which gives him an additional income. However, the per capita income remains lower in the South country than in the North country.
Finally, per capita allocation rules (proportional to per capita output, emissions or physical capital) induce a size effect. If the population in the developing country is lower than the population in the developed country, these rules have the same effects as the population rule. But if it is larger, the developed country benefits from the per capita allocation rules.
The remainder of the paper proceeds as follow. Section 2 sets up the model. In Section 3 we study the international equilibrium without permits and in Section 4 we state the conditions under which an international equilibrium with permits exists and is unique. Section 5 deals with the economic consequences of different permit allocations rules and Section 6 presents our conclusions.
2. The Model
We study the international equilibrium for two countries in a simple model with one representative firm in each country. These firms produce the same good with the same technology. We assume perfect mobility of capital but fixed inelastic efficient labor supply  in each country and given total capital stock
 . We also assume that emissions of pollution is a joint product and we introduce an international market of emissions permits.
Given the quotas  for each country, the representative firms can buy or sell it on a permit market, deciding on their emissions as if there was a global world quota. But when the price of permits is positive and there is a reallocation, then the firm’s revenues are modified.
Assuming there exists competitive labor market in each country, wage corresponds to the marginal productivity of labor and the firm’s revenue net of wages includes the net benefit of the permit market. As a conesquence, the rate of return of capital is different from the marginal productivity of capital, as soon as there are transactions on the permit market.
With perfect mobility of capital across countries, only the average returns to capital are equalized to the marginal productivities. Indeed, the permit market modify the net revenue of the firms and thus their value. As a consequence, the equilibrium with perfect mobility of capital will lead to equalizing the values of capital that take into account the net gains on the permit market.
2.1. The Technology
Two countries produce the same good with the same Cobb-Douglas production technology given by
 (1)
(1)
where  and
and  are respectively capital and efficient labor, and
  an index of the technology used with
  With
With ,
,  is the potential output.
The ratio emission  on production
  is an increasing function of
 (2)
(2)
when , the use of all productive possibility leads to the largest emissions and pollution.
Remark 1. This one-good model (see Stokey [23]) can be interpreted as a reduced form of the framework in Copeland and Taylor [1]. In fact, it is equivalent to the following three factor production function

This function,  is homogenous of degree one, continuous and concave with respect to capital, labor and emissions. It is differentiable except at the points at which
 .
.
2.2. Firm’s Behavior
In each country , a representative firm maximize profits with respect to the use of technology
 , efficient labor
  and capital stock
  In addition, firm in country
  hold a given stock of permits
  This initial allocation is different from
  the firm’s demand, which depend of the market price
  of the permit on the international market.
Denote by  the wage in country
  The revenue, including the net gains on the permit market is thus given by
 (3)
(3)
Using relation (2), the problem of firm in country  is
is

The first order conditions are
 (4)
(4)
with  and
and
 (5)
(5)
This last condition gives
 (6)
(6)
Thus, in (4), 
Efficient labor is paid at its marginal productivity according to (4). Decision on the use of technology only depends on the price of permits. Hence, in the two countries the index of the technology used is the same, . Thus profits satisfy
 (7)
(7)
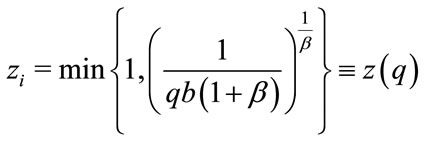
As long as the price of permits is low enough, i.e.
when , in the two countries, the production is equal to its potential output
  which leads to maximum pollution in the two countries. But, as soon as the price of permits exceeds
 , the index of technology used is less than one which implies a reduction in production and thus in pollution.
Note that pollution is reduced in two ways : emissions decrease both with production and the index of technology used (Equation (2)). Following Hahn and Solow [24] (pages 70-71) “...we take it to be characteristic of capitalist firms that their profits go to the suppliers of capital. We assume, therefore, that savings...are used to buy shares in the gross operating surplus of firms.” Therefore the total return per unit of capital,  , is defined by
 (8)
(8)
This implies that
 (9)
(9)
This net revenue  is similar to the gross operating surplus defined by Hahn and Solow. Note that when the price of permits is positive, the permit market modify the firm’s income and so the return of capital which is not equal to its marginal productivity.
According to the price  of permits, two cases occur :
 (10)
(10)
 (11)
(11)
3. Equilibrium
In the absence of mobility of labor, in each country, the equilibrium in the labor market implies the equality of the labor demand  and the supply
In the world without permits, the definition of the equilibrium is standard. It is efficient and gives the maximum of the world production.

This maximum is obtained when the allocation of total capital  is proportional to efficient labor and this leads to the potential world output,
 (12)
(12)
The corresponding total emissions is then also maximum:  Emissions are proportional to efficient labor

with the allocation of permits  in country
 , there is an additional market and we denote
  the equilibrium price on this market. In addition, this market interact with the capital market. The assumption of perfect mobility of capital leads to equality of the two rates of return
  which implies
 (13)
(13)
Finally, the permit market clears, which means
 (14)
(14)
At equilibrium, emissions are
 . Thus, the ratio
  only depends on the equilibrium ratio
  of capital stocks
 (15)
(15)
with 
In a world without permits the equilibrium allocation of capital and emissions are proportional to efficient labor and given by  and
and 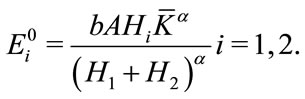
More generally, when the sum of the allocation of permits is at least equal to the maximum of emissions the equilibrium price of permits is zero, total production is equal to potential world output. This holds if

4. World Equilibrium with Reduction of Emissions
When the total dotation of permits does not allow for the maximum of pollution, i.e.

The following study shows the existence of a unique equilibrium, either with under-use of the technology or with full use of the technology in the two countries.
This second possibility occurs when the allocation of permits is not proportional to the emissions in the world without permits. There is then a reduction factor of emissions which results from the equilibrium allocation of capital.
The equilibrium level of use of technology is the same in the two countries. It depends both on the total world dotation of permits and its distribution among countries.
4.1. Equilibrium with Under-Use of Potential Outputs
We begin with some useful concepts in order to study the existence of an equilibrium with under-use of potential outputs.
Equilibrium ratio: At the equilibrium with under-use of potential outputs , emissions
  are proportional to
  (relation (15)), capital stocks are proportional to incomes
  (relation (13)) and incomes are proportional to
  (relation (11)).
This leads to an equilibrium ratio  as a function of
  depending on
 . The equilibrium ratio of emissions
  increases with
  and its value is located between
  and
and  (for details see Appendix A1, Lemma 6).
Proportional allocation: We have a proportional allocation when the allocation of permits is proportional to efficient labor,  , then, there are no transactions on the permit market
 . The index of technology used
  is simply defined by the level of total permits
 , i.e.
  which result from the proportionality properties.
Non-proportional allocation: When an allocation is not proportional to efficient labor , there are permit’s transactions which draw the economy in the direction of the proportional allocation.
Since the allocation of factors are not proportional, then the sum of potential outputs  is smaller than the world potential output and we have
  where
where  is a reduction factor smaller than 1.
At the equilibrium, this reduction factor is a function of the equilibrium ratio:  2 With
 , the reduction factor at equilibrium
  where
where  This reduction factor
  is smaller than 1 for
  More precisely, the larger the gap between
  and
and , the smaller the reduction factor at equilibrium.
Equilibrium: Given  and
and , the equilibrium index of technology used
  is determined by
 (16)
(16)
and  is determined by
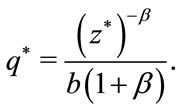
Thus  is equivalent to
To summarize, we have shown the following.
Proposition 1. Given the dotations of permits, and the total capital stock, there exists an equilibrium with under-use of technology if and only if the total dotation of permits is smaller than the product of maximum of emissions with the reduction factor. The equilibrium ratio of emissions is an increasing function of the ratio of dotation and determines the reduction factor.
4.2. Equilibrium with Full Use of Potential Outputs
With full use of potential outputs and positive price of permits we have  and
and 
In the proportional case,  , at equilibrium there is no transactions on the permit’s market.
In the particular case where  any value of the permit’s price
  leads to the same allocation as in the economy without permits. (Appendix A2, Lemma 10)
In the non proportional case , there is a reduction factor
  and with
  we have
 (17)
(17)
This implies  and the corresponding value of
  verifies
  which determines the equilibrium value of
Assume . When
  is large enough, (
 the equilibrium allocation is proportional to efficient labor
 . When it is small enough,
  , there is under use of potential outputs, the equilibrium ratio is
  the reduction factor is
  and
and 
In the intermediate case,  , there is full use of potential outputs but it remains a reduction factor which is smaller than 1 and larger than
The equilibrium ratio of emissions  is intermediate between
  and
and  Indeed,
  is positive for
 and negative for
  (see Appendix A2, Lemma 11).
To summarize, we obtain :
Proposition 2. Assume that allocation of permits is not proportional to efficient labor and total allocation is below the maximum of pollution. Then, there exists a minimum level of total allocation for which the world equilibrium uses potential outputs and the price of permits is positive.
Again, the equilibrium ratio of emissions is located between the ratio of efficient labor  and the ratio of dotations
  More precisely, it is located between
  and the value
 . As shown in the Appendix A2, we have

The unicity of equilibrium results from the three preceding propositions.
The three preceding propositions are illustrated in Figure 1 below.
In the  plane, we have drawn regions corresponding to the different equilibria. In region A, total dotation of permits is at least equal to the maximum of emissions and
  (Proposition 1), in region B total dotation of permits is smaller than the product of maximum of emissions with the reduction factor and there is

Figure 1. Regions corresponding to different types of equilibrium.
under-use of potential output (Proposition 2), and in region C there is full use of potential output and the price of permits is positive (Proposition 3).
5. The Economic Consequences of Allocation Rules of Permits
In order to study the consequences of different allocation rules of permits, we compare the equilibrium with permits to the equilibrium without permits.
Without permits, the equilibrium values of capital stocks , production
 , emissions
  are proportional to efficient labor supplies
  Profits per unit of capital are equal in the two countries (perfect mobility of capital) and equal to the marginal productivity of capital. As shown in Section 3, the equilibrium with permits coincides with the equilibrium without permits when the total dotation of permits allow for the potential world output, i.e.
  and pollution is maximum in this case:
  This is our benchmark case defined by
 (18)
(18)
We assume now that the total dotation of permits does not allow for the maximum of pollution, i.e.
 (19)
(19)
and we consider three types of allocation rules.
5.1. Level Allocation Rules
The proportionality at the equilibrium without permits of capital, output, emissions and efficient labor (Equation (18)) implies that any allocation of permits proportional to one of these levels, leads to the same allocation which we call the level allocation rules. These rules can be viewed as some form of grandfathering3. All these rules are equivalent and they imply that the ratio  is equal to
 .
.
This implies that the equilibrium reduction factor  Under (19), the equilibrium value of the technology index is (Proposition 1 with
 )
)
 4
4
The capital stocks remain unchanged,  , productions and emissions are reduced,

and

The price of permits  is positive, but there are no transactions on the permit market. A level allocation rule simply reduces proportionally production and emissions by applying the technology index
 .
.
This is a consequence of the assumption that the technology of production and the corresponding emission function are the same in the two countries. Because of the effect of the index of pollution, emissions diminish more than the production:  implies
We have the following result of efficiency of this allocation rule: it leads to the maximum of the world production for given total capital stock  and total emission
  (see Prat [25]).
Proposition 3. Given the total capital stock, the maximum of the world production subject to a total emissions constraint is reached at the equilibrium obtained by an allocation rule which is proportional to efficient labor.
Proof. Consider first any allocation  and
and  of
of 
 is the potential production in country
 . The maximum of
  subject to

leads to  This results from the concavity of the problem and the maximization on the Lagrangian

As a consequence, the maximum of world production can be formulated as follow: Maximize with respect to
 and
and ,
,  with
with
 ,
,  subject to
  and
and
 .
.
Replacing , this leads to maximize
  and to the solution
 ,
,

We have shown that for any allocation of capital  the maximum of the world production
  subject to
  is obtained with the same index of technology used
  for the two countries and that the reduction factor is equal to one.
5.2. Population Allocation Rule
A population allocation rule leads to an allocation of permits proportional to population.
Independently of the size of population in the two countries,  a reasonable measure of standard of living per capita is efficient labor per capita. Thus, as in Copeland and Taylor [1], the North-South distinction arises from an assumed higher level of efficient labor in the North, i.e. a larger efficient labor per capita.
We assume that country 2 is a developing country because it has a lower efficient labor per capita than in country 1, say a developed country.

Then an allocation rule proportional to population implies

We compare the effects of this rule of allocation to the preceding rule proportional to , with the same dotation of permits
  verifying (19).
When , the equilibrium reduction factor
  is smaller than 1 and there are two possibilities for the equilibrium according to if
  is larger or smaller than
  If the equilibrium reduction factor is not too low
 , the equilibrium holds with nonuse of potential output
 . If not
  the equilibrium holds with use of potential output
 . More precisely, as a function of
 ,
,  is decreasing with respect to
 , for
, for  and admits a finite limit
  when
when  tends to
  (Appendix A1, Lemma 11). Thus
o If , then for all
 ,
,  is smaller than
  and the international equilibrium holds with
 .
.
o If  and
and  verifies (19), there exists a threshold
  solution of
  such that the international equilibrium holds with
  if
if  and with
  if
if 
Let us define the threshold  such that at equilibrium
  if and only if
  This threshold is
  if
if , if not,
Proposition 4. With the population allocation rule, the world production is reduced; the developing country is net seller of permits, receives more capital, produces more and thus emits more pollution. The developed country is net buyer of permits, receives less capital, produces less and emits less pollution.
Proof. Consider first the case  then
then  and the international equilibrium verifies (Proposition 1, Appendix A1, Lemmas 9 and 10)

and

since 
World production is reduced because its maximum for given  and
and  is reached at the equilibrium with allocation
The capital ratio  is larger than
  because we have from relation (15)

But the sum is the same: . As a consequence,
  and
and . The increase in
  and
and  implies an increase in production for country 2.

This also implies an increase in emissions . Since the world production decreases
  decreases (more than
  increases)

Emissions also decrease:  (the sum is constant)
Moreover,  implies that the developing country is a net seller and the developed country a net buyer on the permit’s market.
Consider now the case  Then,
Then, . At this equilibrium
  is the solution of

and it verifies  (Proposition 2). The preceding arguments then applies without modification. □
Clearly, the allocation rule proportional to population is in favor of the developing country increasing capital and production. An additional advantage is the income from selling permits.
The situation of the developed country is the complete opposite: it looses in all respect: capital and production are reduced and it must buy more permits.
We should also remark that production per capita remains larger in the developed country when , since

Moreover we have Proposition 5. The per capita income remains lower in the developing country than in the developed country Proof. When  we have
The ratio of total income is
Because  and
and  we have
which implies that per capita income in the developing country is smaller than in the developed country. □
5.3. Per Capita Allocation Rules
Per capita allocation rules lead to an allocation of permits proportional to per capita outputs, emissions or physical capital.
We note  the ratio of population
  The three per capita allocation rules are equivalent and lead to a ratio of permits
  Indeed, from Equation (18) we have

Per capita allocation rules induce a size effect relative to the level allocation rules except when . In this case, the two kind of allocation rules lead to
  and we have the same results as in Subsection 4.1.
When , size effect exists.
If population in country 2 (the developing country) is lower than population in country 1, we have  and per capita allocation rules imply
Thus, all the conclusions of the subsection 5.2 hold and a developing country will prefer per capita allocation rules to level allocation rules.
On the contrary, if population in country 2 is larger than population in country 1, we have  and per capita allocation rules imply
This is equivalent to  Relabelling countries 1 as the developing country and 2 as the developed country, the analysis of subsection 5.2 hold without other modifications.
This is to say that now, the developing country is a net buyer of permits, receives less capital, produces less and emits less pollution.
In this case, per capita allocation rules are in unfavor of the developing country.
6. Conclusions
The Second Assessment Report of the IPCC (Bruce et al. [26]), contains the results of a study appraising the economic effects of two allocation rules, the grandfathering rule and the population rule. Developed countries would be net beneficiaries if should quotas grandfathering be adopted and under the population allocation rule the net beneficiaries would be the developing countries.
Our analysis allows us to be more specific on the economic consequences of these different allocation rules. The level allocation rules (which include the grandfathering rule) are efficient and lead to maximum world output once total emissions are given. They imply proportional reduction of pollution in all countries and have no effect on international capital allocation, under the assumption of the same technology in all countries.
The population allocation rule confirms the benefits for developing countries in every respects: production, movement of capital and income from the permit market. Nevertheless, per capita income remains lower in the developing country.
Per capita allocation rules have different size effects, depending on the ratio of population in the two countries. With the same level of population, the per capita rules lead to the efficiency allocation, and thus performs exactly like the level allocations rules. With a different level of population, the developing country benefits if and only if it has a lower level of population than in the developed country which benefits in the opposite case.
Our results shed some light on the recurrent discussion between countries about the initial distribution of permits in a tradeable market. Regarding efficiency, the level allocation rules seems to be the best. But it does not allow for any evolution of the relative income between countries. This shows that this allocation should be linked to redistribution policies. Further research will analyze the welfare effect of the abatement of pollution and the allocation rule.
Appendixes
Characterization of an Interior Equilibrium (z* < 1)
Define 
Dotation of permits  and
and , and the total capital stock
  are given.
o Assume  and
and 
With capital stock  and
and  emissions and profits in country
  are
are

and
o 
o The equilibrium condition (13) on the capital market implies
 (A1)
(A1)
o The equilibrium condition (14) on the permit market with  implies
 (A2)
(A2)
Lemma 6. Equations (A1) and (A2) imply that  verifies
  where
where  and
and
 (A3)
(A3)
The equation  admits a unique solution
 and
and  is increasing with respect to
and  If
If , then
  If
If 
(resp. ), then
  verifies
  (resp.
 )
)
Proof. With  and
and , the equilibrium condition on the permits market (A2) implies:
 ,
,  ,
,  and
and
 . Thus (A1) implies

and this condition is equivalent to  .
.
 is decreasing with respect to
  and
and 

For fixed positive values of  and
and ,
,  increases from
  to
to  when
when  increases from
  to
to . Thus, there exists a unique solution
  of
of  and
and  is increasing with respect to
  and
and 
In addition, we have , thus
 is the unique solution of
Assume , then
  and we have

Thus  verifies
Similarly, if ,
,  verifies
Lemma 7. If there exists an equilibrium with  and
and , this equilibrium is unique and it verifies:
 ,
, 
 (A4)
(A4)
where
 (A5)
(A5)
Proof. The equilibrium verifies (A1) and (A2). The value of the ratio  results from (A1). The equilibrium condition
  implies
  and
and

Defining  according to (A5), we obtain the value of
  given by (A4).
Lemma 8. The function  defined by (A5) is increasing for
  and decreasing for
 ; its maximum
  is equal to 1. The function
 is also increasing for
  and decreasing for
  The limits of
  and
and  when
when  tends to 0 (resp.
 ) are finite and correspond to dotation of all permits to country 1 (resp. country 2).
Proof. Computing the derivative of  leads to
Thus,  has the same sign as
 which is positive for
 and negative for
Since  is increasing with respect to
 ,
,
 is increasing for
  and decreasing for
The limit of  when
when  goes to 0 (resp.
 ) is the solution of

(resp. )
)
These limits are finite and the corresponding limits of  and
and  are positive and smaller than 1.
The limit values 0 and  of
of  correspond to dotations of all permits to one of the two countries (
 if
if ,
,  if
if ). These dotations lead to an equilibrium with
  (resp.
 ) and with
  if and only if
  (resp.
 .
.
Characterization of an Equilibrium with z* = 1 and q* > 0
Dotation of permits  and
and , and the total capital stock
  are given.
o Assume  and
and . With capital stocks
  and
and  emissions are
 and their ratio
verifies (see Equation (15))

with 
Thus, with ,
,  and
and
 we have
 (A6)
(A6)
o At the equilibrium on the permits market,  verify
 and
and
 (A7)
(A7)
where  is the same function
  as defined in Appendix 1 (see Equation (A5))
o The equilibrium condition 13 on the capital market implies (see Equation (10))
 (A8)
(A8)
where  verifies from Equation (10)
Lemma 9 There exists an equilibrium with  and
and  if and only if there exists a solution
  of (A7) and a solution
  of
of , where
 5
5
Proof. The existence of an equilibrium with 
and  implies that
  verifies (A7) and that
 verifies (A8) which is equivalent to

Conversely, consider  verifying (A7) and
  verifying
  Define
  with (A7),
 ,
, 

 These values verify the equilibrium conditions on both markets of permits and capital with
  Thus an equilibrium with
  and
and  exists.
Lemma 10. There exists an equilibrium with 
 and
and  if and only if
  and
and .
.
Then,  defines an equilibrium with
 ,
,
 and any
 ,
, 
Proof.  does not depend on
 . Thus, if
  is an equilibrium with
  and
and ,
,  implies
  and (A7) implies
 since
since 
Conversely, under these conditions,  and any
  verify the existence conditions of Lemma 9.
Lemma 11. If  there exists an equilibrium with
  and
and  if and only if
 where
where
 . this equilibrium is unique and verifies: if
 and if

Proof. The derivatives of  verify :
  and
and
 .
.
o Assume there exists an equilibrium with 
 and
and 
 increases from
  to
to  when
when  increases from 0 to
  The existence of
  solution of
  is equivalent to

And  implies
  (Lemma 6) and
  since
since  for
for  (Lemma 8)
With (A7), for  we obtain the necessary conditions of Lemma 11 and the unicity of
  solution of (A5) and of
  solution of
Existence results from Lemma 9.
o Assume there exists an equilibrium with 
 and
and 
 decreases from
  to
to  when
when  increases from 0 to
  The existence of
  solution of
  is then equivalent to

With  it implies
  and
and
 since
since  for
for  Thus the same conclusions as in the case
  apply.
The proof is complete since  is excluded when
  (Lemma 10).
NOTES
1Copeland and Taylor [4] develop a perfectly competitive general equilibrium model with trade in goods and in emission permits but without capital market.
2This function first increases, reaches a maximum equal to 1 in the proportional case  and then decreases (see Appendix A1, Lemmas 7 and 8).
3In the simple grandfathering allocation, all countries receive permits in proportion to their baseline emissions.
4For further comparison, we denote ,
,  ,
, ,
, the equilibrium values with
5This function is similar of the function  in Appendix A1 and for
 , it coincides with : Thus,