A validated, related substance, GC method for 1,4-cyclohexanedione mono-ethylene Ketal ()
1. INTRODUCTION
Ketal chemically 1,4-cyclohexanedione mono-ethylene ketal is a potential intermediate in organic synthesis [1-3]. Identification of the potential impurity diketal by GC is the main interest of this work. The reported synthesis of monoketal claim 50% of the presence of impurity diketal. This paper describes a simple GC method, which separates ketal from diketal. Ketal also have many importance and its hydrolysis rate has been studied experimentally [4-8]. On its synthesis diketal also formed and it can be detected with the help of gas chromatographic technique [6]. GC method is a powerful analytical technique and used in widely in pharma and biochemical disciplines. GC combined with mass spectral technique activated the research in the field biophysical chemistry. The separation of dikeatl from ketal is an interesting as well as important procedure and no reports available on that. The structures of ketal, diketal are illustrated in Figure 1. Organic impurities can arise during manufacture and storage of drugs and criteria for their acceptance up to certain limits are based on pharmaceutical studies or known safety data [9]. In accordance with regulatory guidelines, pharmaceutical studies using a sample of the isolated impurities can be used for the safety assessment. It is, therefore, essential to isolate and characterize unidentified impurities present in the drugs. Because a process for the synthesis of ketal has recently been developed in our laboratory, a GC method was developed for analysis of ketal and its diketal impurity in the synthetic product. The accuracy, precision, limit of detection (LOD), limit of quantification (LOQ), and linearity of the method were determined in accordance with ICH guidelines [10]. This paper reports, for the first time, a rapid, efficient, simple, and validated GC method for separation of potential impurity. To the best of our knowledge no validated method for the separation of ketal from its potential impurity was available by any of the instrumental technique and hence we have taken this study on the validation of ketal by GC method.

Figure 1. Chemical structures of Ketal and Diketal.
2.METHODS
2.1. Chemicals
Samples of ketal and its diketal impurity were synthesized in our laboratories and characterisezed by use of GC-MS, IR, and NMR. HPLC-grade methanol, HPLCgrade 1,4-dioxane were purchased from Merck and Spectrochem respectively. A stock solution of 1,4-Dioxane as internal standard (0.25 mg/mL) was prepared in methanol (ISTD solution).Working solution of 20 mg/mL was prepared by dissolving an appropriate amount of the ketal in ISTD solution and impurity solution of 0.2 mg/mL was also prepared in ISTD solution for related substances. Working solution of 10 mg/mL each of ketal and of 1,4-dioxane (Internal standard) was prepared in methanol for assay.
2.2. Chromatography
GC was performed with FID detector, an auto sampler, and an auto injector (Shimadzu GC model 2010; Shimadzu, Japan) connected to a FID detector, all were controlled by LC solution software (Shimadzu). Chromatographic separation was achieved for related substance method on a DBWAX ETR, 30 m × 0.32 mm × 1.0 µ Film Thickness column with nitrogen as carrier gas. The injection volume was 2.0 µL, the carrier flow was 7.5 psi constant pressure, the detector temperature was 260℃, the injector temperature was 250℃ and oven temperature was began at 45℃, held for 4 minutes and was then raised to 250℃ at 60℃ min-1 and held for 28 minutes, and detection was with flame ionisation detector (FID). Chromatographic condition was achieved for assay method on a DBWAX ETR, 30 m × 0.32 mm × 1.0 µ Film Thickness column with nitrogen as carrier gas. The injection volume was 1.0 µL, the carrier flow was 7.5 psi constant pressure, the detector temperature was 260℃, the injector temperature was 250℃ and oven temperature was began at 45℃, held for 4 minutes and was then raised to 250℃ at 60℃ min-1 and held for 28 minutes, and detection was with flame ionisation detector (FID). The test concentration for the related substance analysis was 20 mg/mL and for the assay was 10 mg/mL. Standard and test dilutions were prepared in methanol.
2.3. Validation of the Method
2.3.1. Specificity
A method is specific if it can be used to measure analyte response in the presence of potential impurities [9]. The specificity of this GC method for ketal was assessed in the presence of diketal impurity. Assay of ketal was performed after spiking with diketal impurity at the specification level (0.15%). Specificity of the method was further conformed by GC-MS, by comparing the spectral match of the ketal peak at each data point verses the spectra of peak apex.
2.3.2. Precision
The precision of the method was assessed by performing six independent assays of ketal test sample in comparison with reference standard and calculating the RSD (%) of the assay. The precision of the related substance method was checked by injecting six individual preparations of ketal sample and RSD (%) was calculated for the content of impurity peak.
2.3.3. Limits of Detection and Quantification
The limits of detection (LOD) and limit of quantification (LOQ), defined as the amounts for which the signal-to-noise ratios were 3:1 and 10:1, respectively, were determined by S/N ratio method [10]. Precision and accuracy was also studied at the LOQ by injecting six separate solutions of the impurities and calculating the RSD (%) of the peak area.
2.3.4. Linearity
Solutions for testing the linearity of the assay method were prepared for five concentrations from 50 to 150% of the nominal assay concentration of the analyte (5, 7.5, 10, 12.5, and 15 mg/mL). Peak area and concentration data were treated by least squares linear regression analysis. Solutions for testing the linearity of the related substance method were prepared for six concentrations from the LOQ to 500% (1 mg/mL) of the specification level (LOQ, 0.25, 0.5, 1.0, 2.5, 5.0%).These tests were conducted and correlation coefficient was calculated between concentration verses area. The relative response factor was calculated from the slope of the impurity and ketal. Linearity calculations were performed with Microsoft Excel.
2.3.5. Accuracy
The accuracy of the assay method was evaluated in triplicate at three concentrations–1.0, 2.0, and 5.0 mg/mL (10, 20 and 50% of the nominal assay concentration of the analyte). Recovery (%) was calculated from the recovered area. Assessment of the accuracy of the method for analysis of the diketal impurity was performed in triplicate at 0.5, 1.0, 1.2% of the ketal analyte concentration (20 mg/mL). Recovery (%) of the impurity was calculated from the area of diketal in the recovery preparation.
2.3.6. Solution Stability
The solution stability of ketal in the assay method was carried out by leaving test solutions of sample and reference standard in methanol in tightly capped volumetric flasks at room temperature for 24 h. The sample solutions were assayed every 8 h up to 24 h .The solution stability of ketal and its impurity in the related substance method was determined by leaving sample and reference standard in methanol in tightly capped volumetric flask at room temperature for 24 h. Area of the impurity in the sample solution and area of the ketal and diketal in the standard solution were determined every 4 h. Cumulative RSD was calculated.
3. RESULTS AND DISCUSSION
The main objective of the chromatographic method was to separate ketal from potential impurity diketal. In chemoselective reductive alkylation of ammonia with carbonyl compounds LC-MS method was used to identify the ketal [6]. In our study chromatographic separation was achieved for related substances and peak shape of ketal was symmetrical. Under the optimized conditions ketal and diketal were separated with resolution greater than 5; typical retention times of 1,4-Dioxane, ketal and diketal were approximately 6.65, 12.03, 13.46 respectively (Figure 2). System suitability data for the method are listed in the Table 1. The method was specific for ketal and diketal.
Chromatographic condition was achieved for assay and peak shape of ketal was symmetrical. Under the optimized conditions typical retention times of 1,4-dioxane and ketal were approximately 6.8, 12.3 respectively (Figure 3). System suitability data for the method are listed in the Table 2. The method was specific for ketal.
3.1. Validation of the Method
In the study of the precision of the assay method RSD of the peak area for assay of ketal was 0.21% or better. In

Figure 2. Typical chromatogram of system suitability and standard solution.

Table 1. System-suitability report for related substances.
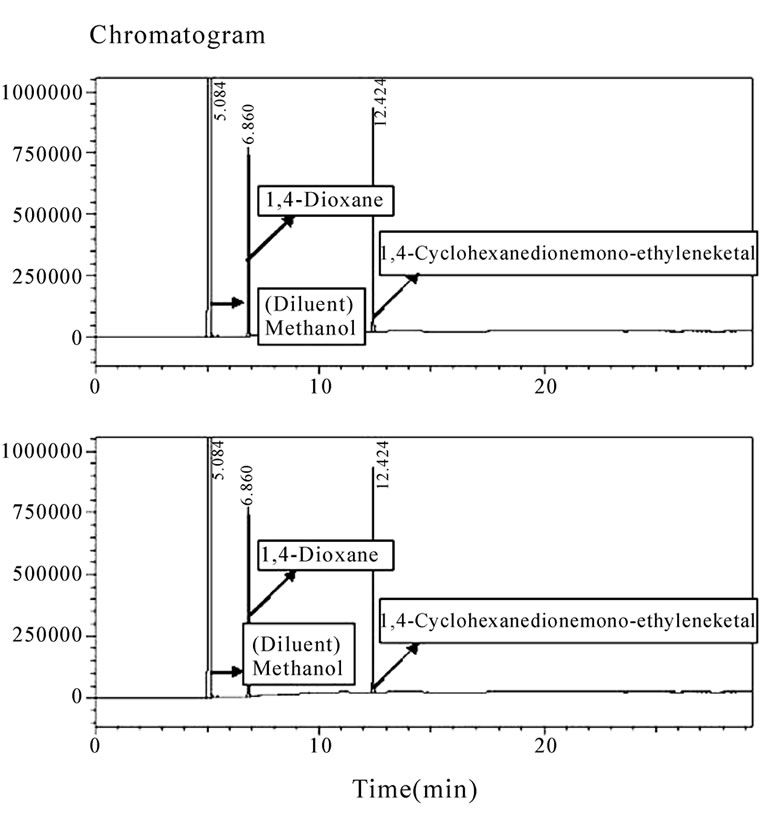
Figure 3. 1,4-cyclohexanedionemono-ethyleneketal standard chromatogram and 1,4-cyclohexanedionemono-ethyleneketal sample chromatogram.
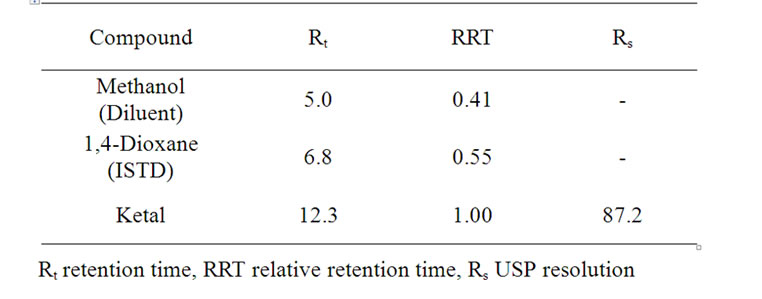
Table 2. System-suitability report for assay.
the study of the precision of the related substance method RSD of the peak area for assay of impurity was 1.10% or better. The limit of detection of the diketal impurity was 0.01% for 2 µL injection volume having S/N ratio 3.2. The limit of quantification for the Diketal impurity was 0.05% for 2 µL injection volume having S/N ratio 12.5 .Precision (as RSD) at the LOQ concentrations was 2.2% for the diketal impurity and recovery at LOQ level was 100%. In the assay method a linear relationship was obtained between response and concentration over the calibration range tested, i.e. 5.0-15 mg/mL; the correlation coefficient was > 0.99999. In the related substance method linear calibration plots were obtained for the diketal impurity over the calibration ranges tested.From the LOQ (0.05%) to 5.0% of the ketal concentration. The correlation coefficients obtained were > 0.999. The relative response factor was calculated as 1.1. These results show there was an excellent correlation between the peak areas and concentration of the impurity. Recovery of diketal from samples ranged from 88.0 to 105.0%. Recovery of ketal sample ranged from 100.7 to 108.6%. RSD for assay of ketal reference and sample during stability experiments was 0.04% and 0.04% respectively. There were no significant changes in the amount of the impurities during solution stability experiments performed using related substance method. The results from solution stability conformed that sample solution in methanol for assay and related substance analysis were stable for at least 24 h.
4. CONCLUSIONS
The GC method developed for quantitative assay of ketal and related substances is precise, accurate, rapid, and specific. Validation of the method furnished satisfactory results for all the method validation data tested. The method can be conveniently used by quality control departments for analysis of related substances, assay of ketal.
5. ACKNOWLEDGEMENTS
The authors would like to thank Prof K.Pandiyarajan HOD of Chemistry,Annamalai university for providing necessary facilities to carry out this work.