Bayesian genetic analysis of milk yield in Tunisian Holstein dairy cattle population ()
1. INTRODUCTION
Milk yield is the most important source of income for dairy farmers where high producing cows are usually profitable [1]. The size of Holstein cow population has substantially increased over the recent years in Tunisia through the import of pregnant heifers and semen from temperate countries. In 2000, Holstein population accounted for more than 40% of the total cows in Tunisia [2]. Cows enrolled in the A4 official milk recording system since the 1960s, were about 10% of the total Holstein population in 2000 [3]. Alternate and owner farm recording systems are being highly encouraged in order to increase the number of cows enrolled in the national milk recording system. The data generated by the milk recording system is not sufficiently and not adequately used and valorized as well, especially because of a lack of genetic evaluation [2].
In livestock animal populations, large sizes of phenotypic observations (or records) are often available at low costs and it is worthwhile to use them to look for statistical evidence of major genes or quantitative trait loci (QTL) by statistical analysis. Segregation analysis is the most powerful statistical method to identify a single gene when DNA marker information is unavailable. With segregation analysis, it is possible to determine, using only phenotypic data sets, whether the inheritance of a given trait is controlled, at least in part, by a single gene with a large effect. Therefore, the existence of major genes has been investigated in several different studies in livestock species: Janss et al. [4] for various traits of Dutch Meishan crossbreds; Ilahi [5] and Ilahi et al. [6] for milking speed in dairy goats; Pan et al. [2] for somatic cell scores in dairy cattle; Hagger et al. [7] for selection response in laying hens; Ilahi and Kadarmideen [8] for milk flow in dairy cattle; Ilahi and Othmane [9,10] for milk yield in dairy sheep.
In a typical segregation analysis using pedigreed animal populations is impossible by analytical approaches due to the existence of many (inbreeding) loops and due to the family sizes, which do not allow summing and integrating out genotypes and polygenic effects from the likelyhood or posterior density. This problem has been simplified by the development of Gibbs sampling, a Monte Carlo Markov Chain (MCMC) methodology [11] and its applications to livestock populations by Ilahi and Kadarmideen [8], Janss et al. [4,12] and Sorensen et al. [13].
The purpose of this paper was 1) to investigate whether a segregating major gene affects milk yield trait, and 2) to estimate the genetic parameters of milk yield in Tunisian Holstein dairy cattle using Bayesian analysis approach.
2. MATERIALS AND METHODS
2.1. Data
Data were from the official milk recording data sets provided by the Tunisian Genetic Improvement Center belonging to the Livestock and Pasture Office, Tunis. Data were recorded between 1996 and 2003. After editing on the herd size (≥20 records), and unreasonable production level (<1000 kg/lactation), the available data used for this paper consisted of 49,709 records of 305-d milk yield (with mean ± standard deviation: 6089.8 kg ± 1939.9) from 26,329 cows in 114 dairy herds. All pedigree information available was included in the analyses (4 generations). Thus, the pedigree included 56,238 animals with 4,670 different sires used within the pedigree.
2.2. Genetic Models
2.2.1. Mixed Inheritance Model
To investigate the presence of a major gene for milk yield in Tunisian Holstein dairy cattle population, the following mixed inheritance model was applied:
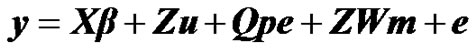
where y is the vector of milk yield collected in 305 days with 2 times milking per day, β is a vector of non-genetic fixed effects including: herd, year-season, and lactation number, u is a random vector of individual polygenic effects, pe is a random vector of permanent environmental effects, W is a design matrix that contains the genotype of each individual (i.e., AA, AB, BB), m is the vector of genotype means (i.e., –a, 0, a), e is a random vector of residual effects, and X, Z and Q are incidence matrices relating the observations to their respective effects. In the term modelling the single major gene, both W and m are unknown and have to be estimated from data by using segregation analysis.
The number of levels of all effects included in the model and the number of animals in the pedigree are summarized in Table 1.
The major gene was modelled as an additive autosomal biallelic (A and B) locus with Mendelian transmission
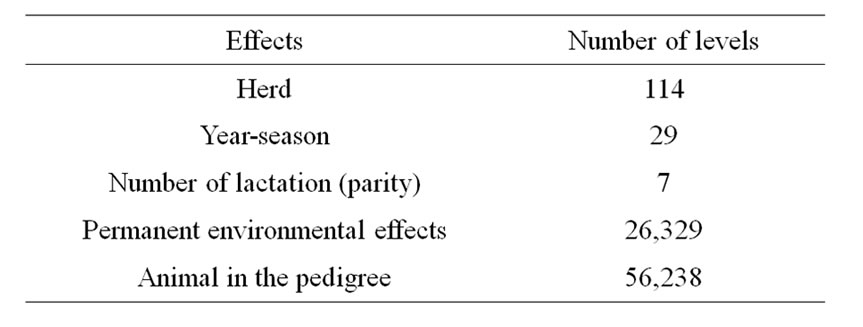
Table 1. Number of levels of all effects used in the analyses.
probabilities. Allele A is defined to decrease the phenotypic value and allele B is defined to increase the phenotypic value (or favourable allele). With these two alleles A and B, with frequencies p and q = 1 − p where p is the estimate of A allele frequency in the founder population in which the Hardy-Weinberg equilibrium was assumed, three genotypes AA, AB or BA and BB can be encountered, with genotype means m = (−a, 0, a), where a is the additive major gene effect.
Distributional assumptions for polygenic effects were, u ~ N (0, A ), where A is the numerator relationship matrix. The distribution of the permanent environmental effects were, pe ~ N (0, I
 ). Residual effects were assumed to be distributed as e ~ N (0, I
 ).
). ,
,  and
and  are polygenic, permanent environmental and residual variances, respectively. The relationship matrix of the full pedigree A was used in the analyses. The variance attributable to the major gene (
 ) was calculated as:
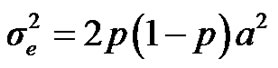 .
.
Uniform prior distributions were assumed in the range (−∞, +∞) for non-genetic effects and effects at the major locus, in the range (0, +∞) for variance components, and in the range [0, 1] for allele frequencies [4].
Gibbs sampling algorithm with blocked sampling of genotypes W was used for inference in the mixed inheritance model and implemented using the “iBay” software package version 1.46 developed by [14].
A single run of the Monte Carlo Markov Chains (MCMC) consisted of 520,000 Gibbs samples, with the first 20,000 samples used for burn-in period to allow the Gibbs chains to reach equilibrium. Thereafter each 10th sample was collected to obtain 50,000 Gibbs samples in total.
From the mixed general model, marginal posterior densities of the following parameters were directly estimated in each Gibbs cycle: variance components ,
,  ,
,  , and
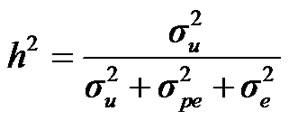
, and , additive effect at the major gene a, allele frequency p, and the Mendelian transmission probabilities. Using variance components for polygenes and major genes, following Janss [14], the heritabilities and repeatabilities were calculated as:
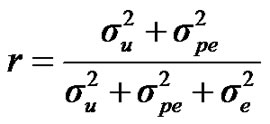
For heritability and repeatability:
 ;
; 
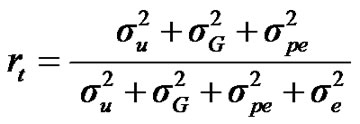
For total heritability and repeatability:
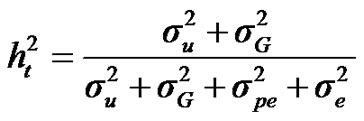 ;
; 
2.2.2. Polygenic Model
The aim of fitting a polygenic model to analyse again this data was to obtain genetic parameter estimates of 305-d milk yield in Tunisian Holstein dairy cattle population, and to compare them with those obtained using the mixed inheritance model, to check the mode of inheritance of this trait.
Based on the same statistical model used in mixed inheritance analysis described above, the variance components under a polygenic model of milk yield were estimated by Bayesian analysis, using the “iBay” software package version 1.46 as well [14].
3. RESULTS AND DISCUSSION
Marginal posterior means and standard deviations of parameter estimates of 305-d milk yield in Tunisian Holstein dairy cattle population using Bayesian segregation analyses implemented by Gibbs sampling are presented in Tables 2 and 3. These estimates were based on 50,000 Gibbs samples. Posterior marginal distributions of all variance components of milk yield trait are shown in Figure 1.
According to Box and Tiao [15], the highest posterior density regions (HPD), based on a non-parametric density estimate using the averaged shifted histogram technique [16], were obtained for all model parameters. These highest regions were constructed to include the smallest possible region of each sampled parameter values. The highest posterior density regions at 95% (HPDs95%) of the additive gene effect (a) and the variance at the major locus ( ) included zero (Table 2). The allele frequencies in the studied population were p = 0.77 and q = 1 – p = 0.23. The estimated polygenic variance (
 = 402866.28) was significantly higher than the major gene variance (
 = 68276.83). Janss et al. [17] and Miyake et al. [18] also suggested the use of the magnitude of the major gene variances as an indicator for the existence of a segregating major gene. Following Elston [19], the evidence of a significant segregating major gene in quantitative traits requires three conditions: statistical significance of the major gene component in the model, statistical differences among the transmission probabilities and these transmission probabilities are significantly different from an environmental model.
To check the statistical significance of the major gene component in the model, Janss [14] proposed to check the 95% highest posterior density region (HPD95%) of the postulated major gene variance: if the 95% HPD does not include zero (the postulated major gene is statistically significant) or includes zero (not significant).
The Mendelian transmission (probabilities 1, 1/2, and 0) was tested by checking if the highest posterior density regions at 95% (HPDs95%) were overlapped or not. Mendelian transmission probabilities for the 3 genotypes were estimated (Table 3) as suggested by Elston and Stewart [20]. These probabilities were parameterised to indicate the Mendelian transmission of the favourable allele, with probabilities of B allele transmission of 1, 1/2, and 0 for genotypes BB, BA, and AA, respectively.
Results in Table 3 showed that the three estimated posterior means of Mendelian transmission probabilities were not significantly different, and as well their highest posterior density regions at 95% (HPDs95%) for the three genotypes were overlapped. Furthermore, the density of marginal posterior distribution for the major gene variance (Figure 1) was unimodal marginal density with mode = 0, suggesting the absence of a major gene for the analysed trait [4,21].
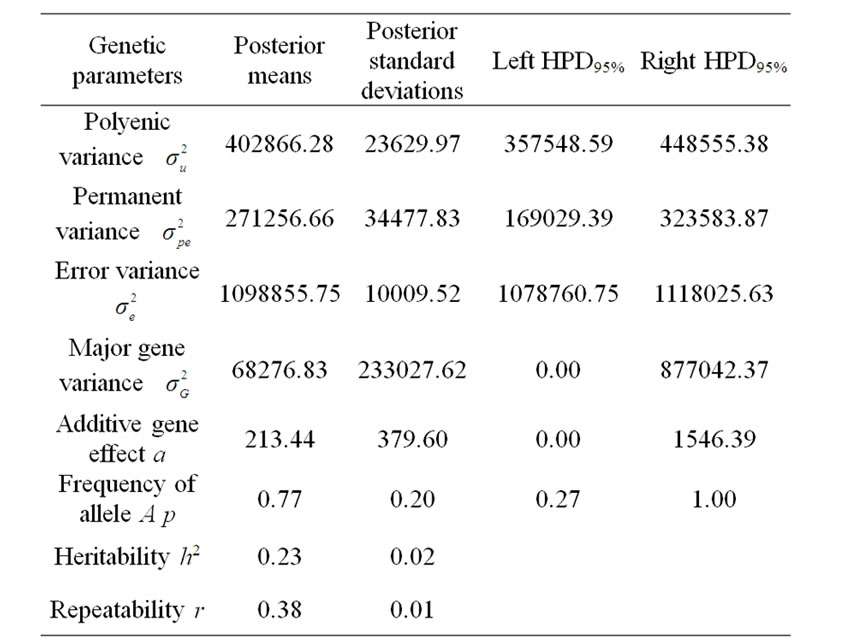
Table 2. Estimated marginal posterior means and marginal posterior standard deviations for fitted parameters from mixed model and left and right 95% highest posterior density regions (HPDs95%) for 305-d milk yield in Tunisian Holstein dairy cattle population, based on 50,000 Gibbs samples.
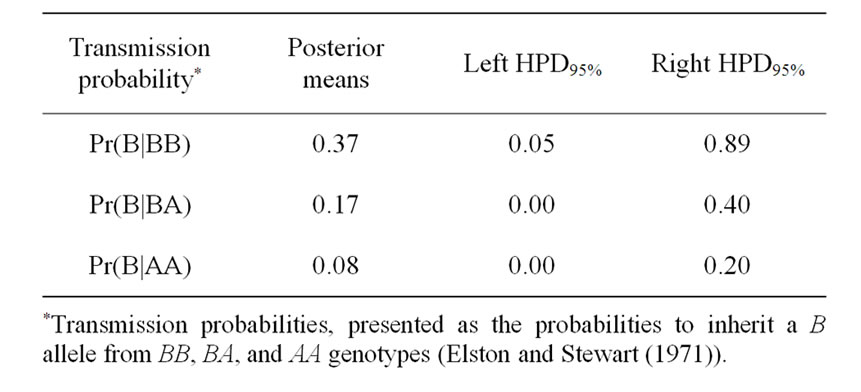
Table 3. Estimated marginal posterior means, left and right 95% highest posterior density regions (HPDs95%) for transmission probabilities using mixed model for 305-d milk yield in Tunisian Holstein dairy cattle population, based on 50,000 Gibbs samples.

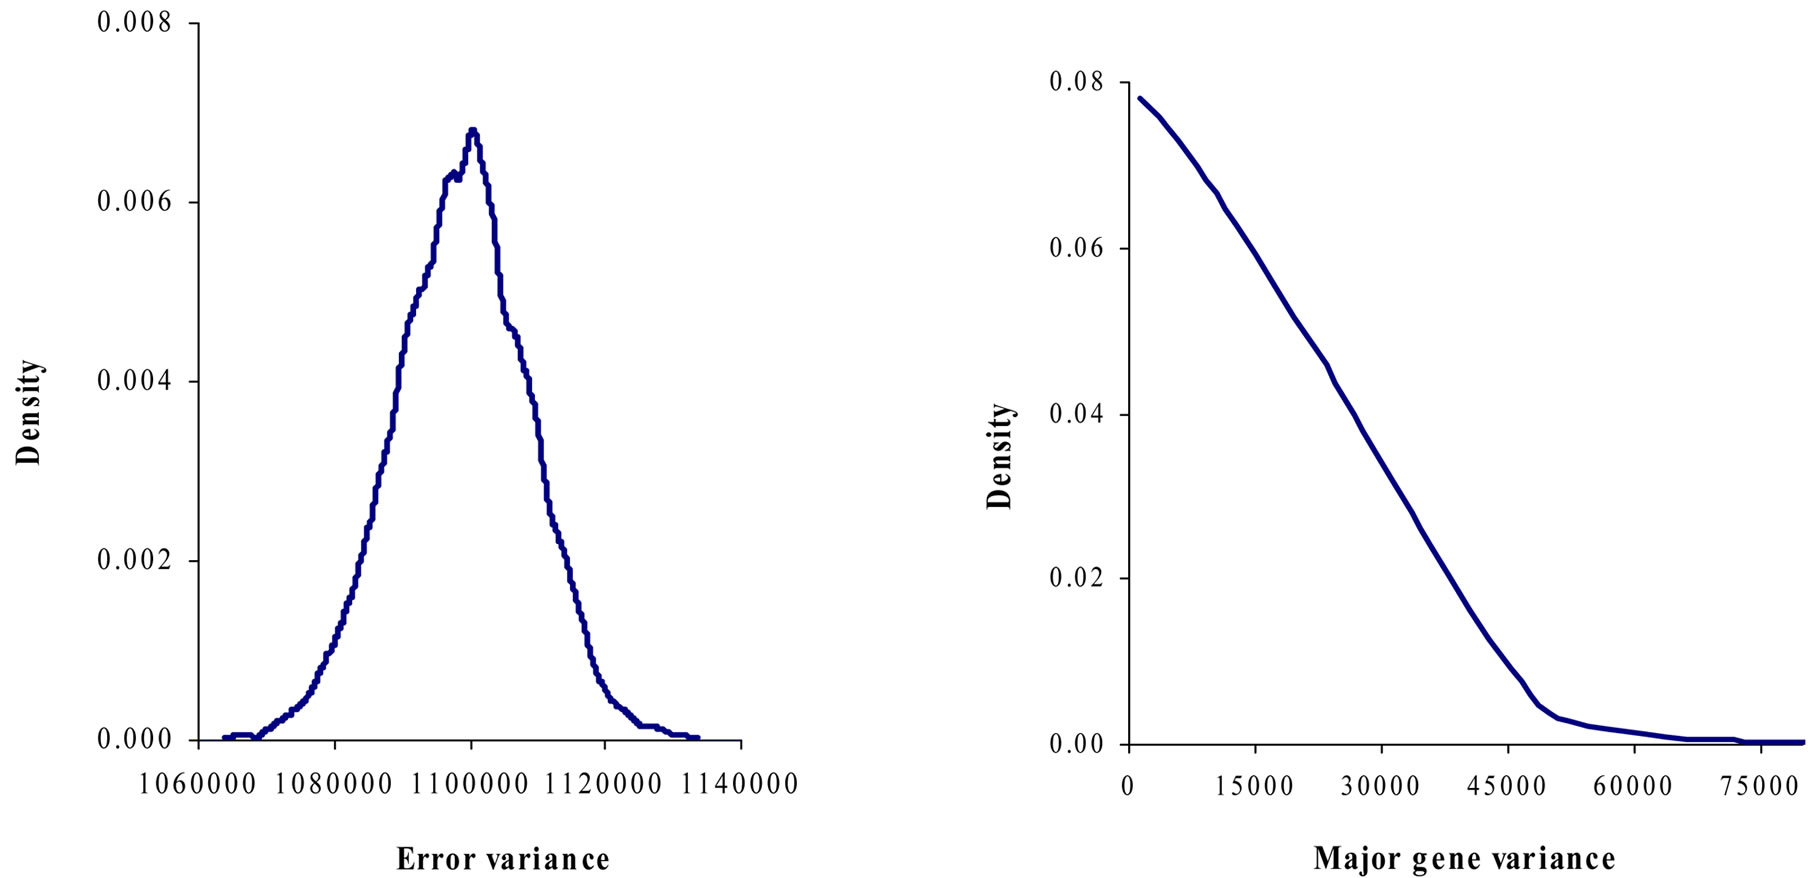
Figure 1. Marginal posterior distributions of polygenic variance, permanent environmental variance, error variance and major gene variance from mixed model of 305-d milk yield in Tunisian Holstein dairy cattle population.
According to these results obtained from segregation analysis via Gibbs sampling based only on phenotypic data sets, we can conclude that the postulated major gene was not significant and the genetic inheritance of milk yield in Holstein dairy cattle is polygenic.
Estimates of genetic parameters were consistent across models mixed and polygenic models (Tables 2 and 4). This finding confirmed again that the postulated major gene is not significant on milk yield in Holstein dairy cattle.
The variance components under polygenic model of 305-d milk yield were estimated by using Bayesian analysis approach. These estimates were based on 50,000 Gibbs samples and were given in Table 4. Estimated heritability for 305-d milk yield using polygenic model (0.22 ± 0.012) was in accordance with previous estimates (0.25) on the same population obtained by Ben Gara et al. [22] and Hammami et al. [10]. However, this heritability value was still lower than those reported by several studies [23-25]. The low estimates for heritability might be explained by the limited production levels in Tunisian dairy cattle populations and the incomplete and/or inaccurate pedigree information on imported semen of some sires [3]. Repeatability estimated using polygenic model
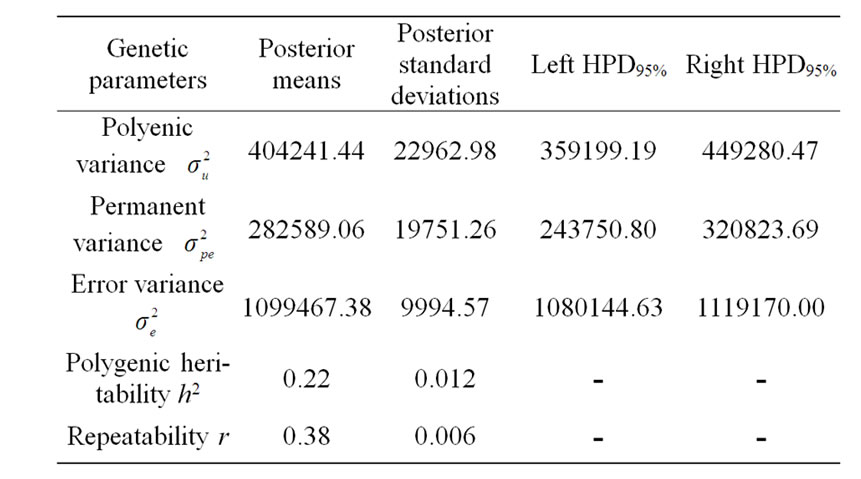
Table 4. Estimated marginal posterior means and marginal posterior standard deviations for variance components from polygenic model and left and right 95% highest posterior density regions (HPDs95%) for 305-d milk yield in Tunisian Holstein dairy cattle population, based on 50,000 Gibbs samples.
(0.38 ± 0.006) was comparable to those found in the literature [22,26-28].
4. CONCLUSION
The mode of inheritance and genetic parameters of 305-d milk yield in Tunisian Holstein dairy cattle population were investigated and estimated under mixed inheritance and polygenic models via Gibbs sampling. Milk yield heritability was relatively low because of the low production levels in such a population, and for lack of information on pedigree of some imported sires. Our results based only on phenotypic data showed no existence of major gene and the mode of inheritance for milk yield in Tunisian Holstein dairy cattle population is then purely polygenic.
5. ACKNOWLEDGEMENTS
Authors thank Dr. L. L. G. Janss for supplying the “iBay” software for the analysis. Authors also thank Tunisian Livestock and Pasture Office for providing the data.
NOTES