Classifications of Satellite Imagery for Identifying Urban Area Structures ()
1. Introduction
Remote Sensing is one of the most important technologies in space science. It provides high-resolution satellite images with high accuracy of large areas of land periodically and at various times, which contributes to providing information to assist research and studies on environmental protection, the exploration of natural resources, urban planning, agricultural crop control and other vital civil and military development areas. In fact, the structures, plans, and development of cities in the East differ from those of the West. Therefore, it was important to choose a method that uses remote sensing technology that can be easily used in eastern countries that lack the required advanced technologies high-resolution, multi-source that is effective in terms of cost.
Sensors enable the observation of all phenomena, changes, and movements on the surface of the Earth from a great distance and at a high speed as in aerial images.
To extract data from satellite images, a series of processing operations are conducted, the last of which is data classification. There are different types of classifications that focus on the spectral signature of objects’ spatial and textural characteristics in urban areas. Such classifications are used to create accurate urban maps through processing satellite data with the application of different methods [1] - [6].
Although remote sensing data is used in many studies, their utilization is less common in urban studies due to the limited available choices when it comes to the most suitable, accurate and high-quality data, as well as the multiplicity of different methods and techniques [7] [8] [9] [10] [11].
As the methods, procedures and softwares used in the processing and analysis of remote sensing data in territorial and urban studies vary, the current study focuses on the differences between two of them: the Pixel-Based Classification (image pixel classification, regression, etc.) and the Object-Based Classification which depends on position or location algorithms [6] [12].
Jamil study aimed at the development and implementation of a generic procedure for the acquisition, processing, analysis and cartographic visualization of urban space in arid zone cities based on operational remote sensing imagery. As evidence of the concept of the Yemeni capital, Sanaa has been selected as a use case [13].
The workflow developed is based on standard procedures and systems of spatial information processing and allows for subsequent automation of its essential processes. The study used satellite data from QuickBird which applied pixel and object classification. The study revealed that the pixel-based classification is more accurate than object-based classification.
Fadi study aimed was to evaluate land use/land cover classification for urban areas, whereas the data of the study area consists of very high-resolution imagery of red, green and blue bands collected by a basic, off-shelf and simple Unmanned Aerial Vehicle [14].
Pixel-base and object-based classification used in this study. The study concluded the pixel-based is still effective and can be used for Unmanned Aerial Vehicle imagery.
This paper will compare the classifications of satellite data for Jeddah and determine its urban structure, design and produce maps including buildings, plants, and streets.
2. Objectives and Study Area
Oriental cities, especially in arid and semi-arid areas, differ from Western ones in structure, planning and development. It was, therefore, important to choose a method which utilizes a Remote Sensing technology that can easily be used in oriental countries which lack the required advanced technologies and the high-accuracy, multiple-source and cost-efficient Remote Sensing data.
The main objectives of this study are as follows:
• to compare the classifications of satellite data of the city of Jeddah and to assess its accuracy and quality.
• to identify the urban structure of the study area.
• to design and produce maps of Jeddah which include buildings, vegetations, and streets.
Jeddah is located in the centre of the Red Sea coast of western Saudi Arabia and is one of the oldest cities in the Kingdom. The city lies within the western coastal plain of Tihama on the Red Sea. From the east, Jeddah is adjacent to a range of hills and mountains the highest of which is about 500 meters above sea level. A rainwater drainage system goes through its eastern side where valley tributaries after the rain season are rich with quaternary sediments which contribute to the formation of groundwater reservoirs [15] [16].
In order to reduce the risk of floods, dams were constructed. A network of canals which runs through the city channelling drainage water to the sea was built to protect the urban areas that extend eastward reaching the basins as shown in Figure[10].
Figure 1 shows the study area and its administrative divisions, including the center of the city (Old Jeddah) where the first phase of development of the city started.
The city back then was surrounded on three sides by a wall. Figure 2 shows an aerial photograph taken in 1938 displaying the size and shape of the city and its walls and gates: the southern wall with Bab Sharif Gate at its centre and Bab Mecca Gate in the middle of the eastern wall. The city of Jeddah seems to have been confined within these walls except for Ummana Hawwa and Al-Asad cemeteries and a few large buildings such as the Al-Qashla (military garrison) which were outside the walls.
Figure 3 shows part of Jeddah’s coast and part of its northern and western wall with Al-Madinah Gate at the centre of the north wall and the port and the sea to its west. We can also see from this side Al-Kendasah building (a water desalination plant) painted in black, the prison building and the police station on Al-Arbaeen Lake.
Based on Figure 1 and Figure 6, we can see how Jeddah expands northward and southward which indicates that it takes a vertical trajectory in its expansion due to the existence of natural barriers (the sea to its west and the mountain range to its east).
3. Data and Software/Data and Tools
3.1. Data Description
1) Satellite images were taken by GeoEye-1. A total of 12 images taken over 2 tracks, each one of which yielded 6 images.
![]()
Figure 2. Tilted aerial picture of the city of Jeddah in 1938 (Aramco archive).
![]()
Figure 3. A tilted aerial view of the waterfront of the city in 1938 (Aramco Archives).
Resolution Pan Pixel Size 0.50 m.
MS Pixel Size 2 m.
Nominal Swath Width 15.2 km at Nadir.
Map Projection: Universal Transverse Mercator.
UTM Specific Parameters.
Hemisphere: N.
Zone Number: 37.
Datum: WGS84.
File Format: GeoTIFF.
Each of these images has Blue Green and Red bands (BGR) and the Near Infrared band with a spatial resolution of 200 cm. Each image is assigned a unique ID which includes the date/time.
Acquisition Date/Time: 2014-02-01 08:12 GMT Product Image ID: 005.
Acquisition Date/Time: 2014-02-28 08:07 GMT Product Image ID: 004.
Acquisition Date/Time: 2014-02-28 08:08 GMT Product Image ID: 003.
Acquisition Date/Time: 2014-03-22 08:18 GMT Product Image ID: 002.
Acquisition Date/Time: 2014-03-27 08:03 GMT Product Image ID: 001.
Acquisition Date/Time: 2014-05-12 07:54 GMT Product Image ID: 000.
Panchromatic (Pan).
Black & White.
450 - 800 nanometers.
Multispectral (MS).
Blue: 450 - 510 nanometers.
Green: 510 - 580 nanometers.
Red: 655 - 690 nanometers.
Near IR: 780 - 920 nanometers.
2) Tilted monochrome aerial photographs taken in 1938.
3) Topographic maps Scale 1: 25,000.
3.2. Remote Sensing Softwares
• Erdas Imagine version 14 from Intergraph Corporation (Hexagon) USA.
• eCognition Developer version 8 from Trimble Germany GmbH.
• The GIS software ArcGIS version 10.3 for Desktop from Esri.
• A Garmin GPS device.
4. Methodological Procedures
4.1. Space Image Processing
The images were processed following these steps:
1) Layer Stack was required at the beginning for each Multispectral layer of the GeoEye-1 satellite data in RGB & IR as mentioned in 3.1.1. In Figure 4, which shows each item separately, HCS Resolution Merge was used to merge Panchromatic with Multispectral bands to maximize the resolution to 50 cm. This step was duplicated with each image.
2) Figure 5 shows the result of merging the Multi-Spectral (MS) images at a 2 m pixel size and the Panchromatic image (P) at a 50 cm which is the Multispectral and Panchromatic (MS + P) image (50 cm). This merged image was used later in the classification.
3) The image geometric correction was conducted through taking a set of about 60 (GPS) points distributed over all parts of the image.
4) Image Mosaicing.
In this step, 12 interrelated and overlapping digital images were combined to form two parallel lines covering the entirety of the city of Jeddah in one image through the use of Enhanced Compression Wavelet (ECW), which compresses extremely big images while maintaining their high quality as shown in Figure 6.
![]()
Figure 6. Image mosaicing to combine images in one image.
Schematic representation of the process for developing a generic procedure:
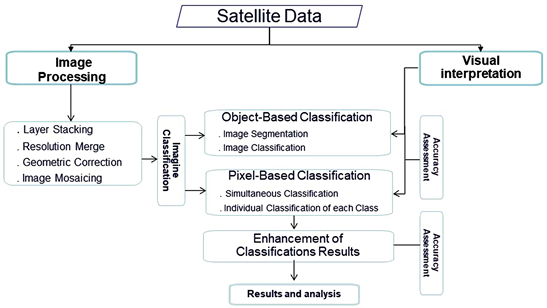
Description of Classifications
For Jeddah city, five classes were identified according to the spectral reflections for each class such as buildings, streets, vegetations, water bodies and vacant land.
• The rooftops of the buildings differ in terms of construction materials. Some of them are covered with assorted coloured tiles while others had grey or white roofs. Other buildings had roofs of concrete, zinc or other materials. The roofs of commercial buildings such as warehouses, workshops, factories, etc. were often blue or white.
• Asphalt streets: the main ones are branched out and sand covers parts of them.
• Vegetations: trees, grass, or agricultural plants.
• Water: open swimming pools, which are very limited in terms of space, and sea water.
• Vacant land: vacant pieces of land scattered throughout the city for use as temporary parking spaces or land prepared for construction plans.
4.2. Satellite Image Classification Using ERDAS IMAGINE Software
To perform the supervised classification of space images, signature collection was conducted as it is the basis of the classification. The sample selection process is particularly important since the more accurate the band correlation in the sample is, the more accurate the classification results are.
Therefore, several spectral signature samples were taken for all the sand, concrete or metal surfaces, in addition to vegetations. Samples of asphalt-paved streets were also taken, but not the unpaved roads.
The classifications covered in this paper are divided into two types:
1) Pixel-Based Classification with which Erdas Imagine was used.
2) Object-Based Classification with which eCognition was used.
4.2.1. Pixel-Based Classification
1) Simultaneous Classification of all four identified classes of objects using the following supervised classification methods.
a) Maximum Likelihood (ML): “This method is for determining a known class of distributions as the maximum for a given statistic” [17]. An assumption of normality is made for the training sample. “The algorithms build on the probability density functions for each category. During classification, all unclassified pixels are assigned membership based on the relative likelihood (probability) of that pixel occurring within each category’s probability density function” [18].
b) Minimum-Distance (MD) classification “rule is a measure of similarity between distribution functions which need not necessarily possess all the properties of a metric”. The MD classification “can be performed also using distance measures other than Euclidean” [19].
2) Individual Classification of each Class
This classification method depends on taking the sample training of a single class of classification (rather than of all four classes at once) and processing them using the MD method. This process is repeated with each class of classification [13].
4.2.2. Object-Based Classification
To implement this process, eCognition software was used. eCognition is a commercially available program that uses a segmentation image algorithm. Two steps were followed to deal with the available satellite images.
1) Image Segmentation
The process of Image Segmentation is conducted through combining a set of vastly different pixels in the form of homogeneous segments of shape and size with a set of criteria/the set criteria. There are three types of segmentation:
• Edge Segmentation
• Point Segmentation
• Regions Segmentation
In this study, Regional Growth processes are used to merge regions or pixels that are homogeneous or have the same merging criteria. Figure 7 shows the values processed by the software to begin the process of segmentation based on these values.
Three levels of Image Segmentation were also performed. Table 1 shows the changed values that the software used to calculate the allowed homogeneity in order to achieve hierarchical segmentation according to the data that fits the shapes and sizes of buildings, facilities, streets, and agricultural fields.
Figure 8 shows the three levels that were implemented using eCognition. On the left side, we can see how the image was segmented as we can see to the right the different levels and stages of segmentation. Below is the picture before segmentation. At Level 1, we can see the segmented image at 50 where the segmentation is small which is not compatible with the actual shape and size of the objects on the ground.
![]()
Table 1. The variable values used in the implementation of hierarchical segmentation.
The second level was set at a scale of 90 while the last level was set at 200. It is at this level that the segmentation corresponds to the size and shape of the ground units, especially with the buildings.
2) Image classification
Once the segmentation process was done after determining the levels of segmentation, the classification process was based on the sample training and the selection of the samples taken for each class, which can also be used to identify and label the classification classes.
The satellite image of this study was automatically classified on the basis of the nearest neighbour. In the case of errors in classifying the classes, manual correction was conducted. Such corrections were to be made by a person commanding the necessary experience and knowledge of the study area. For the sake of accuracy, manual correction was used for the classification.
4.3. Enhancement of Classifications Results
A range of techniques were used to improve the results of the classifications such as the Clump Splitting where the adjacent pixels are selected and arranged in groups to facilitate the elimination process which excludes certain areas of the pixels specified by Clump. 100 pixels were deleted from the simultaneous classification class (see 4.2.1.1). The same number of pixels would be deleted from all the classes of classification evenly. As for the Individual Classification type (see 4.2.1.2), 35 pixels of buildings, 10 pixels of plants, 30 pixels of vacant land and 90 pixels of streets were deleted. The areas that were deleted were either small spaces that do not belong to the class in which they were found, or small, irregular areas which were not applicable to this classification. Whenever there was vacant land in a class, dilation is applied to close any spaces within each class.
4.4. Classification Accuracy Assessment
Two methods were used to evaluate the accuracy of classification:
• Visual interpretation which compares the results with the original satellite images to know and estimate the accuracy of the classification.
• Accuracy assessment using Erdas Imaging, based on the reference pixel group. These are marked points on the image which define its actual data. Random reference data is compared to the data of the classified image whose value was collected through the remote sensor or classifier. This method produces the following set of processes:
1) Overall accuracy which calculates the total number of pixels that are categorized correctly divided by the total number of pixels in the image.
2) Producer accuracy which calculates the total number of correctly categorized pixels for one class divided by the total number of pixels in the same column.
3) User accuracy which calculates the total number of correctly categorized pixels for one class divided by the total number of pixels in the same row.
4) Kappa Coefficient is a measure to assess the overall accuracy of the classification and is based on dividing the number of classification classes by the number of reference points, as suggested by [20]. Ortiz et al. have set 5 levels in this assessment, starting from the assessment of the bad rating to the excellent as shown in Table 2.
5. Results and Analysis
This section deals with the results of the classifications that have been introduced by this study and compares them to each other as follows:
5.1. Pixel-Based Classification
All classes in the image were classified in advance based on the signature collection.
1) The simultaneous classification of all classes produced four classes: plants, buildings, vacant land and streets. Figure 9 shows the classification classes and some of the classification errors. For example, with certain pixels, cars were classified as buildings due to the resemblance between their respective spectral reflections (metal roofs of warehouses and cars) in these pixels. Another error was classifying shades, dark stones and asphalt waste as streets due to the same problem of spectral reflection resemblance. A similar error was the result of misclassifying certain buildings because of the metal objects such as water tanks or satellite dishes on their roofs.
In order to avoid these errors, a number of techniques were applied as explained in 4.3.
Figure 11 shows the enhancement results as demonstrated through comparing it to Figure 9. Through the application of the enhancement techniques, the error pixels in Figure 9 were corrected in Figure 11 to show the correct class. For examples, the cars which were in Figure 9 classified as buildings were in Figure 11 deleted and the pixels merged with the street class.
![]()
Table 2. Assessment of classifications according to (1997) Ortiz et al.
![]()
Figure 9. The classification classes before enhancement (on the right) and after (on the left).
2) Individual classification of each class
This type of classification identifies only one class at a time.
Figure 10 consists of three separate sections where each section shows a single class: buildings, vegetations and streets, respectively, before maximizing the classification accuracy. As part of visual interpretation, the original image was compared to the results of the classification in order to identify the errors and assess the accuracy of each class.
What distinguishes this classification type is that we can define the number of pixels that were deleted from each class to improve the classification.
On the right side of Figure 11 we see the building class and on the left the street class after enhancing the classification result accuracy.
Figure 12 shows the vegetation class. The image on the right displays the vegetation before the enhancement process. On the left we notice that the pixels that represented small areas in the vegetation class were deleted from the classification.
![]()
Figure 10. Vegetation, street and building classes before the improvement process to increase classification accuracy.
![]()
Figure 11. Buildings on the right and streets on the left after the improvement process.
![]()
Figure 12. Plant class before and after classification improvement.
The fourth class in the simultaneous classification was excluded from identifying classes individually. Whatever did not belong to any of the previous three classes was considered barren land or free space and was disregarded as it could change within a short period of time through the erection of buildings, etc.
5.2. Object-Based Classification
This classification was based on segmentation as shown in Figure 8. Training areas were obtained through segmentation in order to identify all the classes in the study area simultaneously. This classification’s results are shown on Figure 13. The results were subjected to visual interpretation through comparing the original image to the classification result. To further enhance the accuracy of the results, a manual classification was conducted.
In Figure 14, we can see the original image compared to the classified one based on the object.
The results of the object-based classification will be disregarded in the final findings of this study and, therefore, will not be included in the accuracy assessment because it categorizes all buildings in a certain area as one building, which is the result of not depending on pixels.
![]()
Figure 13. Classification process by eCognition software.
![]()
Figure 14. The original image of the Segmentation (Right) and classes by class using eCognition software (Left).
5.3. Accuracy Assessment
Table 3 shows the accuracy percentage in the pixel-based classification in terms of User Accuracy (UA) and Product Accuracy (PA) before and after enhancement. The Overall Classification Accuracy improved from 75% to 84%.
Table 4 shows the classification accuracy based on the kappa coefficient (k), which was 0.51 before enhancement but improved after enhancement to become 0.83. Ortiz and others consider kappa coefficient results from 0.80 to 1 excellent (See 4.4.) This method of accuracy assessment was applied only to the Simultaneous Classification of all four classes.
Table 5 displays the overall classification accuracy of the Individual Classification
![]()
Table 3. Result accuracy assessment in terms of UA and PA for all classes.
![]()
Table 4. Result accuracy based on the kappa coefficient.
![]()
Table 5. Result accuracy assessment in terms of PA and UA in the individual classification of each class.
of each class which was 89% before enhancement and 91% after. Based on findings from the different types of classification, the most accurate results were the ones obtained through the Individual Classification of each class.
Based on the statistical evaluation of the overall classification result accuracy, which is supported by the visual evaluation results, it is obvious that the best classification type is the Pixel-Based Individual Classification of each class. Hence, we opted for adopting this type for creating maps of Jeddah.
Individual Classification results: As mentioned earlier, the three classes focused on in this type of classification are: vegetations, buildings and streets. Figure 15 shows plants in different areas of Jeddah city. Their concentration increases in the eastern and eastern-southern areas, especially at the valleys. The
![]()
Figure 15. Buildings and vegetations classes.
buildings, however, are scattered north and south of Jeddah and the most concentration of buildings is in the center of the city where the patterns of planning are consistent, in contrast to the eastern and south-eastern areas. The nature of the eastern rocky mountain area has affected the pattern of accelerated planning and construction particularly in the areas of water basins, behind and in front of dams, water barriers and waterways. The alarm system was placed to warn residents of the areas adjacent to the dam when the dam rainwater reaches a certain extent (See Figure 16 and Figure 17).
Figure 18 shows the distribution of streets according to the classification of satellite data. They extend longitudinally from south to north and also to the southeast towards Mecca according to the urban expansion of the city. Roads were, however, absent in some areas due to the absence of buildings, or to changing their designation from urban to non-urban areas. It was noticed, also, that the irregular forms of roads were more common in the Old City and some of the surrounding neighbourhoods and slums in Jeddah.
6. Conclusions
This study shows the differences between the results of several types of classifications of satellite data: the Object-Based Classification and the Pixel-Based Classification with its two types, the Simultaneous and the individual. The images were obtained using GeoEye-1 satellite data at a resolution of 50 cm. First, the results show that the Pixel-Based classification is more accurate than the Object-Based classification. Out of the two types of Pixel-Based classifications, the Individual Classification of each class is more accurate in its application to the images of the city of Jeddah than the Simultaneous Classification. When used with the four classes of buildings, streets, vegetations and vacant land, the Individual Classification of each class proved more accurate than the Simultaneous Classification of all four classes. Visual and statistical assessments of classification result accuracy confirm these results. They prove that the results of the
![]()
Figure 16. Buildings close to water canals (right). A dam’s alarm system (left).
![]()
Figure 17. Water reservoirs, dam sites and drainage channels east of Jeddah.
Individual Classification (overall 89%) are higher than the Simultaneous Classification (75%) before enhancement and were further improved after enhancement (91% compared to 84%).
Therefore, the Individual Classification was found to be the most accurate for urban maps as they render the characteristics of the street, building and vegetation
classes more precise, and thus, can apply to the satellite data of urban areas similar to the city of Jeddah.
As this study limited to arid areas and mainly focusing on Jeddah city, therefore, we recommended further study to be conducted on wet areas so broad result can be achieved.
Acknowledgements
This project was funded by the Deanship of Scientific Research (DSR) at King Abdulaziz University, Jeddah, Kingdom of Saudi Arabia, under grant No. 1434-125-541. The authors, therefore, acknowledge with thanks DSR for technical and financial support. Dr. Abdlhamed Jamil Principal Investigator.