Effectiveness of Grassed Buffer in Reducing Spinosad Runoff: Real Data and FOCUS Output ()
1. Introduction
Pesticides runoff to surface water poses a risk to the aquatic environment, and recent studies show that pesticides from agricultural land use are a major threat to small streams and their biodiversity [1] [2].
Compared with several other land uses, vines often create favourable conditions for water runoff and sediment loss, mainly because vines are planted in the direction of slope and cultivation practices increase soil compaction [3]. Inter-row management is also important, the highest runoff rates and soil losses are observed for chemically weeded vineyards, while grassing might be the best option for runoff reduction [4].
Spinosad (Dow Agrosciences, Indianpolis, IN) is a naturally derived insecticide containing a mixture of two structurally similar molecules widely used in all the Southern Europe Registration Zone, to control pests on several crops including vineyards, also in organic farming.
According to EPA Toxicity categories, Spinosad is classified “slightly to moderately toxic” to fish, most aquatic invertebrates and algae [5]. In Europe Spinosad is classified as “Very toxic to aquatic organisms, may cause long-term adverse effects in the aquatic environment” and requires ecosystem protection. Additional labelling with risk phrases and safety phrases is affixed, particularly to enforce prevention of any entry into surface waters; furthermore the KOW values ranging from 2.78 to 5.21 (depending to pH) indicate that bioaccumulation or accumulation in sediment can occur [6]. For use in vineyards in Italy the label of the most recent formulation (Tracer 120 SC, released 30 January 2019) indicates the requirement of a no-spray zone of 15 m to protect water courses. Protection from drift can involve both no-spray zone and drift reduction techniques, while protection from runoff can take advantage of soil incorporation, treatment localization and a properly managed vegetated filter strip (hereafter: VFS).
Various recent studies show that VFS are in general effective for runoff reduction and can be suggested as a mitigation measure [7] [8]. Studies on soil erosion [9] showed that to be effective the grass cover must be dense.
In Italy high-quality vines are grown on hilly fields, where spinosad runoff to surface water is possible. However, no experimental data are available on spinosad displacement in VFS on sloping fields.
Results from field trials are few since they are difficult and very time and labour consuming, so the main evaluation of runoff magnitude and reduction provided by VFS derives from model outcomes [10]. FOCUS Landscape and Mitigation v2 (hereafter: FOCUS L & M) allows VFS as a mitigation measure against the risk of pesticides runoff to surface water, and provides values of pesticide removal efficiency [11] [12].
The current mitigation approach of FOCUS L&M is based on static reduction factors related to buffer width. Recent models have been developed to estimate VFS trapping efficiency dynamically after single runoff events, and to identify the importance of factors for the prediction of runoff, pesticide reduction, the VFS hydraulic properties being the most important [13].
Mitigation capacity of a VFS depends on width, slope, grass and litter cover [8]. Models account for complete grass cover, laminar flux and lack of preferential flow.
A recent study performed in Germany [14] showed that efficacy calculated by models is 35% - 40% higher than that obtained in real, not perfect, conditions.
Field trials are indeed of great importance, 1) to enlarge the database on which the model can rely, 2) because they can improve model parametrisation to take into account grass cover conditions, and 3) provide hard evidence for Authorities for pesticide use regulation based on real VFS efficiency, for example in hilly areas rich in water courses.
Furthermore, a recent Document from the Italian Ministry of Health [15] allows VFS as a mitigation measure for runoff to surface water, but for sloping fields considers reduced mitigation efficiency, i.e. with a >5% slope the efficiency is 30% of that for plain fields. The Document is regularly under revision in the light of new and hard evidence, such as results from field trials. Publication of an updated revision is expected in March 2020.
It is worth noting that for regulatory purpose, National Authorities evaluate mainly, or only, studies performed according to accepted procedures, such as those from Good Laboratory Practices, the results of which are officially validated after a formal audit by the competent Ministry. The important extra-cost of this approach makes runoff field studies “GLP compliance” very rare or completely lacking, as in Italy.
The aim of this field study was to evaluate in a real vineyard-buffer system the capacity of a grassed buffer to reduce runoff concentration of spinosad. Runoff conditions were based on FOCUS R2 and R3 scenarios, but with a steeper slope to draw more prudent conclusions. More specifically, the aim was to evaluate mitigation capacity of a grassed buffer, both on spinosad concentration and runoff displacement, and provide recommendation for regulatory purposes.
2. Material and Methods
2.1. Experimental Site
The trial site was near Verona, in a hilly area with many vineyards and famous for high-quality wine production (45.39N, 10.77E). The site was selected as it was highly representative of vineyards on sloping fields in the Mediterranean EPPO zone, and similar to the FOCUS R2 and R3 scenarios. The site was a sloping area permanently grassed for 10 years, surrounded by vineyards. It was not subject to extensive grazing by livestock as the grass was typically cut twice a year for hay. The soil type on site was sandy loam or sandy-clay loam according to the Soil Texture Calculator (www.nrcs.usda.gov, based on [16]) (Supplementary data, TableS1).
The site texture was similar to the mean texture of R2 and R3, and the critical hydraulic properties of field capacity very close to those of R2 and R3 (Supplementary data, TableS2).
2.1.1. Plot Layout
In the middle of the grassed area, 5 plots of 50 m2 (4.17 m wide * 12 m length) were selected. Slope was measured with a laser level, and ranged from 10.6% to 13.2% (Supplementary data, TableS3). This slope is at least double that considered in FOCUS R2 and R3 scenarios, where it is set at 5%.
Grass cover was assessed visually, and ranged from 75% to 90%. Vegetation cover and species spectrum was uniform across plots (Supplementary data, TableS4).
From May to September 2017 the grassed area was managed to allow a runoff flow free of obstacles according to the creation of a worst-case scenario. Grass cutting was regular every 8 days to avoid formation of thatch or a residue layer, to stabilize grass cover density and avoid runoff preferential flow. With this high frequency, cuttings were of about 1 cm and their removal was not needed as they quickly dried out in summer. The last cut was done 7 days before the first runoff application and vegetation height was about 5 cm in all 5 plots.
2.1.2. Source-To-Buffer Ratio
The trial accounts for a source-to-buffer ratio of 10 to 1, as if the runoff generates in an area of 500 m2 (5 m wide * 120 m length, source) flowing into the plot of 50 m2 (4.17 m wide * 12 m length, buffer).
For this, 20 mm of rainfall and runoff generated in the source correspond to a runoff flow of 10,000 L in the buffer. This volume of runoff water was applied to the plot using a custom runoff applicator at the upslope edge of each plot over a 2.25 hours period, following completion of the initial irrigation phase.
The contributing area (source) was broadly representative of typical field size in the area, as determined by the following expert judgement. In Veneto and other Regions in Northern Italy, the most frequent cropping unit for vineyards is about 3500 m2. On sloping fields, to ease operations, vine rows are usually planted about 3 m apart according to the iso-level lines. A common crop unit includes at least 10 rows, so it has a short side of 30 m and a front side of 110 m. The front side is usually used as tractor path and is 3 - 4 m wide, accounting for an area of 350 m2. In this scenario a cropped area of 3500 m2 (source) has a non-cropped edge of 350 m2 (buffer). What makes this scenario worst is the hypothesis that runoff generated inside the source doesn’t infiltrate between rows but flows entirely to the buffer, accounting for a source-to-buffer ratio of 10 to 1.
2.2. Chemicals and Analytical Procedure
Spinosad is an insecticide widely used in Italy for many crops, included orchards and vineyards. It consists of two active ingredients (spinosyn A and spinosyn D) and two primary N-demethylated metabolites (spinosyn B and N-demethyl spinosyn D, also referred to as spinosyn B of D). Hereafter those 4 compounds are named “spinosyns” and coded as “Sp. A, Sp. D, Sp. B, Sp. BoD”.
The 4 spinosyns were provided by Dow AgroSciences (Indianapolis, IN, USA), the KBr by Merck KGaA. The acetonitrile organic solvent (CAS N. 75-05-8) was supplied by Vetrotecnica Srl (Padova, Italy). Analysis was done by CEM Analytical Services Ltd (CEMAS-Wokingham Berkshire, UK). Spinosyns were analysed by LC-MS/MS, KBr by IC-CD (chemicals identification and analytical procedure are in Supplementary data, Text S4).
2.3. Mechanics of the Experiment and System Set-Up
The 4 spinosyns were dissolved in the laboratory then released into tanks filled with pure water, the run-on reservoir. Input concentration was 2.0 μg/L. After 0.5 hours mixing and recirculation, the solution was conveyed to the custom runoff applicator 5 m away. From here the solution was continuously released into the plot for 2.25 hours, and sampled at 0.75 - 1.5 - 2.25 hours after runoff start. Mixing and recirculation in the run-on reservoir continued until the end of runoff sampling (Supplementary data, FigureS1).
Irrigation was applied throughout the experiment. Detection of the tracer KBr guarantees proper sampling (water from runoff, not from irrigation only), and expected concentrations of spinosyns in runoff must be lower than input.
Before the first application with the spinosyns, 8 preliminary tests were done using pure water from June to September in order to fine-tune the system mechanics, i.e. timing of irrigation and sampling, engine settings, sprinkler position and height. Results show that runoff displacement was of variable length but did not breach the 12 m length buffer in any preliminary test, the final length of plots and sampling timing were then set accordingly.
2.4. Artificial Runoff Application
2.4.1. Selection of Rainfall Event
Analysis of FOCUS scenarios indicated that the R4 scenario would be the realistic worst-case scenario to be applied in the field trial. Representative rainfall, associated runoff volume and target spinosyns concentrations are similarly derived, and rainfall/runoff duration determined using long-term climate data obtained for the Mediterranean area.
Particularly, the return periods for daily rainfall events are calculated from long-term climate data obtained for the R4 scenario (weather station in Roujan, France) since both the Roujan and Verona areas belong to the same R4 scenario, rainfall erosivity for both areas is the same [17], and outcomes are consistent with results from recent studies conducted in Northern Italy [18]. Given the selected parameters, conditions of the experiment can be considered highly precautionary.
The runoff in R4 scenario is generated by a rainfall event of 45 mm in 1 day. According to FOCUS (daily data), this type of event is quite frequent and has a return period of about 0.34 years (4.1 months).
2.4.2. Timing
A rainfall of 45 mm is supposed in the area. According to selected scenario, a fraction of about 45% of the rainfall, corresponding to 20 mm, does not infiltrate and becomes runoff. A source of 500 m2 generates about 10,000 L (i.e. 20 mm), and this volume is entirely delivered into a plot of 50 m2 in about 2 hours.
The runoff event consisted of 2 phases:
1) Irrigation pre run-on/runoff with sprinkler at 14.5 mm/h for 0.83 hours (0 h: 50 min), for a total of 12 mm applied, to simulate rainfall before runoff;
2) Run-on/runoff event: 200 mm of water was released into a plot (the buffer area) in 2.25 hours (2 h: 15 min) using a custom runoff applicator (flow of 89 mm/h).
Run-on water contained a precise amount of the 4 spinosyns and a tracer (KBr). The tracer was added to run-on water to ensure that samples of runoff water were not generated by irrigation only.
(Details on spinosyns application are in Supplementary data, text S4).
Once released into the buffer area, the “run-on” solution in the reservoir becomes “runoff”, and runoff water was sampled at 0.75 hours (0 h: 45 min), 1.5 hours (1 h: 30 min) and 2.25 hours (2 h: 15 min) after run-on start.
During run-on, irrigation continued until the end of run-on (other 33 mm), and a total of 45 mm was applied to the buffer area in 3.08 hours (3 h: 05 min) (mean intensity: 14.6 mm/h) (Supplementary data, FigureS2).
One artificial runoff application was made to each plot, and the five applications were performed from 12 to 29 September 2017 when the plot vegetation was well developed and the cover uniform. Each application was concluded on the same day, in 3.08 hours (Supplementary data, TableS5).
2.4.3. The Custom Runoff Applicator
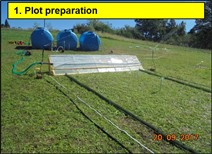
To achieve an even application of run-on water, a custom runoff applicator was built (Figure 1). This consisted of a wooden frame that spanned the width of the plot (i.e. 5 m), with plexiglass plates connected to the frame and touching the ground at an angle of c. 45˚. The artificial runoff was applied with an array of nozzles (ARAG micro-spray 180˚) directed on to the plexiglass plates to create laminar runoff flow from the custom runoff applicator down to the end of the plot.
Plots were separated by 3 - 4 m space, but to prevent lateral movement of runoff to an adjacent plot, the full length of the plot was bordered by overlapping stainless steel metal sheets inserted into the soil.
![]()
Figure 1. Custom runoff applicator in operation during artificial runoff. Sprinklers used for pre- and during runoff application are shown, together with the water for irrigation and item reservoir (blue tanks). The site is in a typical hilly vineyard landscape as around Verona and all over the Pre-Alps.
2.4.4. Summary of the Selected Trial Conditions
Trial conditions were based on FOCUS R4 scenario, but made worse:
1) High source-to-buffer area proportion (10 to 1);
2) High runoff/rainfall rate in the source area (20 mm runoff for 45 mm rain = 45%);
3) Heavy rainfall (245 mm in 3 hours, return period of 2 years);
4) Steep buffer slope (from 10% to 13%);
5) Low grass cover height (5 cm, without residues on soil).
Selected conditions can be considered highly favourable for runoff, allowing precautionary conclusions and recommendations.
2.5. Sampling
2.5.1. Run-On Sampling
For spinosyns and KBr grab samples of run-on water were collected at the application nozzles of the custom runoff applicator, at 0.75 hours and 2.25 hours after run-on start, i.e. at the start and end of the runoff sampling. Results for KBr are in Table 1, for spinosyns in Table 2.
2.5.2. Runoff Sampling
Runoff samples were taken:
1) For KBr at 2.25 hours from runoff start (results in Table 1);
2) For spinosyns at 0.75 - 1.5 - 2.25 hours from runoff start (results in Table 2).
![]()
Table 1. KBr concentration (g/L) in run-on and runoff. Samples taken at custom runoff applicator at 0.75 hours (Start) and 2.25 hours (End) after run-on start.
![]()
Table 2. Spinosyns concentration (μg/L) in run-on. Samples taken at custom runoff applicator at 0.75 hours and 2.25 hours after run-on start.
(Sp. A: Spinosyn A; Sp. D: Spinosyn D; Sp. B: Spinosyn B; Sp. BoD: Spinosyn B of D). Concentrations higher than input are in bold.
The sample at 2.25 hours was that at the furthest point reached by runoff down the grassed buffer. Each sample was taken directly from the ground using an amber glass jar. Plastic marker sticks were used to indicate runoff displacement (Supplementary data, FigureS3). Samples were processed, frozen and shipped (Supplementary data, TableS6).
2.6. Data Analysis
It is expected that concentration of spinosyns decreases as water flows from the custom runoff applicator to the end of the plot 12 m downslope because of adsorption to the plant-soil system [19] [20]. The reference concentration is run-on concentration at the custom runoff applicator (average of the 2 values) and the concentration reduction is called “mitigation”. For example, for Sp. A in Plot 1, run-on concentrations were 1.579 μg/L and 0.937 μg/L; the mean value (1.258 μg/L) is the reference value for the calculation of mitigation in runoff samples.
In Plot 1, the first runoff sample collected 5.6 m downslope contained a concentration of 0.477 μg/L, so the reduction (mitigation) was: M% = 100 * (1.258 − 0.477)/1.258 = 62%.
This means that in 5.6 m displacement concentration of Sp. A in runoff decreased by 62%.
Reduction was calculated for each of the 3 runoff samples collected in each plot (Table 3).
2.7. Meteorological Parameters and Soil Moisture
Standard meteorological parameters were recorded for each plot during runoff events. In brief, runoff events occurred on warm days (17˚C - 29˚C), without wind. The soil moisture was measured with the EC5 Soil moisture sensorTM (Decagon devices Inc., Pullman, WA) 3 times: 1) before trial start (pre-storm); 2) at run-on start (i.e. at end of pre-runoff irrigation); 3) at end of trial (Supplementary data, TableS7).
2.8. FOCUS Modeling
A comparison was made between experimental results and runoff reductions
![]()
Table 3. Runoff displacement, spinosyns concentration in runoff and Run-on/Runoff concentration reduction (mitigation).
(Sp. A: Spinosyn A; Sp. D: Spinosyn D; Sp. B: Spinosyn B; Sp. BoD: Spinosyn B of D). Reduction values in bold are negative.
performed by the models used for calculations of Predicted Environmental Concentrations of pesticides in surface water (PECSW).
Several simulations were done with the tools provided by the FOCUS guidelines. The FOCUS SWASH (v. 5.3) cell was used for Step3 calculations, and the SWAN (v. 5.0.0) tool was used for Step4 calculations. Runoff mitigation in FOCUS modelling can be considered in two ways. The first is by manually entering in SWAN the values for runoff reduction parameters reported in the FOCUS Guidance on Landscape and Mitigation (SANCO/10422/2005, v. 2.0, Sept. 2007), while the second way is by selecting the buffer width in SWAN and using the VFSMod.
VFSMod is a computer simulation model created to study hydrology, sediment and pollutant transport through vegetative buffer strips.
Both these approaches depend on the buffer width, but they can provide very different results. During this study, a comparison was made between the two approaches and the experimental results, in order to analyze the reliability of the modelling methods and to define which one is more suitable for PECSW calculation.
The FOCUS crop “Grass/alfalfa” was selected to reproduce the experimental conditions. R2 and R3 scenarios were selected, because FOCUS models do not associate “Grass/alfalfa” crop with the R4 scenario.
Four different time-steps (application date in January (T1), April (T2), June (T3) and September (T4)) were considered, in order to take into account the meteorological variability of the calculations. Spynosin A, Spinosyn B and Spinosyn D were considered; the input parameters reported in the models were taken from the DAR of spinosad.
The FOCUS Guidance on Landscape and Mitigation (LM) provides runoff reduction values for three different buffer widths: 5 m, 10 m and 20 m. The 5 m and 10 m widths were chosen, because they are similar to the experimental conditions. One granular application of 1 kg/ha each year was simulated, and drift reduction was suppressed in the SWAN tool in order to consider only runoff reduction.
3. Results and Discussion
3.1. Irrigation Efficiency
Soil moisture increased regularly as irrigation proceeded: before trial start it was 18% - 30% (%v/v), after pre-runoff irrigation, i.e. at field capacity, it was 37% - 43%, at end of runoff final moisture was at least 40% for the five plots. Irrigation system and application timing was 100% efficient (Supplementary data, FigureS4). Field capacity was very close to that considered in R2 and R3 scenarios (36% - 37%).
3.2. KBr and Spinosyns Release and Sampling Precision
Detection of KBr and spinosyns in all samples were always positive. This showed that release with run-on and sampling procedure of runoff were 100% effective (119 positive over 119 possible detections) (Supplementary data, TableS8).
3.3. KBr Concentration in Run-On
KBr was detected in all samples, with a concentration of 0.281 ± 0.009 (CV = 3%) g/L, very regular and lower than input concentration (0.5 g/L) (Table 1).
3.4. Spinosyns Concentration in Run-On
The 4 spinosyns were detected in all samples, with a concentration of 1.397 ± 0.379 (CV = 27%) μg/L, regularly lower than input concentration (2.0 μg/L) except in two cases (Table 2). These results show that dissolution and release of spinosyns by custom runoff applicator were 100% effective (Supplementary data, FigureS5).
3.5. KBr Concentration in Runoff
KBr was detected in all samples, with a concentration of 0.208 ± 0.030 (CV = 14%) g/L, very regular and lower than run-on concentration (Table 1).
3.6. Spinosyns Concentration in Runoff
The 4 spinosyns were detected in all samples (60 values), with a concentration of 0.541 ± 0.369 (CV = 68%) μg/L, regularly lower than run-on concentration except in 3 cases (Table 3).
Taking into account the 57 positive values, mitigation provided by the grassed buffer was 65 ± 21 (CV = 33%) percent, and the maximum mitigation value was 96%.
Taking into account the entire set of 60 mitigations, included the 3 negatives, Upper Confidence Limit for mean (UCL) 95% is 67%, this means that in 95% of possible events concentration of runoff was reduced by 67%.
3.7. Runoff Displacement
In the 5 plots, runoff displacement ranged from 3.7 to 11.6 m (7.4 ± 2.5 (CV = 34%)). Inter-plot variability was observed, i.e. in Plot 2 the range was 8.7 - 11.6 m, in Plot 5 was 3.7 - 5.3 m. This variability of displacement is acceptable since runoff in field trials is usually very variable even in very small plots. For example, in an experiment with plots of 0.25 m2, [9] found for soil erosion a runoff coefficient variable from 0.4% to 77%.
According to the aim of the study to explore worst-case conditions, the focus was on maximum displacement in each plot: this ranged from 5.3 to 11.6 m (8.8 ± 2.7 (CV = 31%)).
UCL95% is 12 m, this means that in 95% of possible events, the entire runoff flow remains inside a 12 m grassed buffer. UCL99% is 14 m.
3.8. Effect of Buffer Width on Mitigation
For the evaluation of the distance-to-mitigation effect no generally accepted method is available, particularly when displacements are of variable length.
In this study a method based on mean concentrations in two selected displacement ranges was used. Limits were based on quartile range of 15 runoff displacements observed: 25th = 5.3 m, 75th = 9.8 m. To separate an equal number of lower and higher displacements, quartile range was rounded to 5.2 m and 10.0 m. According to this procedure, results show that a grassed buffer of 6.7 m provides a concentration mitigation of 44.8% (Figure 2) (Supplementary data, TableS9).
3.9. Field Data and FOCUS Output Comparison
Considering a 5 m VFS, with LM model the runoff mass reduction was 50.2% ± 1.3%, with a related PECSW reduction of 44.8% ± 0.5%. Results from this model were of low variability and not affected by the scenario or application period.
With VFSMod model higher reduction values were obtained, with a runoff mass reduction of 91.4% ± 12.7%, and a related PECSW reduction of 92.6% ± 11.6%. These values are very different for R2 and R3 scenarios (runoff mass reduction was 100% ± 0.0% for R2 and 82.7% ± 13.1% for R3), showing that the model output was significantly affected by the properties of the scenarios. Application period also had an influence on mean runoff mass reduction, which was 95.7%, 98.6%, 91.7%, 84.5% for T1, T2, T3, T4. Results for this model were of quite high variability, mainly affected by the meteorological and pedological conditions of scenarios, while effect of application periods was minor.
Considering 10 m VFS runoff reduction was higher for both models. With LM the runoff mass reduction was 95.6% ± 8.3%, with a related PECSW reduction of 60.2% ± 1.0%. With VFSMod the runoff mass reduction was 95.6% ± 8.3%, with a related PECSW reduction of 96.3% ± 6.9%.
![]()
Figure 2. Effect of runoff displacement on spinosyns concentration. The 60 concentrations values in runoff are plotted against displacement length. For each displacement there are four values, one for each spinosyn (Sp. A, Sp. D, Sp. B, Sp. BoD). The red square A is the mean displacement for distances ≤ 5.2 m (4.5 m), and the corresponding mean concentration (0.617 μg/L). The blue square B is the mean displacement for distances ≥ 10.0 m (11.1 m), and the corresponding mean concentration (0.340 μg/L). Distance between A and B is (11.1 − 4.5) = 6.6 m. According to the method suggested, mitigation from A to B is: M% = 100 * (0.617 − 0.340)/0.617 = 44.8%.
Detailed results are reported in Supplementary data (Tables S10-S12).
Comparison of field trial results with models outputs for a 10 m grassed buffer show that VFSMod provides a very accurate estimation of what was observed in the field: in the field runoff mass reduction was 100% (12 m VFS), for VFSMos it was 90% - 100% (10 m VFS), the second value is for R2 scenario, with soil texture more similar to the field. Instead, LM model underestimates the runoff reduction provided by the buffer strip (runoff mass reduction for LM was 60%).
Comparison of models outputs for a 5 m grassed buffer with field trial results is not possible since runoff volume was not measured after 5 m displacement. Yet, visual assessment of runoff flow suggested that most of the runoff volume was retained in the first 5 - 6 m buffer, so it can be concluded that for a 5 m grassed buffer the VFSMod model (runoff reduction was 82% - 100%) slightly overestimates field observations, while LM model (runoff reduction of 50%) is in very good agreement.
From a scientific point of view therefore, both VFSMod and LM models seem to describe the behaviour of the vegetated buffer strip with some imprecisions, and are thus not totally reliable.
From a regulatory point of view, the dependence of VFSMod on pedological and meteorological properties of FOCUS scenarios can be considered a disadvantage. Since the reproducibility and reliability of the results of evaluations are the main goals in regulatory processes, LM should be preferred.
When models results are compared with field results, a general conclusion is that both models provide acceptable estimation for runoff reduction for a 5 m grassed buffer, where LM seems more precise. For a 10 m grassed buffer the VFSMod is very accurate, while LM underestimates the reduction.
In any case, the procedure for artificial runoff used in this field trial proved to be adequate to evaluate or improve models parametrisation; furthermore, the low variability of results support the use of this field method for chemicals and scenarios comparison, and to provide evidence for regulatory purposes.
4. Conclusions
1) A reliable run-on and runoff method is available for runoff experiments with pesticides for scientific and regulatory purposes. The study was acknowledged for its “GLP compliance” by the Italian Ministry of Health [21]. In order to ease replication of the experiment, a complete set of information is provided in the Supplementary data.
2) A grassed buffer of 12 m can completely retain runoff even with a 10% - 13% slope and under heavy rainfall conditions, and effectively mitigate concentration of spinosad in runoff, providing a reduction of up to 96%. This is consistent with the quite high lipophilicity of this insecticide.
3) An effect of grassed buffer length on mitigation exists. Using rounded values, a 6.5 m grassed buffer can mitigate spinosad concentration by about 50%. According to the iterative method suggested by the Italian Ministry of Health [15], a total length of 13 m provides a total mitigation of 75%. A further length increase (i.e. to 19.5 m) is not needed since the Confidence Limit 99.0% for runoff displacement is 14 m, i.e. events above 14 m displacement are very unlikely.
4) Comparison with the FOCUS outcome shows that both VFSMod and LM models provide acceptable estimation of runoff reduction for a 5 m grassed buffer, where LM seems more precise. For a 10 m grassed buffer, the VFSMod is very accurate, while LM underestimates reduction.
It is important to note that conditions of the grassed buffer in this study were very good, so the observed runoff reduction can be considered as the highest possible. The outcome from FOCUS modelling underestimates this runoff reduction, and calculated values can be considered as for a grassed area with standard management and average conditions, but the likely grassed buffer potential can be further exploited.
It is known that VFS are dynamic systems, their performance does not remain constant over the years indicating the need to define suitable buffer management [8], and data from this study demonstrate the high potential of a well-maintained grassed buffer. Conditions of the grassed buffer are important, their implementation in models in the section “Runoff & soil loss properties” is of great interest, i.e. by the introduction of a grass cover (%) parameter.
5) Since the reproducibility and reliability of the results of evaluations are the main goals in regulatory processes, LM model should be preferred because it is more reliable and not affected by scenario properties.
6) General conclusion and Recommendation: A grassed buffer of 12 m can very effectively mitigate spinosad runoff, even with a slope of 10% - 13% and under severe rainfall and runoff conditions, expected mean concentration reduction in the buffer is about 65% and expected mass flow reduction is 100%.
This width value of the grassed buffer is interesting since the latest formulation of spinosad requires ecosystem protection for drift and runoff. According to the latest approach for mitigation in Italy, the no-spray zone width for drift protection can be reduced when anti-drift technologies are used, and results of this study show that this reduction can reach 12 m even in steeply sloping fields since this also provides protection for runoff, making application of spinosad, and other similar pesticides, of low risk to aquatic ecosystems.
Field trials of pesticide runoff provide only case-studies of the very large parameter combinations that occur in the environment, but can be very useful to tune fine mechanistic modelling often used to supplement the limited number of field data.
Acknowledgements
Authors are grateful to Prof. Giuseppe Zanin for supporting this study and providing useful suggestions.
Funding
This work was supported by Dow AgroSciences (DAS, Zionsville, IN, USA), official Sponsor under GLP procedure (Study code n. SL0117). The Sponsor was involved in all phases of the research, from study design to article writing.
Supplementary Data, TableS1
![]()
Table S1. Soil texture of the experimental site.
*Samples taken at random near the plots across the site.
Supplementary Data, TableS2
![]()
![]()
Table S2. R2 and R3 scenario soil and site parameters for PRZM (from Generic Guidance for FOCUS surface water scenarios-Appendix D).
(a) Estimated value based on horizon type and value for horizon above. (b) Estimated value using SSLRC algorithms and measured local data for soil type. (c) Calculated using PRZM pedo-transfer functions with other data given in the table (FC = −33 kPa; WP = −1500 kPa). (d) Estimated using SSLRC pedo-transfer functions with other data given in the table and checked against data in the PRZM manual. (e) FAO, 1990; USDA, 1999. (f) FAO, 1990. (g) Subang. bl. = Subangular blocky.
Supplementary Data, TableS3
![]()
Table S3. Measured plots slope and grass cover at experimental site.
Supplementary Data, TableS4
![]()
Table S4. Species and vegetation cover at experimental site in summer.
*Visual assessment of species coverage: ++++ Very abundant (cover 5% - 10%); +++ Abundant (cover 2% - 5%); ++ Low abundance (cover 1% - 2%); + Very low abundance (cover about 1%).
Supplementary Data, TableS5
![]()
Table S5. Phases and timing of artificial runoff event application.
Supplementary Data, TableS6
Chemicals application
In the laboratory, 0.020 g of each of the 4 spinosyns was weighed into a single 500 ml amber glass jar and dissolved in approximately 150 ml of acetonitrile organic solvent solution and shaken until fully mixed. Preparation of items showed some differences in the dissolution, spinosyn B of D being the less soluble. The solution of the 4 spinosyns and acetonitrile was therefore subsequently mixed with a laboratory magnetic stirrer for 4 - 5 minutes. This was then topped up with tap water to a final volume of approximately 500 ml and shaken again. This was taken to the trial site on the same day in a secure, lockable transport box. Prior to adding the test item mixture to the 10,000 L of run-on water reservoir, the jar was shaken again to ensure the spinosyns had completely dissolved, after which it was added to the 10,000 L of water previously metered into the plastic bowser tank to give the required concentration for each of the 4 spinosyns in the run-on water of 2.0 μg/L.
Runoff samples processing
The 120 ml KBr water samples were transferred into a 250 ml amber glass jar. The 40 ml spinosyns water sample was transferred into a 150 ml amber glass jar, mixed with 40 ml of acetonitrile organic solvent solution, and then shaken until fully mixed. The jars were closed with PTFE lined screw caps.
Once collected, the water samples were immediately stored in a cool box then stored at −18˚C. Shipment to the analytical laboratory (CEMAS) was by freezer truck.
Analytical procedure.
Analysis was done by CEM Analytical Services Ltd (CEMAS-Wokingham Berkshire, UK) in compliance with GLP as defined by the OECD Principle of Good Laboratory Practice (ENV/MC/CHEM/(98) 17 and UK S.I.1999/3106 as amended by S.I.994/2004.
Spinosyns were analysed by LC-MS/MS according to the procedure described in Dow AgroSciences Study ID 140934. Limit of quantification (LOQ) was 0.010 μg/L and Limit of detection (LOD) was 0.003 μg/L. Fortifications in water samples were done at 0.010 - 0.100 - 1.000 - 5.000 μg/L.
In runoff samples, mean recoveries for the 4 spinosyns were between 86 and 97%:
Sp. A: 92 ± 9.8; Sp. D: 86 ± 13.3; Sp. B: 95 ± 16; Sp. BoD: 97 ± 3.3 (mean ± standard deviation, all values in percentages).
As the 4 spinosyns are unstable in water, runoff samples collected in field were diluted 1:1 (v/v) with acetonitrile.
Samples were allowed to thaw and reach room temperature.
Residues of the 4 spinosyns were extracted from a specimen with a volume of 20 mL (10 mL runoff + 10 mL acetonitrile) by shaking with sodium chloride and methyl tertiary-buthyl ether (MTBE). After the addition of a keeper the MTBE was evaporated to near dryness. The specimen was then reconstituted in a water/acetonitrile/methanol (50/25/25 v/v/v) solution containing 5 mM ammonium acetate. The final specimen was analysed for the 4 spinosyns by liquid chromatography with positive-ion electrospray ionisation mass spectrometry (LC-MS/MS). The specimens were analysed in batches, each batch containing at least one control specimen, six procedural recovery specimens and a reagent blank. Results were quantified using a 1/x weighted calibration.
Bromide ion was analysed by IC-CD. Limit of quantification (LOQ) of 10 mg/L.
Fortification in water samples were done at 10 - 100 - 500 mg/L.
In runoff samples, recovery for bromide ion was 92 ± 3.3 (mean ± standard deviation, all values in percentages).
Samples were allowed to thaw and reach room temperature. An aliquot of 1.5 mL of field sample was filtered and transferred to an auto-sampler vial for analysis. Residue determination was by ion chromatography with conductivity detection (IC-CD). Conductivity was measured in micro Siemens (μS). The specimens were analysed in batches, each batch containing at least one control specimen, three procedural recovery specimens and a reagent blank. Results were quantified using a 1/x weighted calibration.
Supplementary Data, FigureS1
![]()
![]()
Figure S1. Scheme of the experiment. 1) The blue tanks are the reservoir of run-on; 2) Runoff and irrigation are applied; 3) Runoff sampling from runoff custom applicator to the maximum extent of runoff displacement.
Supplementary Data, FigureS2
![]()
Figure S2. Irrigation system in operation during trials.
Supplementary Data, FigureS3
![]()
Figure S3. Sampling of inter-plot runoff for spinosad and KBr analysis.
Supplementary Data, TableS7
![]()
Table S7. Meteorological parameters and soil moisture for each application.
aValues soon before start of irrigation (0.00 hours, Pre-storm), at run-on start (0.83 hours) and at end of run-on/runoff (3.08 hours). bSoil moisture increase is the difference between moisture before start and at end.
Supplementary Data, FigureS4
![]()
Figure S4. Soil moisture in the 5 plots during runoff event. Values measured soon before trial start (0.00 hours, Pre-storm, PRE), at run-on start (0.83 hours, MID), at end of runoff (3.08 hours, END).
Supplementary Data, TableS8
![]()
Table S8. Summary of samples and detection in run-on and runoff water.
*Efficiency (%) = 100 * (Positive detection/Possible detection).
Supplementary Data, FigureS5
![]()
Figure S5. Spinosyns concentration in run-on samples. The dotted line is the input concentration of 2.0 μg/L. Data enter the graph in this order: Plot 1 Start-Sp. A, Sp. D, Sp. B, Sp. BofD; Plot 1 End-Sp. A, Sp. D, Sp. B, Sp. BofD; … Plot 5 End-Sp. A, Sp. D, Sp. B, Sp. BofD. Only in two cases concentration was higher than input.
Supplementary Data, TableS9
![]()
Table S9. Selection of runoff displacement range for calculation of the effect of length on spinosyns concentration reduction.
![]()
![]()
Table S10. FOCUS modelling, detailed results for 5 m vegetated buffer.
Supplementary Data, TableS11
![]()
![]()
Table S11. FOCUS modelling, detailed results for 10 m vegetated buffer.
Supplementary Data, TableS12
![]()
Table S12. Summary of modelling results for VFSMod.