Adsorption Performance of Modified Sponge Gourd for Crude Oil Removal ()
1. Introduction
The modern industrial society depends on crude oil for its energy and as a starting material for the manufacturing of various chemicals and the synthesis of polymers [1]. The world’s daily requirement of crude oil is on the increase with a projected estimate of 118 million barrels by the year 2030 [2]. The technology involved in the exploration, refining and transportation of crude oil poses the danger of spilling into the environment [3] [4]. About 5 million tons of crude oil are taking across the oceans on a yearly basis [5].
The imperfection in human activities together with deliberate acts of vandalism and natural disaster normally result in environmental pollution caused by oil spillage [2] [6] [7], thus, causing a serious global concern due to the effects on aquatic life, humans, soil and air [4] [8]. The release of oil to water bodies renders it unavailable for both domestic and industrial uses and may bring about the destruction of aquatic life and damage to human health [9] [10].
Therefore, the need arises for finding an effective method of cleaning up spilled areas. Several methods have been employed for cleaning up contaminated sites. Techniques such as application of dispersant to oil slicks [11], the use of solidifiers [12], gravity or centrifugal separation [13], employment of containment boom or skimmers [14], burning of crude oil from the water surface and the use of sorption process [14], biodegradation approach [2] [15] have been engaged to this end.
Sorption process is an effective method of treating oil spillage. The method involves the use of various synthetic sorbents materials like polypropylene, polyethylene, polyurethane foams, and natural or lignocellulosic sorbents materials like palm oil leaves, sponge gourd fibre, kenaf, cotton, istle, kapok, hemp, wood, rice straw, corn cob, corn straw, sugar cane bagasse to preferentially sorb crude-oil from the oil-water mixture [14] [16].
However, factors such as high cost, non-renewability, non-biodegradability and concerns over the use of resources from petroleum sources and the need to reduce the dependence on crude oil derived products have necessitated the diversion of attention from synthetic sorbents [17]. Natural sorbents or vegetable fibres enjoy worldwide availability and abundance. Saini, Saini and Tewari [18], reported that the amount of wheat, corn, rice straw and sugar cane bagasse produced yearly was evaluated to be 1.4 billion tons, globally. About 224 million tons of biomass residue from agriculture is available yearly for byproduct applications in the US alone [19]. The amount of biomass residue produced yearly from oil-palm industry was evaluated to be around 30 million tons [6].
In addition to the abundance, natural sorbents bring about cleaner environment due to their biodegradable potential, and their low cost encourages using them in oil-spill treatments. There density is close to or even lower than that of synthetic materials, thus, offering a promising substitute. [16] [17] [20]. In the review of Adebajo et al. [21], various sorbent materials were examined for oil spill clean-up, natural sorbents were reported to offer a higher prospect for application in oil spill treatment.
Although, natural sorbents are highly abundant, there is still a need to further investigate those that may possess high sorption capacity for crude oil (typically; Nigeria crude oil) [6]. Therefore, this current study investigated the crude oil adsorption potential of modified sponge gourd fibre (Luffa cylindrica) for oil spill clean-up. Sponge gourd has not really been applied for oil spill treatment. A previous study on the application of sponge gourd for oil spill treatment employed the use in the raw form, consequently, a low adsorption capacity was reported as compared with silk-floss, sisal, sawdust and coir fiber [20]. A projection is thus inferred that by modifying the fibre structure through pretreatment, this will lead to modification in the fiber surface structure as well as to alteration in the surface energy, and possibly, an improvement in the adsorption ability for crude oil would be obtained [16] [19].
The major structural compositions of natural fibers are cellulose, hemicelluloses, lignin, pectin and waxy substances [22]. Sponge gourd fiber has been reported to compose of 63.0% ± 2.5% cellulose, 20.88% ± 1.4% hemicellulose, 11.69% ± 1.2% lignin and ash of 0.4% ± 0.10% [23]. The availability of the OH functional group on the sponge gourd fibre surface [16] [24], suggests that the surface characterization of the fibre can be modified to enhance the adsorption potentials [6].
This study investigated the effects of different modification process of the surface of sponge gourd fibre on the adsorption potential of crude oil at varying experimental conditions of adsorbent weight and fibre particle size.
2. Materials and Methods
2.1. Materials
The sample was collected from freely growing plants of sponge gourd in Ilorin metropolis of Kwara State, Nigeria (Plate 1). The crude oil samples employed in this study were supplied from the Nigeria Petroleum Development Cooperation, Benin City, Edo State, Nigeria. No modification was done to the crude oil sample. The crude oil-water sample used for this experiment was simulated using different concentration of the crude oil.
2.2. Preparation of Adsorbent
The sponge gourd fibres were harvested and sun dried. The sample was then peeled to remove the outer part and the seeds. They were washed repeatedly with clean water to leave out adhering substances and dirt. The clean samples were dried for 3 hours in a hot air oven at the temperature of 105˚C. The dried samples were grounded with a milling machine and graded with ASTM sieves of sizes between 0.85 - 4.75 mm in order to increase their surface area.
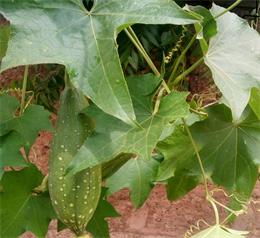
Plate 1. Growing plant of sponge gourd.
2.3. Determination of Physical Properties
The physical properties of the raw sponge gourd were determined. The moisture content (%), bulk density and the ash content (%) were determined using the methods of [25] [26] [27] and [28], respectively.
2.4. Pretreatment of the Adsorbent
The sponge gourd samples were taking through alkalization and hot water. Analytical grade of sodium hydroxide (Sigma Aldrich) was used for the alkaline treatment. A solution of 5% w/w of NaOH was prepared and 100 g of the clean grounded sponge gourd fiber was added to it. The mixture was agitated with a magnetic fitted stirrer for 30 min, and was then covered and left for 48 hours at room temperature. After the treatment period, the mixture was filtered, while the residue was washed repeatedly with distilled water to reach the pH of 7. The treated sample was then dried in a hot air oven at 105˚C for 2 hours.
To carry out the hot water treatment, 100 g of sponge gourd was measured, and it was mixed with 500 ml of distilled water. The sample was put on an electric hot plate fitted with magnetic stirrer and heated to a temperature of 105˚C. The mixture was left to boil for 4 h with continuous agitation provided by the magnetic stirrer. After the treatment period, the sample was withdrawn, cooled and filtered. The residue was then dried in a hot air oven at 105˚C for 2 hours.
2.5. Characterization of Sponge Gourd Fibre
The sample was characterized by determining the elemental composition, the functional groups present and the surface morphology of the sample.
2.5.1. Elemental Analysis of Sponge Gourd
The elemental composition of the raw sponge gourd was determined using a 1.7 MV tandem electrostatic ion accelerator (Model 5SDH Pelletron). The ion source used was hydrogen gas while nitrogen gas was used in the stripping section of the accelerator. The characteristics x-rays generated were captured using the PIXE detector. The spectral displayed were read and analyzed, and the elements presents were recorded.
2.5.2. Fourier Transform Infrared Analysis (FTIR)
The Fourier Transform Infrared (Schimadzu Corporation, Japan) was employed to identify the functional groups present in the sponge gourd fiber. The FTIR analysis was performed on the raw, alkaline and hot water treated samples before adsorption. After the adsorption process, FTIR was performed on the hot water and alkaline treated samples to ascertain the effect of adsorption on the sponge gourd. One hundred milligrams (100 mg) of high grade KBr (Sigma Aldrich) was dried in the oven at the temperature of 105˚C to eliminate or reduce water interference. The KBr was mixed with 1 mg of the sponge gourd fiber. The mixture was put in the FTIR spectrophotometer and the spectral was read and recorded in the range of 4000 to 400 cm−1.
2.5.3. Scanning Electron Microscopy (SEM)
The surface morphology of the raw (control), alkaline and hot water treated sample was examined. The samples were mounted on stubs with an adhesive carbon and coated in 20 nm gold with a Ceica gold coater, and then conditioned to field emission scanning electron microscopy using in-lens secondary electron detector (FESEM, Zeiss Sigma VP field emission scanning electron microscope equipped with an Oxford XMax 50 Silicon Drift energy dispersive X-ray detector at 3 kV under high vacuum).
2.6. Adsorption Experiments
In order to investigate the effects of pretreatment of sponge gourd on the adsorption ability, the experimental set up was divided into raw, alkaline and hot water treated samples.
The oil-water mixture was simulated by contaminating 100 ml of water with 10 g of crude oil, the temperature and pH were kept at 30˚C and 7.2 respectively. The weights of the adsorbent were varied from 1 - 5 g. The initial weights used for the adsorption were designated as W1. To carry out the adsorption process, a known weight of adsorbent was added to the surface of the contaminated crude oil-water mixture. An adsorption time of 30 minutes was allowed for the adsorbate molecules to be adsorbed unto the adsorbent surface. After this adsorption time, the mixture was filtered (with a negligible loss of crude oil on the filter), and the weight of the residue designated as (W2) while the filtrate was labelled for identification purpose. The experiment was carried out in duplicate and the average values were used for computation. All the experimental conditions were kept constant for all the treatment types considered. The adsorption capacity of each treatment types as a function of adsorbent weight was determined and recorded using Equation (1)
(1)
W1 = Initial weight of Adsorbent
W2 = Final weight of Adsorbent
The residual crude oil in the oil-water mixture and the adsorption uptake was determined with the UV spectrophotometer. Analytical grade of n-hexane was added to each of the filtrate to extract the oil from the surface. The mixture was then covered with foil paper and agitated vigorously. After the agitation, the mixtures were left for 30 minutes after which it was put in an environmentally controlled shaker for further agitation. The samples were then withdrawn, and the residual oil in the mixtures was determined from the absorbance value with the aid of UV spectrophotometer at the wavelength of 460 nm. A standard calibration curve depicted the absorbance and concentration relationship.
The amount of crude oil adsorb by the adsorbent was evaluated by calculating the adsorption uptake with Equation (2) and the percentage oil removed with Equation (3).
(2)
(3)
qt = adsorption uptake of oil (mg/g);
Co = initial concentration of oil (mg/l);
V = volume of mixture (l);
M = mass of the adsorbent (g);
Ct = final concentration after adsorption (mg/l).
3. Results and Discussion
3.1. Adsorbent Characterization
3.1.1. Elemental Composition and Physical Properties
The results of the elemental composition of the sponge gourd used in this study are shown in Table 1. The result shows that the prominent elements present are K, Cl, Fe and Ca with the percentage weight of 50.44, 12.58, 11.48 and 9.25, respectively. The results of the physical properties of sponge gourd are shown in Table 2. The moisture content of the sponge gourd was 11%. The values of the bulk density of the tapped and untapped sample show that the sample has a good potential to flow and arrange itself under compression. The porosity value of sponge gourd obtained shows that it can be used as an adsorbent material [1]. The ash content value obtained in this study is within the range of 0.4% - 3.0%, which is consistent with that reported for sponge gourd [16] [28].
3.1.2. Functional Groups Identification
The effect of pre-treating sponge gourd fiber with hot water and alkaline solution on the FTIR spectra was investigated. From Figure 1, the treatment of sponge gourd affects the eventual FTIR spectra results. The raw, hot water treated and alkaline treated samples are designated Raw sample, HWT and AT, respectively. The broad adsorption band of OH stretch was observed to remain the same in broadness and intensity for all samples. However, the band of hot water treated sample occurred at a lower wavenumber than the other samples. There was no pronounced change in the asymmetric C sp3–H stretch observed at 2918.40 cm−1 for the three samples. The peak at 1735.99 cm−1 observed in the untreated and hot water treated samples was absent in the alkaline treated sample. This is because the carboxylic group has been removed by the alkaline treatment by a process called de-esterification. There was a decline in the peak intensity observed at the region of 1637.63 cm−1 (free C=C stretch) after the treatment, the alkaline treated sample gave the least intensity. The drop observed at the peak intensity of 1508.38 cm−1 for the alkaline treated sample shows a decrease in the aromatic skeletal vibrations in lignin, bringing about a decrease in the lignin content of the sponge gourd fiber. At the band of 1384.94 cm−1, an intense and sharp peak was observed for the alkaline treated samples while the raw and hot water treated samples gave a small peak. This shows there was more of CH3 bending in alkaline treated sample because it gave the least peak intensity. There was also a small decrease in the C sp3-O stretch in the treated samples, with the alkaline treated given the least decrease. The reduction in the peak at the wavenumber of 1267.27 - 1234.48 cm−1 after alkalization shows that the hemicellulose in the fiber was easily removed [29]. The peak observed at 898.86 cm−1 shows that there has been a reduction in the beta-glycosidic linkages between the monosaccharide after the hot water and alkaline treatments.
![]()
Table 2. Physical properties of sponge gourd.
![]()
Figure 1. FTIR result of raw, alkaline treated, hot water treated sample. (HWT: hot water treated sample; AT: alkaline treated sample and the raw sample).
3.1.3. Effects of FTIR Spectrum Result before and after Adsorption of Alkaline Treated Sample
The FTIR spectrum results of the alkaline treated sample before and after adsorption given in Figure 2 shows that some functional groups were involved in the adsorption process. The spectral of the alkaline treated sample before adsorption is designated AT while that after adsorption is designated ATA.
A decrease was observed in the broadness and intensity in the band associated with the OH groups. This reflects a reduction in the aliphatic hydroxyl groups of the fiber polymer [23]. This may indicate the involvement of the OH group in the adsorption of the oil to the fiber. There was a rise in the intensity of the C sp3-H stretch present at 2924.18 cm−1 which suggests that crude oil was successfully adsorbed to the fiber surface. This was likewise corroborated by the presence of a new peak at the band of 2852.81 cm−1, which is the CH2 group present in crude oil [6]. A new peak observed at the band of 2360.95 cm−1 is characteristic of the nitrile groups of the crude oil adsorbed by the sponge gourd. The adsorption of crude oil was also confirmed by the increase in intensity and sharpness of the peak at 1465 cm−1 after the adsorption. This peak is ascribed to the C-H bending of crude oil [6]. The sharp peak observed at the band of 873.78 cm−1 disappeared after the adsorption process. This indicates that C-X group was involved in the adsorption of crude oil unto the sponge gourd fiber.
3.1.4. Effects of FTIR Spectrum Result before and after Adsorption Using Hot Water Treated Sample
The result of the FTIR obtained is shown in Figure 3. A reduction in peak intensity and broadness occurred at the OH stretching vibrations. This indicates that OH group was involved in the adsorption. As noticed with the alkaline treated sample, a sharp peak was observed at 2924.18 cm−1 and a new peak was found at 2852.81 cm−1. This likewise confirms the adsorption of crude oil to the fiber surface. The C=O bond observed at 1735.99 cm−1 reduced in intensity after adsorption process. This confirms that the carbonyl group was involved in crude
![]()
Figure 2. FTIR result of alkaline treated sample before and after adsorption. (ATA: alkaline treated sample after adsorption; AT: alkaline treated sample before adsorption).
![]()
Figure 3. FTIR result of hot water treated sample before and after adsorption. (HWTA: hot water treated sample after adsorption; HWT: hot water treated sample before adsorption).
oil adsorption. The increase in the intensity at 1464.02 cm−1 representing C-H bending of crude oil likewise confirms that the oil was adsorbed to the surface. There was a small increase in the CH3 bending vibrations at the peak of 1377.72 cm−1. At the peaks of 1244.13 and 1055.10 cm−1, a reduction in peak intensity was observed. This indicates that C sp3-O stretch was also responsible for crude oil adsorption. The C-X group present between the 719.47 - 430.14 cm−1 was observed to reduce in band intensity, this may indicate that carbon halide was involved in crude oil adsorption. The hot water treated sample after adsorption is designated HWTA.
3.1.5. Scanning Electron Microscopy
The results of the surface micrograph of the raw, alkaline, and hot water treated samples are shown in Figures 4(a)-(c). The topography of the three sample shows a homogenous aspect with a smooth surface containing lignin rich layer and also contains waxy and gummy substances [16] [30]. The topography of the alkaline treated sample shows that the surface has been modified. The hydrogen bond in the sample has been disrupted and the surface has become rougher and brighter confirming the removal of lignin and surface impurities of the outer cellular layer, thus, enhancing the surface area. This will enhance the contact of the fiber and adsorbate [31] [32]. The hot water treated sample gave a topography that has larger pores and a better surface area than alkaline treated sample. This may be due to a better removal of the surface impurities, and extractives from the sample caused by the high temperature (105˚C) used for the treatment. Also, as observed from Figure 4(b), the micrograph shows a good amount of pores on the surface, this might have contributed to the better performance showed in the adsorption experiment because more of the crude oil would have been adsorbed in these pores [33].
![]() (a)
(a)![]() (b)
(b)![]() (c)
(c)
Figure 4. (a) Alkaline treated; (b) Hot water treated; (c) Raw sample.
3.2. Effects of Adsorbent Dosage on the Adsorption of Crude Oil
The percentage weight gain (percentage adsorption capacity) for all the samples as a function of adsorbent dosage is shown in Figure 5. Increase in the adsorbent dosage brought about a decrease in the percentage adsorption per unit weight. This observation might have resulted from the reduction in total adsorption area available for binding as a result of overlapping or aggregation of adsorption sites [1]. The alkaline treated sample gave the highest percentage adsorption capacity of 962% at the adsorbent dosage of 1 g and the value decreased to 459% at 5 g. The adsorption capacity of the hot water treated sample shows a highest value of 760% at 1 g and the lowest value of 301% were shown at 5 g, while the raw sample gave the highest value of 664% at 1 g and the lowest value of 343% at 5 g.
The adsorption uptake of all the samples was observed not to follow similar trend for all the samples as the adsorbent weight was varied from 1 to 5 g.
As shown in Figure 6, the raw sample shows an increase in adsorption uptake as the adsorbent weight was raised from 1 to 2 g. However, a steady decrease in adsorption uptake was observed as the adsorbent weight was further increased from 3 to 5 g. The latter trend is the commonly reported for adsorption uptake of crude oil by lignocellulosic fiber [6]. The decline in adsorption uptake is usually ascribed to the higher unsaturated adsorption sites during adsorption process [34]. There was a consistent decrease in the adsorption uptake for alkaline treated samples. The adsorption uptake decreased from 3528.6 mg/g to 834.3 mg/g as the adsorption weight was raised from 1 to 5 g. This reduction may be as a result of overlapping or partial aggregation and screening effect on the adsorbent surface. The hot water treated sample showed a decreased in adsorption uptake as the adsorbent weight was increased from 1 to 2 g. However, a further rise in the adsorbent weight from 3 to 5 g led to the increase in adsorption uptake from 1065.1 to 1665.2 mg/g. This implies that as the adsorbent weight was raised, the amount of oil adsorbed per unit weight of the adsorbent increased.
The percentage of crude oil removed by the raw sample and the treated samples as a function of adsorbent weight was determined and the result is shown in Figure 7. It was observed that the amount of oil removed increased with rise in adsorbent weight for all the samples considered. The percentage of oil removed by the raw sample increased from 1.8% to 22.9% as the adsorbent weight was varied from 1 to 5 g. Similar increase was observed with the treated samples, where for the same increase in adsorbent weight, the amount of oil removed for the alkaline and hot water treated samples increased from 29.93% to 45.17% and from 29.57% to 83.27%, respectively. This increase in percentage of oil removed with increase in adsorbent weight is as a result of more active binding sites on the adsorbent surface. However, it was observed that though alkaline treatment sample gave the highest adsorption capacity than hot water treated sample, the reverse was observed with the percentage of oil removed. This may be caused by higher weight gain from the adsorption of water molecules rather than crude oil
![]()
Figure 5. Effect of pretreatment on the percentage adsorption capacity.
![]()
Figure 6. Effect of pretreatment on the adsorption uptake of crude oil.
![]()
Figure 7. Effect of pretreatment on the percentage of oil removed.
after the adsorption process [19]. Similarly, the rise in percentage of oil removed observed in hot water treated sample can be attributed to its increase in floating ability. The hot water treatment enhanced the floating ability of sponge gourd fiber on the oil-water mixture, thus, allowing for the preferential sorption of oil over water. This is consistent with the report of [14]. This also may explain the reason there was a decrease in the percentage adsorption capacity of hot water treated sample, where most of the adsorbent floats on the water, allowing more contact with the crude oil.
3.3. Effects of Particle Size on the Adsorption of Crude Oil
The effect of particle size on the adsorption potential of sponge gourd was determined by using different particle sizes of 0.85, 1.18, 2.36 and 4.75 mm. The percentage adsorption capacity was observed to increase in direct proportion with decrease in particle size and at an inverse proportionality with increase in adsorbent weight. At the adsorbent weight of 0.5 g, the percentage adsorption capacity increased from 332% to 600% as the particle size was reduced from 4.75 mm to 0.85 mm. However, as the adsorbent weight was increased to 2.5 g, the percentage adsorption capacity increased from 205% to 510%. This shows that the weight gain per unit mass of fiber decreases with adsorbent increase. The percentage adsorption capacity of 0.85 mm was more than that of all the other particle sizes as the adsorbent weight was increased as depicted in Figure 8.
The adsorption uptake (mass of oil adsorbed per mass of adsorbent used) was determined by varying the adsorbent weight and particle size. As depicted in Figure 9, the adsorption uptake was observed to be dependent on the adsorbent weight. As the adsorbent weight was increased from 0.5 - 2.5 g, the adsorption uptake decreased consistently. The adsorption uptake of 4.75 mm particle size was observed to decrease from 1486 mg/g to 1040 mg/g as the adsorbent weight rose from 0.5 - 2.5 g. The same reduction was observed for all the particle sizes as adsorbent weight was increased. This trend can be ascribed to the increase in unsaturated adsorption sites of the fibre during adsorption process as the adsorbent weight was increased [6]. However, the adsorption uptake did not follow a particular trend as the particle size was lowered. For instance, as the particle size was steadily varied from 4.75 - 0.85 mm, the adsorption uptake increased consistently until a particle size of 1.18 mm, after which it was observed to decrease at 0.85 mm particle size. The highest adsorption uptake of crude oil was observed at 1.18 mm particle size reaching a highest value of 6676 mg/g at 0.5 g and 2516 mg/g at 2.5 g adsorbent weight. Likewise, the lowest adsorption uptake was observed at 0.85 mm, reaching 1248 mg/g at 0.5 g and 1154 mg/g at 2.5 g of adsorbent weight.
The percentage of crude oil removed was also determined as a function of adsorbent weight and particle size. The effect of adsorbent weight on the percentage of crude oil removed was investigated by varying the adsorbent weight from 0.5 - 2.5 g. As shown in Figure 10, the percentage of crude oil removed was observed to depend strongly on the adsorbent weight. The percentage of crude oil removed increased instantaneously as the adsorbent weight was increased. The percentage of oil removed at a particle size of 4.75 mm increased from 7% to 26% when the adsorbent weight was increased from 0.5 - 2.5 g. Similarly, at 2.36 mm, the increase was from 13% to 33%, at 1.18 mm, it increased from 33% to 63% and from 6% to 29% when the particle size was 0.85 mm. This trend is consistent with that reported by Sidik, Jalil [6]. The rise in percentage oil removal can be ascribed to increase in the number of active sites present on the surface of the adsorbent. The percentage of crude oil removed by sponge gourd fiber was found to be dependent on the size of particle. The highest percentage of oil removed was observed at the particle size of 1.18 mm while the lowest value was observed at the particle size of 0.85 mm.
![]()
Figure 8. Effect of change in adsorbent weight and particle size on percentage adsorption capacity.
![]()
Figure 9. Effect of change in adsorbent weight and particle size on adsorption uptake of oil.
![]()
Figure 10. Effect of change in adsorbent weight and particle size on the percentage of oil removed.
4. Conclusion
In conclusion, modifying the surface of sponge gourd fibre improves the adsorption potential. The hot water treated sample removed 83.3% of the crude oil; the alkaline treated sample removed 45.1% while the raw sample removed 22.9% of crude oil from the oil-water mixture. The best treatment method is the hot water treatment and this was confirmed by the morphology of the sample surface. The particle size of the sponge gourd used for adsorption was observed to significantly control the adsorption performance. The optimum particle size was 1.18 mm, above and below this value; the adsorption potential of the sample was reduced. We report that the treatment methods used significantly enhanced the adsorption potential of sponge gourd. Research is ongoing in our lab to provide the effects of some parameters such as temperature, time on the adsorption capacity of sponge gourd for crude oil.
Acknowledgements
The authors would like to thank the Reaction and Biochemical Engineering laboratory of the Obafemi Awolowo University, Ile-Ife, Osun State, Nigeria for providing us with the equipment used in this study.