Land Use/Land Cover Dynamics and Anthropogenic Driving Factors in Lake Baringo Catchment, Rift Valley, Kenya ()
1. Introduction
Land Use and Land Cover Change (LULCC) is a major component of global environment change [1]. It is also an important aspect of human alteration of the Earth System functioning [2]. Land cover can be described by the biophysical features of the land surface such as forests while land use refers to the human modification of natural environment such as farming [3] [4]. There has been a rapid land use change in East Africa [5]. Many parts of this region are experiencing these changes at varied spatial and temporal scales anthropogenic activities [6]. The functioning of Lake Baringo is threatened by degradation despite being a source of livelihood to the community [7]. The driving forces of LULCC vary from one place to the other [8]. Driving processes are reflected through the transition of land use and land cover [9]. Human alteration of the environment has been existing for thousands of years. However, the degree and intensity of LULCC are far-off greater now than it was in the past [10]. Variation in social, political, and economic characteristics defines the rate at which humans can transform the condition of their environment [11]. Land cover change reveals the dimension of human activities in a given environment [12]. In East Africa, Land uses have transformed the natural environment into settlements agricultural lands, grazing lands, and urban centers [5]. In Kenya, the growing population over the years has exerted pressure on the land resources where approximately 75% of the population participates in agriculture but only 20% of its land is arable [13]. Lake Baringo ecosystem is a reflection of environments undergoing remarkable land cover change due to several reasons [6]. The pastoral communities in catchment have destroyed the vegetation cover [14]. They keep large numbers of cattle, which overgrazes the catchment vegetation leading to enhanced soil erosion, sedimentation in streams and the lake, and frequent flash floods [15]. The increasing human populations in the catchments have also led to the uncontrolled destruction of riparian forest, coupled with foraging by livestock ultimately leading to soil erosion and sedimentation [16]. The Changes in land cover can widespread effects at local, regional and global scales [17].
Although practices vary across the world, their eventual consequences are the same [18]. Land use and land cover changes deteriorate the natural ecosystems consequently leading to environmental hazards [19]. Increased population growth and increasing demand for resources have contributed to unique land use categories which are attributed to soil degradation and ecosystem services [2] , and alteration of the hydrological systems [20]. Kenya’s Rift Valley has been undergoing rapid land cover change for the past two decades, which has resulted in ecological and hydrological changes [21]. Lake Baringo has faced several ecological challenges such as Land cover changes, Biodiversity loss, Habitat degradation and Algal blooms [22]. Altered land cover in Lake Baringo catchment has led to the increased erosion and sediment transport to the lake consequently changing the hydrologic pattern [23]. Whenever it rains around the lake there are flush-floods from inflowing rivers due to poor farming practices on the Turgen hills surrounding the lake [24]. Land use studies are significant in understanding hydrological processes in the watershed [25]. LULCC can mirror the pattern of human land use in a region, and plays an important role in water and soil conservation [26]. Understanding how such human factors interact in driving land use will upgrade human understanding and responses to environmental changes [4]. Knowledge of the distribution of land use and land cover is fundamental in environmental planning projects implementation and management [27]. The primary objective of this study is to analyse the spatial and temporal changes of Land use/land cover in Lake Baringo Catchment from 1988 to 2018 and to identify the main driving forces. Therefore, information on LULCC vital in policy formulation and making informed decision for sustainable natural resources management in Lake Baringo Catchment.
2. Materials and Methods
2.1. Study Area
Lake Baringo is one of the two freshwater lakes in the Rift Valley floor in Kenya. Lake Baringo is an internationally recognized important world Ramsar site. It is located in the Eastern arm of the Great Rift Valley (00˚30'N and 00˚45'N, and 36˚00'E and 36˚10'E) and at an elevation of about 970 meters (Figure 1). It has a surface area of about 130 km2 which may rise to 168 km2 during the rainy seasons and an altitude of about 1100 m.a.s.l. It drains a total area of 6820 km2. The lake’s water catchment includes the Mau Hills and Tugen Hills. Perkerra and Molo are the perennial rivers that drain into the lake whereas seasonal rivers include Endau, Chemeron Ol Arabel, Makutan and Tangulbei. It has no visible outlet and it is believed to have an underground seepage at Kapedo to the north and the water flows out as geysers and hot springs into Lake Turkana. The area receives an annual rainfall that ranges from 450 from 900 mm. It is characterized by a very high annual evaporation rate that ranges from 1650 from 2300 mm [28]. The long rains occur in the months of April to August, whereas the short rains fall from October to November. The geology of the area is mainly undifferentiated volcanic rocks, while the soils are of clay type. The landscape is characterized by steep slopes from the Tugen Hills and Eldama Ravine Highlands to the Perkerra River, grading into gentle slopes, and finally to the floodplains of Marigat. The study area is inhabited by three major ethnic groups namely the Turgens to the east, Pokots, to the north, Ilchamus/Njemps South and eastern sides. All groups agro-pastoralists. Pokot who inhibits the northern part of the area is heavily dependent on livestock and in particular goats. The animals have, apart from the basics of giving them meat, blood and milk, a big social and
![]() Source: Researchers Survey.
Source: Researchers Survey.
Figure 1. Lake Baringo Catchment.
cultural value. Il Chamus inhabits the lowland close to Lake Baringo. They combine rain-fed cultivation with some irrigations, but are mainly livestock keepers as well. Tugen originated in the surrounding uplands, but have progressively expanded down into the valley floor. Lake Baringo is a critical habitat and refuge for more than 500 species of birds and fauna, seven species of fresh water fish. In addition, it is a habitat for several species of animals including the hippo, Crocodiles and many more freshwater organisms. The lake has major seven islands namely Ruko, Rongena, Linage, Samatian, Olkokwa, Parmalok and the Devil’s Island. Ol-Kokwa is the largest Island. It has several hot springs and geysers. Ruko, on the other hand, is a park having a variety of wildlife such as Zebra and Giraffe. These have promoted ecotourism and the expansion in hotel industry.
2.2. Data Acquisition
Satellite imageries and topographical maps of the area together with geographical coordinates of selected ground control points were used for registration and image matching, classification and processing. The satellite imagery was selected from SPOT Image for the years 1988, 1998, 2008 and 2018. Spot Images were used because they have high resolution and are already orthorectified. They offer an optimum combination of resolution and coverage. Topographical maps of the study area supplemented with Google map and Google Earth representing the Lake Baringo Watershed were important in identifying Ground Control Points (GCPs). GPS measurements and orientation were taken using Handy-android powered GPS with accuracy of 2 m. The Ground Control Points helped during ground truthing as well as creating training sites used in supervised classification.
Socio-economic data including livelihood activities and land use change driving factors were obtained through field interviews and observations.
2.3. Data Analysis
1) Image enhancement
Image preprocessing was done using ENVI 5.3 because of its wide range of tools for image preprocessing, flexible in image display and the ability to process large multispectral remote sensing data. At this stage, visual quality of the image was enhanced by manipulating digital pixel values through a process known as contrast enhancement. The goal of image enhancement is to improve the visual interpretability of an image by increasing the apparent distinction between the features. Brightness differences of the image were improved uniformly by adjusting the bright and dark pixels so that the intermediate values have better contrast.
2) Layer stacking
Layer stacking were carried out on the downloaded data to acquire Multi-band composite images. The SPOT Images were obtained in their single bands separately. These constituent bands are stored in a Tagged Image File Format (TIFF) format which are not as useful individually as when stacked together to form a single image. Each band provides record of amount of energy reflected in a specific portion of electro-magnetic spectrum. Therefore assigning band 4 with a red color, band 3 with green color and band 2 with blue based on false color composite scheme which helped in understanding changes in vegetation over time and visually interpret changes in land use.
3) Image clipping
Image clipping was carried to help reduce the whole image to a smaller more workable Area of Interest (AOI) showing Lake Baringo Watershed. This helped reduce the computation time of the processes and eliminate the production of excess data that unnecessarily lengthens the classification process. This was carried out using the extract by mask tool found in ArcGIS 10.4 software using the Lake Baringo watershed extend shape file.
4) Image Classification
In the study, the SPOT Images used in classification of land use/cover in Lake Baringo watershed for 1988, 1998, 2008 and 2018 were from sensors SPOT 1, SPOT 3, SPOT 5 and SPOT 7.ENVI 5.3 Image processing software was used for the development of land cover and land use classes and subsequently for change detection analysis of the study area. ArcGIS 10.5 was used for displaying and subsequent processing and enhancement of the images. It was also used for clipping out the area of interest from the images using topographical maps of the area and designing all maps as a result of Land use and Land cover classification outputs.
Supervised classification based on Maximum Likelihood Classifier (MLC) was used for classification of the image. The training sites were representative sample of different land cover type. Hand-held android powered Global Positioning System (GPS) helped in selecting ground control points which formed basis for training sites. MLC uses probability of a pixel in a given training site of a given land cover class if the probability of that pixel is larger than the probability of its occurrence in any other class. if and only if the probability of that pixel is larger than the probability of its occurrence in any other class. The advantage of MLC over parallelepiped and minimum-distance methods of supervised classification is the use of mean and standard deviation in assigning pixels giving the results better accuracy and reliability. The process of classification on ENVI involved collecting classes from the image by capturing at least 3 ROIs within a certain class for the best representation of the spectral signature within that class. It was followed by clicking within the zoom window to draw the polygons. Training sites helped in the drawing of polygons and this enhanced accuracy in class identification.
After collecting at least 3 ROIs of the first class, a New Region in the ROI Tool was selected to start collecting another class. This was followed by classifying the classes. Once the classification was completed, a new classification image appeared. Maximum Likelihood method, a type of supervised classification, assumed that the statistics for each class in each band are normally distributed and calculates the probability that a given pixel belongs to a specific class. Each pixel is assigned to the class that has the highest probability. A total of 6 land cover classes were considered namely; Water Bodies, Bare areas Forest/vegetation, Settlements, and Rangeland.
5) Training signatures
Generation of training signatures based on the training sets was used to create class signatures. This helped in identifying pixels with similar spectral reflectance and assigned them appropriate information classes.
6) Accuracy assessment
Accuracy assessment, sometimes known as confusion matrix was an important step that helped in determining accuracy of the classification, particularly of pixels in a given class. Accuracy analysis helps to quantitatively assess the performance of classification and determine the quality of information from the remotely sensed data. The process helped determine how effectively pixels were grouped in to the correct features classes after classification. The columns of the accuracy assessment show the number of pixels per class for the reference data, and the rows show the number of pixels per class for the classified image. Topographical sheets for year 1988 and google earth imageries for year 2018 were used in accuracy by comparing them to classified images. They were used as reference data to generate data.
7) Spatial-Temporal Changes
This analysis was carried out to find the rate and pattern of LULCC. This was attained by subtracting the total area in 2018 from the total area in 1988. The resultant figure is multiplied by 100 to obtain the rate of change that occurred, which could be positive (increase) or negative (decrease).
3. Results and Discussion
3.1. Analysis of Land Use and Land Cover Types
The results of the image classification identified six major land uses including water bodies, settlement, Range land, vegetation, farmland and bare land as shown in Table 1. Results from the classified image show that rangeland dominated the catchment with 104,889.74 ha representing 47.25% of the land as depicted in Figure 2 and Table 1. Water Bodies, settlement and forest cover also covered the better part of the catchment constituting 21,632.42 ha (9.74%), 21,325.75 ha (9.61%) and 18,635.93 ha (8.4%) respectively. Farm land and Bare land Covered a small part of the catchment with 4256.27 ha (21.74%) and 7245.41 (3.26%) ha respectively as displayed in Table 2. The changed land cover
![]()
Table 1. Land Use and Land Cover Changes in Lake Baringo Catchment, from 1988-2018.
Source: Researcher’s analysis, 2018.
![]()
Table 2. Percentage change in Land Use Land Cover.
Source: Researcher’s analysis, 2018. N.: (+) is increase, (−) is decrease.
![]() Source: Researcher’s analysis, 2018.
Source: Researcher’s analysis, 2018.
Figure 2. Spatial-temporal distribution of LULC patterns in 1988.
is in many respects an effect of the increased population combined with the large social importance of livestock [23].
3.2. Spatial Temporal and Use and Land Cover Change Analysis from 1988-1998
The results revealed that, between the years 1988-1998 water bodies decreased by 2.77% from 21,632.42 ha to 20,821.62 ha as displayed in Figure 3. This can be attributed to the increased irrigation activities in the catchment and high solar radiation considering the fact that the catchment is located in a semi-arid land. Water diversions for irrigation also have been made from the Perkerra, Molo, Ol Arabel Rivers have also contributed to reduced stream flow [15]. Settlement increased by 2.22% from 21,325.75 ha to 26,247.37 ha. The increase in settlement may be associated with population growth as well as industrial development during this period. The catchment is gradually expanding into urban due to the development of industries such as sisal industries and tourism. Despite increasing economic development through tertiary industry in remote area, ecotourism also contributes to intensive land use [29]. A similar study in Modjo Watershed, Ethiopia revealed that increased settlement is one of the factors that heavy impacts the land [30]. Rangeland decreased by 15.14% from 104,889.74 ha to 97,215.91 ha. This can be attributed to the increased agricultural activities in the catchment such as Perkerra irrigation scheme and large scale sisal plantation in Mogotio as shown in Plate 1. Lake Baringo being a pastoralist community, overgrazing can be attributed to the decline in rangeland cover. Degradation of rangeland resulted from overgrazing in semi-arid mountainous watershed of High Atlas, Morocco [31]. The transformation and disintegration semi-natural rangelands results to biodiversity loss [32]. Forest/Vegetation increased by 1.30% from 18,635.93 ha to 20,365.43 ha. Forest covers slightly increased in the catchment during this period due to the introduction of Prosopis Juliflora after being introduced into the rangelands of Baringo in the early 1980s through the efforts of the “Fuel wood/Afforestation Extension in Baringo” project, a joint initiative of the Food and Agriculture Organization (FAO) and the Government of Kenya [33]. Baringo was severely degraded, after prolonged droughts in the 1970s, and this called for the urgent need for rehabilitation through drought tolerant species [34]. Although this invasive species has dominated the catchment chocking other natural vegetation [25] , made Similar observation in Keleta watershed, Awash River basin whereby the forest covers increased in the watershed from, 367 ha (0.4%) in 1998, to 544 ha (0.6%) in 2011 due the implementation of afforestation programs buy the Ethiopian government after the mid 1980’s. Farmland increased by 21.11% from 4256.27 ha to 52,178.41 ha. Increased vegetation cover can also be attributed to the implementation environmental management policies and catchment rehabilitation projects by national and regional non-governmental organizations (NGOs) and of local community-based organizations (CBOs). The rehabilitation includes grass reseeding, promotion of agro-forestry, adoption of modern charcoal burning techniques and energy-saving stoves. An indication that the
![]() Source: Researcher’s analysis, 2018.
Source: Researcher’s analysis, 2018.
Figure 3. Spatial-temporal distribution of LULC patterns in 1998.
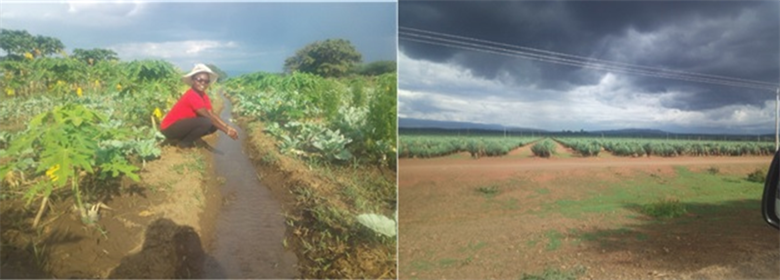
Plate 1. Large Scale irrigation farming at Perkerra and Large Scale sisal plantation in Mogotio.
management of the ecological environment of the Lake Baringo Catchment has actually had a positive effect Rapid population growth put pressure on demand for food thus increasing the farming activities. Population as a driving factor is partially accountable for the extension of farmlands and settlement [35]. According to [10] , observed increase in agricultural area from1992 to 2012 in Islamabad Pakistan is driven was by economic development, climate change and population growth. Bare Land decreased by 1.75% from 7245.41 ha to 5156.78 ha and this can be attributed to increased farming activities, settlement and re-afforestation. A previous study assessing the relationship between water quality parameters and changes in land use patterns in the Upper Manyame River, Zimbabwe revealed bare land decrease between years 1984 to 2011 by 31.7% due to expansion or increase of agriculture and urban areas [36].
3.3. Spatial Temporal and Use and Land Cover Change Analysis from 1998-2008
The LULC trends from 1998-2008 indicated that human activities had begun taking effects on the catchment. Water bodies continued to decrease by 0.76% from 20,821.62 ha to 19,124.62 ha due to increased industrial development, irrigation and urban growth (Figure 3). Irrigation activities have led to the diversion of Lake Baringo inlets thus reducing the water levels. A similar observation was made in a previous study in the same lake which showed a reduction in lake coverage by more than one kilometer due to the blocking of the inlets [14] [37] , reported that urban growth within Eleyele Reservoir imposed a lot of pressure on the reservoir. The development of the urban centers in the catchment and increased tourism activities continuously attracted settlement in the catchment which increased by 1.59% from 26,247.37 ha to 29,758.35 ha [37] [38] , confirms that land use changes on various catchments and water towers in Kenya have been increasingly characterized by human settlement. Rangeland continued to decrease by 4.13% from 97,215.91 ha to 88,040.54 ha due to the increased conversion to settlement and agricultural land. Overgrazing is considered to reduce vegetation cover and result in rangeland degradation in Central Asia, it was found that most of rangeland degradation happens in areas near population settlements [39]. However [40] , argues that climatic variation impacts on rangeland are significantly higher than overgrazing induced effects. The introduced Prosopis Juliflora species grew at a fast rate and increased the vegetation cover by 1.14% from 20,365.43 ha to 22,896.21 ha. Irrigation schemed in Perkerra, Chemususu dam alongside others mall holder subsistence farming increased the Farmland coverage by 3.21% from 52,178.41 ha to 59,320.27 ha. A similar study in upper reaches of the minjiang river, China revealed that the area of farmland and settlement increased by 12.61% from 1974 to 2000 and this increase is linked to increasing population pressures [41]. Bare Land decreased by 1.04% from 5156.78 ha to 2845.53 due to the expansion of settlement and agricultural activities by 1.59% and 3.21% respectively.
3.4. Spatial Temporal and Use and Land Cover Change Analysis from 2008-2018
During this period, Water bodies increased by 1.87% from 19,124.62 ha to 23,285.15 ha (Figure 4 and Figure 5). The increase in water could be associated with high rainfall in 2018. Additionally, increased erosional activities in the catchment have increased sediment loads into the water bodies thus reducing their depth and expanding their coverage beyond the threshold as shown in Plate 2. This finding is consistent with a study in Makueni County, Kenya [13] , found out that water bodies increased from 1.1 km2 in 2000 to 5.77 km2 in 2016. Additionally, the result in agreement with a previous study in Islamabad Pakistan which indicated an increasing rate of water class from 1416 ha in 1992 to 1579 ha in 2012 and it was attributed to rain fall in the Monsoon Season.
Compared to the previous years, settlement increased at a slower rate. Settlement increased by 0.94% from 297,58.35 ha to 31,857.64 ha (Figure 6). A previous study in Amboseli national park in Kenya has shown that human settlement is partly responsible for reduction in availability and quality of water resources leading to a decline in vegetative resources and wildlife [5]. The Rangeland also decreased at a minimal of 3.74% from 88,040.54 ha to 79,747.41 ha. Rangeland degradation is mainly driven by overgrazing, cutting of shrubs, abandonment, and lack of maintenance of rangeland infrastructure [39] [42] , reported dramatic variations of rangeland in the Kailash Sacred Landscape of China to the climate warming and increasing drought. A study in Niger revealed an annual decrease in rangeland by 5% from 1994 to 2006 resulting from decreasing soil fertility and increased grazing pressure [43]. Overgrazing and reduction of the tree cover continue to reduce rangelands production in Malawi [44]. Rain fed rangelands have significantly decreased as a result of overgrazing and deforestation in Uzbekistan [44]. Forest/Vegetation increased at a slower rate 0.21% from 22,896.21 ha to 23,356.36 ha compared to the previous years of study [45] , observed increase in forest cover due to re-vegetation Urban District of Ghana. Farmland increased at a slower rate; by 1.7% from 59,320.27 ha to 63,085.76
![]() Source: Researcher’s analysis, 2018.
Source: Researcher’s analysis, 2018.
Figure 4. Spatial-temporal distribution of LULC patterns in 1998.
![]() Source: Researcher’s analysis, 2018.
Source: Researcher’s analysis, 2018.
Figure 5. Spatial-temporal distribution of LULC patterns in 2008.
ha. This can be related to residents adopting other alternative sources of income such as trading, bee keeping and charcoal burning among others. Increased settlement and farming activities continuously contributed to the decline of Bare Land by 0.99% from 2845.53 ha to 653.2 ha (Figure 7).
3.5. Driving Factors of Land Use and Land Cover Change
An amalgamation of biophysical and socio-economic factors defines the LULC changes in Lake Baringo Catchment. Natural factors such as soils and relief influences the erosional processes but human activities intensify it [46]. The rapid population growth in the catchment has led to the increased pressure on the available resources. The catchment comprises of three major ethnic groups,
![]() Source: Researcher’s analysis, 2018.
Source: Researcher’s analysis, 2018.
Figure 6. Bar chart representing the LULC classes in 1988, 1998, 2008 and 2018.
![]() Source: Researcher’s Survey 2018.
Source: Researcher’s Survey 2018.
Figure 7. Relative change in land use and land cover.
namely the Pokot, Turgen and Il Chamus. Pokot who inhibits the northern part of the area is purely pastoralists Il Chamus inhabit the lowland close to Lake Baringo are agro-pastoralists while the Tugen occupying the uplands are mainly agriculturalists. Other socioeconomic activities undertaken by the communities include mostly bee-keeping, fishing, charcoal burning and tourism as illustrated in Figure 5. Land cover has gone through some changes during the latest decades in the catchment of Lake Baringo.
The catchment is faced with pressure arising from an increasing human population which has resulted in increasing demand for land purposely for human settlement and agricultural activities. Tourism development in Lake Baringo has led to the population increase in the catchment due to the impression of the availability of employment openings. here has been increased establishment of tourist lodges at the shores and on the Islands such as Soi Safari Lodge, Tamarind Garden, Tumbili Cliff, Roberts Camp, and Samatian Island Lodge among others and this has modified the landscape as shown in Plate 2. Despite increasing economic development through tertiary industry in remote area, ecotourism also contributes to intensive land use [29]. The establishment of industries such as sisal industry, donkey abattoir in Mogotio and the Perkerra irrigation scheme has led to increased settlement in the catchment. Perkerra irrigation scheme led to the growth of Marigat town and this has attracted more settlement in the catchment.
Lake Baringo Catchment is an area of intensive farming shown in Figure 8, 8.24% of the respondents are engaged in farming. The residents mostly cultivate horticultural crops such as vegetables, onions, tomatoes, watermelon, bananas and papaya. They also cultivate cereals such as maize, beans, millet and sorghum. Tubers such as potatoes and cassava are also grown in small scale. Large scale sisal farming is another major activity taking place in Lake Baringo catchment at Mogotio. Perkerra irrigation scheme is the largest irrigation project in the catchment leading to increased water abstractions from River Perkerra, Molo and Ol Arabel. Perkerra Irrigation Scheme utilizes over 70% of the Perkerra River water leaving 30% to flow into the lake [47]. Irrigation farms in the upper reaches
![]() Source: Researcher’s analysis, 2018.
Source: Researcher’s analysis, 2018.
Figure 8. Livelihood activities in Lake Baringo Catchment.
of the rivers entering Lake Baringo have seriously increased the drying up of the rivers [48]. The reduced water inflows to the Lake Baringo resulted in a low lake depth of about 1.7 m early in 2003 and a limited number of aquatic animals can survive under such conditions [15]. The vegetation in the catchment is mainly dominated by Acacia and Commiphora species with little undergrowth, perennial, forbs, grasses, Celtisspp, Urticaceae, Myrtaceae, Croton, Holoptelea, Prunus, Podocarpus, Prosopis Juliflora and Olea, among others. Some papyrus (Cyprus papyrus) and Typha grow in the mouths of rivers, and especially in the wetlands in the southern part of the lake. Tree logging for charcoal burning has resulted into in alteration of plant species and reduction in plant density. Charcoal burning is one of the major livelihood activities in the Catchment and 14% of the respondents are involved in charcoal burning (Plate 2). It is common in the northern part of the catchment at Loruk. Decrease in forest cover is associated with the felling down of trees for charcoal burning [49]. Charcoal burning leads to clearing of the forests rendering the catchment vulnerable to sedimentation and flooding as shown in Plate 3. Deforestation increases the vulnerability of an area to agents of erosion such as wind and water [46]. Recent rise in the
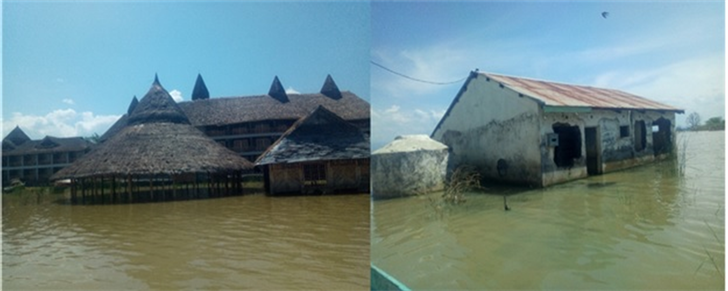
Plate 2. Tree logging for Charcoal burning in Loruk.
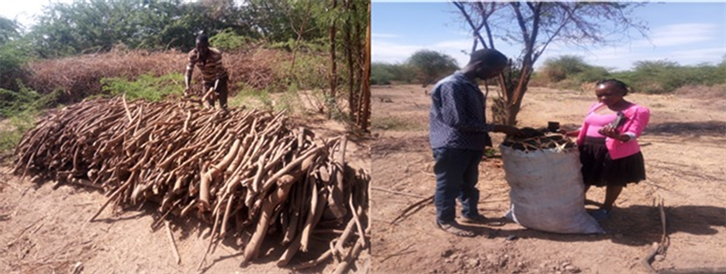
Plate 3. Flooded Soi Lodge and abandoned hotels due to increased sedimentation.
lake levels in the two lakes resulted in the destruction of infrastructures and economic losses in the riparian zones [16].
The catchment exhibits large economic and cultural attachment to livestock by the residents at the catchment 14% of the respondents are engaged in pastoralism. Traditional livestock keeping in the catchment has led to the overgrazing of the fragile arid and semi-arid area of the catchment. Pastoralism is the major livelihood activity in the catchment. They mainly keep cattle for milk and meat, goats for meat, sheep and donkeys among others. Livestock keeping is mainly undertaken by the Pokot, who keep large herds of cattle and goats for meat and milk. These cattle are mostly on free range resulting in land degradation and water pollution through surface runoff from farms. The lack of grazing restrictions and responsibility for land has led to many places too severe overgrazing in the catchment. This has in its turn leads to a constantly decreasing vegetation cover and thereby an increasing pressure on the land [23]. Excessive grazing is one of the key disturbances leading to rangeland degradation (Akiyama and Kawamura, 2007). Additionally catchment frequently experiences drought events leading to a reduction of rangeland cover. According to [40] , climatic variation had more negative impact on rangeland, than overgrazing. Additionally, a previous study in Tibetan Plateau revealed that increasing warming would decrease rangeland quality and net primary productivity rangeland [50] [51]. Significant increase in built-up, agricultural, and unused land and the decrease in wetlands and forests indicate deteriorated environmental conditions [52].
4. Conclusions
The study has shown the major land use/land cover types in Lake Baringo catchment such as water bodies, settlement, range-land, vegetation, farmland and bare land. The assessment of LULC revealed that water bodies, settlement, Forest and Farmland increased during 1988-2018 resulting in significant reduction of rangeland and bare land. Major driving forces of Land Use Land Cover Changes are increased population growth, poor farming practices, overstocking, charcoal burning urbanization, industrialization and tourism. These factors lead to the intensification of the pressure on the land. Altered land cover in the catchment area has increased erosion and sediment transport to the lake consequently polluting the lake, reducing its depth and increasing incidences of flooding.
The study, therefore, recommends the following.
1) Land use practices within the water catchments should put be monitored and controlled in order to achieve ecological integrity.
2) Water Resources Authority should ensure that the formulated policies are implemented to stop catchment degradation.
3) National Environment Management Authority Kenya (NEMA Kenya) should ensure that all proposed projects within the catchment are subjected to Environmental Impact Assessment.
4) Kenya Forestry Services (KFS) should ensure the enforcement of policies that control de-afforestation.
5) Alternative livelihood activities should be promoted to reduce over-dependence on the catchment resources.
6) There is the need to establish the possible influences of the LULCC on the hydrological processes and water quality in the catchment.
Acknowledgements
This research was supported by the African Union Commission through flagship institution Pan African University (PAU). We wish to acknowledge all the reviewers.