A Three-Layers Plane Wall Exposed to Oscillating Temperatures with Different Amplitudes and Frequencies ()
1. Introduction
Temperature oscillations on a plane wall have a high importance in some engineering areas. For example, the cylinder plane wall of a combustion engine is revealed to an oscillating temperature by the unsteady burning of the fuel into the engine cylinder space. Despite that the temperature oscillating amplitude may have a small value related to the temperature full value, a fatigue stress may appear causing a matter failure. Racopoulos et al. [1] [2] investigated the temperature oscillations in the combustion chamber walls of a diesel engine. Based on theoretical model and experimental measurements, the penetration of the oscillating temperature part of the temperature full value into the inner cylinder wall was shown for few matters. It was observed that when increasing the degree of insulation, the wall temperature swings highly increase, while at the same time the corresponding depth inside which they disappear, decreases. Investigation of the efficiency of a thermoelectric power generator (TPG) was performed by Yan and Malen [3] . Thermoelectric power generator converts heat directly into electricity without moving parts. It was shown that the use of a periodic heat source can increase the efficiency of a TPG. Temperature oscillations may be also formed by a periodic heating. Two methods of periodic heating implementation are an induction heating and a direct resistance heating. Surface hardening, welding and melting are some applications of induction heating. Direct resistance heating has major metal working applications as heating prior to forming and heat treating. Major nonmetals application is a glass melting. Sahin and Yilbas [4] analyzed the temperature rise in an insulated slab which is subjected to a direct resistance heating and to a conduction heating. It was found that for both heating methods, the thermal penetration depth for high frequencies is small. Additional area related to temperature oscillations is the controlling temperature in buildings. Ma and Wang [5] investigated the dynamic heat transfer performance of an exterior Planar Thermal Mass (ePTM) subject to sinusoidal heating and cooling. Analytical solution was performed when the mean value of outdoor air temperature was equal to indoor air temperature. The analytical solution showed that the time lag and the decrement factor are independent of environment temperatures. Rojas-Trigos et al. [6] analyzed a sample that is uniformly heated on one of its surfaces by a power density modulated by a periodical square wave. The solution comprises a transient term and an oscillatory term superposed to it. Comparison between experimental results and the theoretical transient response showed a good adequacy. Non-Fourier behavior or a non-Fourier model is a modification of Fourier law in order to get a finite velocity of the heat wave. Cossali [7] investigated the effects of non-Fourier characteristics of the material on oscillating thermal fields. A general solution in terms of temperature Fourier transform was shown for a 1-D slab with convective boundary conditions. Al-Sanea and Zedan [8] investigated numerically the effect of the insulation layer in a composite wall on the rate of heat transfer under steady periodic conditions for summer and winter conditions in Riyadh Saudi Arabia. The numerical model was validated against a semi-analytic procedure based on the Laplace transform technique developed for a three-layered composite wall. The wall was subjected to a sinusoidal ambient temperature variation and a periodic solar insolation on one side and constant room temperature on the other side. The thermal performance with an insulation layer placed on the inside of a wall structure was compared to that when the insulation layer was placed on the outside. The result of the model application showed that the location of the insulation layer has a minimal effect on mean daily heat transfer rates. While dealing with improved heat transfer models in order to cover finite speed of heat propagation Al-Nimr et al. [9] investigated the thermal behavior of a two-layered thin slab carrying periodic signals under the effect of the dual-phase-lag heat conduction model. Two types of periodic signals were considered, a periodic heating source and a periodic imposed temperature at the boundary. The deviation among the prediction of three models (the classical Fourier diffusion model, the thermal wave model and the dual-phase-lag model) were estimated. It was found that the deviation among the three models increases as the frequency of the signal increases and as the thickness of the plate decreases. It was shown that the use of the dual-phase-lag heat conduction model is necessary when the metal film thickness is of order and the angular frequency of the signals is of order 10−6 m and the angular frequency of the signals is of order 1012 rad・s−1. Perez and Autrique [10] investigated an experimental technique dedicated to thermal diffusivity or thermal conductivity identification in isotropic and orthotropic materials. The method is based on analysis of thermal waves induced by periodic excitation in planar samples. It was shown that phase-lag spatial fluctuations as a single frequency are more informative than a frequency sweep at a single point in space in orthotropic specific configurations.
An example of a system that could clearly describe the need for such a research is a chip cooling system. On the chip in the direction of the fins array, four layers are sometimes identified: an internal interface (TIM1-thermal interface material type 1), a lid or a cap, an external interface (TIM2) and the base of the fins array. The alternating current that is passing into the chip through its Ohm resistances causes fluctuations in the chip internal heat production leading to temperature fluctuations.
As reviewed above, works dealing with oscillating heat source or oscillating temperature were based upon experimental results combined with nonlinear models. Basically, the energy constraint was located on one surface only and heat was transferred along one homogeneous medium. This work purpose is to introduce temperature distributions of three layers plane wall exposed to temperatures oscillations with different amplitudes and frequencies. It was performed by using a physical superposition and complex numbers. Despite this physical model is based upon linear equations, it expand clearly the relevant knowledge, in principle, to unlimited different mediums while the energy source may be located around the system surfaces. The results received support previous works.
2. The Current Model
The current model is intend to solve the temperature distribution of three layers plane wall exposed to temperatures oscillations with different amplitudes and frequencies as is shown in Figure 1.
The main assumptions accompanied the physical model development are
unsteady heat transfer and one dimensional heat conduction without heat generation.
In order to solve the main problem two more simple problems were solved. After solving the more simple problems a physical superposition were performed in order to identify the main problem solution.
2.1. A Three Layers Plane Wall Exposed at One Surface (the Left Surface) to Temperature Oscillations Where the Other Surface (the Right Surface) Is Maintained at a Relative Zero Temperature
The structure problem is shown in Figure 2.
The characterized differential equation is:
(1)
or:
(2)
All equations parameters are dimensionless,
is a dimensionless temperature,
is a dimensionless length,
is a dimensionless thermal diffusivity and
is a dimensionless time. The dimensionless length is defined as
. If average values are defined:
,
, average time period
, average frequency
then the dimensionless parameters may be defined:
,
,
,
. Sub-indexes 1, 2 and 3 are related to every wall layer. The average parameters definition of
,
and
is according to the constraint on the external system surfaces and is not related to a specific slab.
It is defined:
(3)
(4)
![]()
Figure 2. The first building problem, a three layers plane wall exposed at one surface (the left surface) to temperature oscillations while the other surface (the right surface) is maintained at a relative zero temperature.
The temperature distribution into every block layer is received as:
(5)
(6)
(7)
(A possible development solution to Equations (5)-(7), see the appendix)
where:
(8)
(9)
(10)
If average value are defined:
then the dimensionless conductivities may be defined:
,
,
.
Six boundary conditions have to be defined:
(11)
(12)
(13)
(14)
(15)
(16)
Boundary conditions 11 and 16 indicate the temperature constraints on the system external left surface and on the system right external surface. Boundary conditions 12 and 14 indicate the temperatures on the boundary surface between the first and the second slab and on the boundary surface between the second and the third slab, boundary conditions 13 and 15 indicate the heat flux through these surfaces.
Despite the problem is a time function, the time conditions are periodically steady and initial conditions is not needed.
By placing the temperatures distributions equations (Equations (5)-(7)) into the boundary conditions (Equations (11)-(16)) the following equations are received:
(17)
(18)
(19)
(20)
(21)
(22)
By defining:
(23)
(24)
(25)
(26)
(27)
(28)
(29)
(30)
(31)
(32)
(33)
(34)
(35)
(36)
(37)
(38)
(39)
(40)
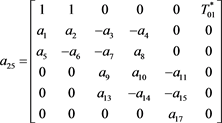
The coefficients algebraic system equations are received as:
(41)
(42)
(43)
(44)
(45)
(46)
The relevant determinants are defined:
(47)
(48)
(49)
(50)
(51)
(52)
 (53)
(53)
The differential equations coefficients are received as:
 (54)
(54)
 (55)
(55)
 (56)
(56)
 (57)
(57)
 (58)
(58)
 (59)
(59)
2.2. A Three Layers Plane Wall Exposed at One Surface (the Right Surface) to Temperature Oscillations Where the Other Surface Is Maintained at a Relative Zero Temperature (the Left Surface)
The structure problem is shown in Figure 3.
The temperature distribution into every block layer is received as:
![]()
Figure 3. The second building problem, a three layers plane wall exposed on one surface to temperature oscillations (the right surface) while the other surface (the left surface) is maintained at a relative zero temperature.
 (60)
(60)
 (61)
(61)
 (62)
(62)
where:
 (63)
(63)
 (64)
(64)
 (65)
(65)
Six boundary conditions have to be defined:
 (66)
(66)
 (67)
(67)
![]() (68)
(68)
![]() (69)
(69)
![]() (70)
(70)
![]() (71)
(71)
According to what was written earlier, boundary conditions 66 and 71 indicate the temperature constraints on the system external left surface and on the system right external surface. Boundary conditions 67 and 69 indicate the temperatures on the boundary surface between the first and the second slab and on the boundary surface between the second and the third slab, boundary conditions 68 and 70 indicate the heat flux through these surfaces.
As explained in Section 2.1 initial condition is not needed.
By placing the temperatures distributions equations (Equations (60)-(62)) into the boundary conditions (Equations (66)-(71)) the following equations are received:
![]() (72)
(72)
![]() (73)
(73)
![]() (74)
(74)
![]() (75)
(75)
![]()
(76)
![]() (77)
(77)
By defining:
![]() (78)
(78)
![]() (79)
(79)
![]() (80)
(80)
![]() (81)
(81)
![]() (82)
(82)
![]() (83)
(83)
![]() (84)
(84)
![]() (85)
(85)
![]() (86)
(86)
![]() (87)
(87)
![]() (88)
(88)
![]() (89)
(89)
![]() (90)
(90)
![]() (91)
(91)
![]() (92)
(92)
![]() (93)
(93)
![]() (94)
(94)
![]() (95)
(95)
The algebraic coefficients system equations are received as:
![]() (96)
(96)
![]() (97)
(97)
![]() (98)
(98)
![]() (99)
(99)
![]() (100)
(100)
![]() (101)
(101)
The relevant determinants are defined:
![]() (102)
(102)
![]() (103)
(103)
![]() (104)
(104)
![]() (105)
(105)
![]() (106)
(106)
![]() (107)
(107)
![]() (108)
(108)
The differential equations coefficients are received as:
![]() (109)
(109)
![]() (110)
(110)
![]() (111)
(111)
![]() (112)
(112)
![]() (113)
(113)
![]() (114)
(114)
2.3. A Three Layers Plane Wall Exposed at One Surface to Temperature Oscillations and the Other Surface Is Exposed to Different Temperature Oscillation
This stage is a simple superposition of the previous two stages solutions introduced in Sections 2.1 and 2.2.
A physical superposition may be defined as a superposition of structure and not as a superposition of parameters, for example, in this work a physical superposition is a combination of structure solutions introduced in Sections 2.1 and 2.2. A mathematical superposition is a solution combination related to the same parameter, for example a combination of different frequencies![]() ,
, ![]() ,
, ![]() related to the first structure introduced in Section 2.1.
related to the first structure introduced in Section 2.1.
The temperature value ![]() is the sum of the temperature value introduced in Equation (5) and Equation (60), the temperature value
is the sum of the temperature value introduced in Equation (5) and Equation (60), the temperature value ![]() is the sum of the temperature value introduced in Equation (6) and Equation (61), the temperature value
is the sum of the temperature value introduced in Equation (6) and Equation (61), the temperature value ![]() is the sum of the temperature value introduced in Equation (7) and Equation (62). The coefficients values of Equations (5)-(7),
is the sum of the temperature value introduced in Equation (7) and Equation (62). The coefficients values of Equations (5)-(7), ![]() are those introduced in Equations (54)-(59), and The coefficients values
are those introduced in Equations (54)-(59), and The coefficients values ![]() of Equations (60)-(62) are those introduced in Equations (109)-(114).
of Equations (60)-(62) are those introduced in Equations (109)-(114).
3. Results and Discussion
Figure 4 introduces four temperature distributions for those same parameters:![]() ,
, ![]() ,
, ![]() ,
, ![]() ,
, ![]() ,
, ![]() ,
, ![]() ,
, ![]() ,
, ![]() ,
, ![]() ,
,![]() . Every case has its specific amplitudes relation: case a-
. Every case has its specific amplitudes relation: case a-![]() ,
, ![]() , case b-
, case b-![]() ,
, ![]() , case c-
, case c-![]() ,
, ![]() , case d-
, case d-![]() ,
,![]() .
.
Every line plot in Figures 4-6 introduce specific time. The time cycle ![]() according to the smaller frequency was divided by 7, so, each line represent time advance by seventh time cycle.
according to the smaller frequency was divided by 7, so, each line represent time advance by seventh time cycle.
The temperatures boundary conditions introduced in the model are reference temperatures, boundary conditions on the left plane of the left board and boundary condition on the right plane of the right board, so, temperatures negative values are reference temperatures and not absolute values.
Exploring the blue line in the case presented by Figure 4(a) it is shown that the temperature gradient has the same sign along every border between two materials due to the third and fifth boundary conditions (Equations (13), (15), (68), (70)). The same trend is preserved for every line in all cases. The gradients relations in the borders are in reverse trend to the materials thermal conductivities. Comparing between cases presented by Figure 4(b) and Figure 4(c), it is shown that the temperature penetration from the left surface along the right direction in Figure 4(b) is larger than the temperature penetration from the right surface
![]()
Figure 4. Four temperature distributions for the same parameters:![]() ,
, ![]() ,
, ![]() ,
, ![]() ,
, ![]() ,
, ![]() ,
, ![]() ,
, ![]() ,
, ![]() ,
, ![]() ,
,![]() . The amplitudes relations are: case (a)-
. The amplitudes relations are: case (a)-![]() ,
, ![]() , case (b)-
, case (b)-![]() ,
, ![]() , case (c)-
, case (c)-![]() ,
, ![]() , case (d)-
, case (d)-![]() ,
,![]() .
.
![]()
Figure 5. Four temperature distributions for those same parameters:![]() ,
, ![]() ,
, ![]() ,
, ![]() ,
, ![]() ,
, ![]() ,
, ![]() ,
, ![]() ,
, ![]() ,
, ![]() ,
,![]() . Every case has its specific frequencies relation: case (a)-
. Every case has its specific frequencies relation: case (a)-![]() ,
, ![]() , case (b)-
, case (b)-![]() ,
, ![]() , case (c)-
, case (c)-![]() ,
, ![]() , case (d)-
, case (d)-![]() ,
,![]() .
.
![]()
Figure 6. Four temperature distributions for those same parameters:![]() ,
, ![]() ,
, ![]() ,
, ![]() ,
, ![]() ,
, ![]() ,
,![]() . Every case has its specific amplitudes relation: case (a)-
. Every case has its specific amplitudes relation: case (a)-![]() ,
, ![]() ,
, ![]() ,
, ![]() ,
, ![]() ,
, ![]() , case (b)-
, case (b)-![]() ,
, ![]() ,
, ![]() ,
, ![]() ,
, ![]() ,
, ![]() , case (c)-
, case (c)-![]() ,
, ![]() ,
, ![]() ,
, ![]() ,
, ![]() ,
, ![]() , case (d)-
, case (d)-![]() ,
, ![]() ,
, ![]() ,
, ![]() ,
, ![]() ,
,![]() .
.
along the left direction in case Figure 4(c). In case Figure 4(b) the penetration value is along the full system length, while in case Figure 4(c) the penetration value is along about half of the full length. This result is due to the descending conductivities values while going from the left surface to the right surface. Looking at the blue lines in Figure 4(a) and Figure 4(d) it is shown that the temperature values are going down along most of the wall thickness due to the falling conductivities while going up along the last wall thickness due to the temperature value constraint on the right surface. Since the amplitudes are the maximum temperatures values it is better seen in Figure 4(a) that all the temperatures range is decreasing while we move from the left surface to the right surface of the wall or from the larger to the smaller conductivity, but must increase as we move to the forced amplitudes on the right surface. In a location of relative small conductivity the substance has a difficulty to follow the temperature changes and it keeps on a relative small temperature range.
Figure 5 introduces four temperature distributions for those same parameters:![]() ,
, ![]() ,
, ![]() ,
, ![]() ,
, ![]() ,
, ![]() ,
, ![]() ,
, ![]() ,
, ![]() ,
, ![]() ,
,![]() . Every case has its specific frequencies relation: case a-
. Every case has its specific frequencies relation: case a-![]() ,
, ![]() , case b-
, case b-![]() ,
, ![]() , case c-
, case c-![]() ,
, ![]() , case d-
, case d-![]() ,
,![]() .
.
Comparing Figure 4(a), Figure 5(c) and Figure 5(d) reveals that increasing the frequency leads to a smaller temperature penetration from the two directions or from the two surfaces. In Figure 4(a) the temperature penetration is along the full system length, the maximum temperature descending value is around 60%. In Figure 5(c) the temperature penetration value is also along the full length but the maximum temperature descending value is around 84%. In Figure 5(d) there is almost full temperature descending, and penetration is limited. In Figure 5(a) and Figure 5(b) it is shown that on the larger frequency surface the temperature has its extremum value during all the time period while on the smaller frequency surface the temperature is changing gradually from smaller values to maximum values during the time period.
Figure 6 introduces four temperature distributions for those same parameters:![]() ,
, ![]() ,
, ![]() ,
, ![]() ,
, ![]() ,
, ![]() ,
,![]() . Every case has its specific amplitudes relation: case a-
. Every case has its specific amplitudes relation: case a-![]() ,
, ![]() ,
, ![]() ,
, ![]() ,
, ![]() ,
, ![]() , case b-
, case b-![]() ,
, ![]() ,
, ![]() ,
, ![]() ,
, ![]() ,
, ![]() , case c-
, case c-![]() ,
, ![]() ,
, ![]() ,
, ![]() ,
, ![]() ,
, ![]() , case d-
, case d-![]() ,
, ![]() ,
, ![]() ,
, ![]() ,
, ![]() ,
,![]() .
.
In Figure 6(a) it is shown that in the middle area where the thermal conductivity is the largest the temperature is almost uniform or has the minimal gradient value. Since the other conductivities has smaller values the temperature gradients in the left and right areas have higher values and the temperature level is not uniform. In Figure 6(b) the uniform temperature values are in the left area in accordance with the largest conductivity while the middle and right areas with the smaller conductivities has no uniform temperatures values. In Figure 6(c) it is shown that due to the conductivities and diffusivities convergence values in the middle and right walls there is no temperature function break into the original middle and right areas border. In Figure 6(d) it is shown that there is no temperature function break due to all the conductivities convergence, actually all the walls-left, middle and right left area became one isotropic material. Figure 6(c) and Figure 6(d) results are also actually used as an examination tool for the physical model.
It may be stated that as the distance from the constraint surface is increasing (with the same conductivity) or as the thermal conductivity is becoming smaller the relevant surface has difficulty to follow the constraint surface temperature. It is actually shown in all figures. The tracking is seems to break away in some cases while the relevant surface has opposite temperature sign against the temperature constraint sign. It is shown for example in Figure 4(a) along the blue line and along the yellow line, in Figure 4(b) along the blue line and along the yellow line and in Figure 5(b) along the blue line and along the yellow line.
There are cases where there are only heat flux entry into the wall, this is shown for example in Figure 4(a) along the blue line, along the cyan line and along the magenta line, in Figure 4(d) along the blue line and along the cyan line, in Figure 5(b) along the blue line, and in Figure 6(d) along the blue line and along the magenta line. There are cases where there are only heat flux exit out of the wall, this is shown for example in Figure 4(a) along the red line and along the green line, in Figure 4(d) along the red line and along the green line and in Figure 6(d) along the red line and along the green line. In those figures are not seen lines where there are at the same time heat flux entry and heat flux exit. It has to be noticed here that in those figures the constrained frequencies are the same. More explanation may be that this phenomenon is characterized by the absence of phase difference between the two oscillating temperature boundary conditions and the fact that thermal conductivities and thermal diffusivities are steady positive. Cases which at the same time were received heat flux entry exit and heat flux exit, are shown in Figure 5(a) and Figure 5(b) where the constraint frequencies are not the same. It is shown clearly in those figures along the cyan and magenta lines.
By looking for example in a Figure 6(d) it is seen that the center of the distribution temperature lines are extremum points. At those points surfaces the temperature is not changing and no heat flux transfer the surfaces. This is due to the symmetry of this case, there are the same boundary conditions on the external planes of the system, this causes to temperature symmetry plots and to extremum points. A plane along extremum points is adiabatic, so, we got here a solution of two cases, symmetry and adiabatic.
4. Conclusions
1) Increasing the frequency value decreases the temperature penetration length.
2) High frequency value causes steady extremum temperature values on the surface while low frequency value allows gradually temperature changes during the time period.
3) For high thermal conductivity, the temperature will follow the temperature constraint on the surface, for low thermal conductivity, the absolute temperature value will decrease, the constraint on the other surface may increase again the temperature value.
4) In systems that are working with high frequency and demand insulation, it is possible to save material thickness and insulation.
5) Temperature distribution lines where there are at the same time heat flux entry and heat flux exit were not received for the same constrained frequencies.
6) This work introduces actually a method that may be used for calculating any number of planes wall.
7) In order to build this physical model, a physical superposition had to be used.
8) This work problem is parallel to fluids layers between oscillating plates while the velocity vector is coming in place of the scalar temperature value and the kinematic viscosity substitutes the thermal diffusivity.
9) Using complex numbers is an appropriate tool to deal with this work and other parallel problems.
Appendix
We look for a solution to the equation:
![]() (115)
(115)
try:
![]() (116)
(116)
where X is a function of ![]() only and
only and ![]() is a function just of
is a function just of ![]() only.
only.
The relevant derivatives are received as:
![]() (117)
(117)
![]() (118)
(118)
The basic equation will be received as:
![]() (119)
(119)
or:
![]() (120)
(120)
The last connection leads to two differential equations that has to be solved, the first equation is the time equation:
![]() (121)
(121)
The solution of the time differential equation is:
![]() (122)
(122)
where ![]() is a constant coefficient.
is a constant coefficient.
The second equation is the location equation:
![]() (123)
(123)
The solution of the location differential equation is:
![]() (124)
(124)
The full solution is received as:
![]() (125)
(125)
![]() and
and ![]() are constant coefficients.
are constant coefficients.
The full solution may be reduced to two coefficients only, the same notation will be used:
![]()
![]()
So, the full solution will be received as:
![]() (128)
(128)
While using the equality:
![]() (129)
(129)
the full solution will be received as:
![]() (130)
(130)