Effects of Post Eviction Resettlement on Land-Use and Cover Change in Uganda’s Oil Exploration Areas ()
1. Introduction
Changes in the landscape and vegetation of the Albert region of Uganda have been occurring continually during the last 50 years. Changes in the natural character of the land respond to several complex and interdependent factors. However most of the anthropogenic changes are linked to agricultural and forest uses are the most significant, representing 86% of changes to the landscape before petroleum explorations begun. Oil exploration and its related infrastructure occupy a relatively modest amount of land yet it receives a lot of attention as compared to other anthropogenic alterations that are highly disturbing and visible [1] . Beyond exploration areas lies more vertebrate species than any other region on the continent [2] and contains more endemic species of vertebrate than any other region on mainland Africa [3] . The entire Albertine accounts for 39% of Africa’s mammals species, 51% of African Bird species, 19% of its amphibian species, 7 out of the 10 National Parks in Uganda (4) 8 out of 15 forests [4] , 12 Wildlife Reserves, 13 Wild Life Sanctuaries [5] and 5 Community Wild Life Areas. Understanding post eviction migration trajectories and concerns over possible effects of resettlements on wildlife and other ecosystems is essential for informing appropriate management strategies that reduce destruction and conflicts between conservation and human needs.
It is important to quantify the impact of human settlements on the land resources caused by the reciprocal interactions between human and natural resources on the resources; the intention is not to avoid use but how to use by drawing lessons experiences of land evictees. All times, vulnerable people turn to natural resource as coping strategies to their deteriorating situation in desperation, which comes from the realization that no support is expected; hence they turn to local ways to provide answers. This study asked questions of what effects land eviction had on vegetation, what have been the long-term trends in land use where people have moved, how and why do different types of resettlement affect vegetation differently? Are some types of mobility patterns more sensitive to land use change than others?
2. Methodology
2.1. Area of Study
The study was done in the North Western Districts of Buliisa and Hoima in Uganda, Hoima district consists of two counties, eleven sub counties and two town councils. The district is located at geographical coordinates 01˚25'N, 31˚05'E, it has a total land area of 3664.1 km2 (1414.7 sg.mi Figure 1).
Hoima District boarders Kibaale in the south, Kiboga in the East, Masindi in the north-east and Lake Albert in the west forming a boarder with the Democratic Republic of Congo. Population is 349.204 people, 173.004 female and 176.200 male. Buliisa district consists of two sub counties and one town council located at coordinates 02˚11'N, 31˚24'E [6] .
![]()
Figure 1. Location of Buliisa and Hoima Districts in Uganda.
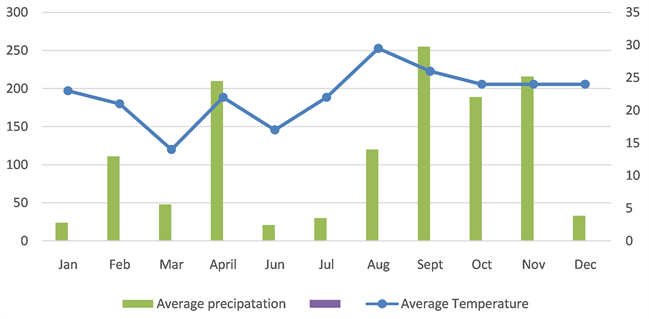
The area receives a bimodal rainfall pattern, mean annual rainfall ranges from 700 - 1000 mm, most of which is received between October and April. Although rain falls throughout the year, its distribution follows a typical East African bimodal pattern, with wetter months from March to May and August to November. Precipitation peaks at 1461 mm while mean monthly maximum temperature is 29.5˚C, remaining fairly constant year-round, with highest temperatures recorded in the driest months of December-February. Temperatures are moderate averaging 18˚C, - 30˚C, with the hottest spot of the lying in the Rift Valley to the West. The Albertine region has a high seasonal variability from season to season, place to place and within and between years, therefore communities have to adapt sometimes too much rainfall falling torrentially or too little. For some seasons precipitation is insufficient causing crop failure.
A wide variety of vegetation ecosystems and species are known to exist in the region; on the mountain and escarpment slopes and in the valleys and flats. The main vegetation ecosystems include montane forests, tropical forests (including riverine and swamp forests), savannah woodlands and grassland mosaics, papyrus and grassland swamps. The extensive network of Celtis-Chrysophylum and riverine forest associated with the numerous rivers that flow from the mountains and highlands on either side of the National Parks and Wildlife Reserves normally draining into the lakes, provide important habitats for chimpanzees, monkeys such as black and white colobus monkeys, and red tailed and blue tailed monkeys, while vervet monkeys and herds of baboons range throughout these conservation areas [7] .
The rich and varied flora of the region provides habitats for an equally wide diversity of animal communities and species. The short and medium grassland savannah is preferred by animals like the Uganda Kob (Kobus kob thomasi) among others. The grasslands have great potential to support a high biomass of wild animals. It is common to find distinct ecosystems being a preference to certain animals. For instance, the Phoenix reclanata swamp forest ecosystems are frequented by elephants and buffaloes, the Capparis tomentosa scrub woodland around the lakes are places frequented by the bushbuck, while tall grasses in depressions are often a favourite habitat for the buffaloes.
The region is very rich in bird species whose habitats range from forest and grassland to wetlands and deltas. The delta area on Lake Albert shores, for example, is a convergence zone between the River Nile that flows through the lake and fifty other tributaries, which flow through shallow papyrus swamps. The swamps are well known for wide variety of water birds, including the Shoebill. The delta species are part of 400 already known in the whole of Albert and Murchison Falls National Park area. The Albertine Rift region also houses approximately 5793 plant species, representing 14 percent of all mainland Africa’s plant species. Of these species, 551 are endemic, and 25 are threatened (3).
Livelihoods are dominated by peasant smallholders farmers, based on crops like bananas, cassava, maize and legumes, along with coffee, cotton, tobacco and tea. Livestock production including cattle, sheep, goats and pigs is also an important agricultural activity and source of livelihood for communities in the Albertine region, where grazing land is mainly communally owned. However, with the increasing population of both humans and livestock, land availability is becoming limited, which has led to overgrazing. Fishing is another prime source of livelihood for people in the Albertine Graben. Previous studies have shown that the region contributes 15% of the total national fish catch.
2.2. Data Collection
The methodological flow chat in Figure 2 indicates the processes of collecting data for this study. Preliminary survey of the study area was conducted before data collection. This was important to generate some ideas about the vegetation,
![]()
Figure 2. The methodological procedure is graphically illustrated in Figure.
historical narratives on the land use before resettlement and to decide on sampling methods such as spacing between transect lines and spacing of plots along the transect lines.
The study employed different methods to generate information on the current status of the woodland, forest product utilization pattern by the community, existing land use types and how these are influenced by resettlement on the woodland. Post settlement land cover/land use assessment, ground survey was conducted using geographic positioning system (GPS), and fed into ArcView GIS software where it is converted into maps of the area. Maps from the three sets were raster transformed and area difference in the various land cover/land use of the pre, during and post-settlement compiled (see Table 1). The topographic map of the study area with the scale of 1:50000 was obtained from Regional Center for Mapping as base map. For each of the periods under study, land cover information was obtained through an object-based classification approach for 60 sample units (5 km _ 5 km size), using ETM Landsat.
For each period, four images (two per year) were selected with the lowest possible cloud cover. Time series changes generated for the pre eviction period (2002-2005), resettlement period (2005-2011) and post settlement period (2011-2015). Where Landsat 7 SLC-off data or high cloud cover was observed for the area, alternative satellite images were acquired from the Landsat archives of USGS. The highest percentage of area covered by cloud and cloud shadow in any image was 5%, and the minimum 0%. Land cover and land use changes were classified as indicated in Table 1.
2.3. Data Analysis
The Landsat ETM + images were visually interpreted using ERDAS IMAGINE 8
![]()
Table 1. Attributes of the satellite imageries.
Source: all metadata downloaded from https://www.usgs.gov/.
as image display software to generate information on land use/land cover types before resettlement. The post-settlement land use/land cover type information was generated by ground-based survey using GPS and fed into ARCView GIS Software to produce the map of current land use/land cover. The change detection started with principal components (PCs), which were calculated from the green, red and near-infrared bands of all the images separately.
The PC gradient was rescaled into values from 0 (definitely non-forest) to 1 (definitely forest). The three time layers with their rescaled values were combined into the same database and difference between the adjacent times layers were calculated. After processing, land cover changes were estimated by assessing the matrices of change (Table 2), for the pre eviction period (2002-2005), resettlement period (2005-2011) and the post eviction period (2011-2015) to determine the land use and land cover change dynamics.
3. Results
3.1. Land Cover change
Figure 3 depicts the spatial and temporal pattern of various land cover types 2002-2015. The quantitative results of forest cover types (areal extent) was estimated and summarized in Table 3. The result reveals that sparse vegetation was dominant land cover type in 2002, this is attributed to the savannah nature of the study area; this accounted for about 39.8% of the total land cover. Meanwhile, non vegetation cover occupied the smallest area of 0.3% pointing to the limited degradation before evicted settled in the area. By 2005 sparse vegetation had reduced to 33.6 of the total area, it further reduced to 33.5 in 2015 within a period of only fifteen years. The study experienced a constant change in high vegetation decrease in an increasing rate in areas used for grazing, cropping and other agro ecosystems.
The pre-settlement image analysis shows that the dense vegetation was intact, and there was neither settlement nor agriculture in it (Figure 2). This was also confirmed through the socio-economic survey that showed all resettlement started in 2005. The post settlement map based on ground survey revealed a decreased in of dense vegetation from 12.3% for the pre eviction period 2002-2005 to 9.9% in the resettlement period (2011-2015) (Table 3). These had been converted into combinations of agriculture and settlement (see Table 3). Higher
![]()
Table 2. Land cover classes used in this study.
![]()
Table 3. Land cover trends before eviction, during resettlement and after resettlement.
*Percent land cover are shown in parentheses.
![]()
Table 4. Land use change 2002-2015.
Source: land use changes from satellite images.
vegetation experienced significant increase from 10.6% to 13.5 and eventually 16% throughout the study period (Table 3). Sparse vegetation areas experienced
constant decrease while none vegetated and moderately vegetated areas remained stable through the study period.
The results further reveal that dense vegetation formed 14% of the total area before resettlement, but sharply reduced to 8% and 9% in 2011 and 2015. These losses were due to high vegetation succession on dense vegetation on sites where vegetation was cleared for fuel wood, grazing and cropping in the resettlement areas; this a resemblance to rising increase on plant life disturbed by humans in its growth for pastures, wood, among other forms of usage. The spatial and temporal patterns of the land cover transitions are shown in Figure 4 (2011- 2015 classified maps). The classified maps further, indicate that forest resource degradation (conversion of dense vegetation) is mostly along Murchison falls National park and further north towards Amuria district. This degradation hotspot should be targeted for protection and or restoration if this trend is to address.
3.2. Land Use Change
The results showed that the resettlement rangelands had undergone substantial changes during the last 10 years. Between 2002 and 2005, we observed a considerable resettlement increase of (39.3) and barelands (5.8%). The results showed a rapid decline in grassland cover (7.7%), woodlands cover (13.3) and grassland cover grassland cover (35.6%). The spatial pattern analysis indicate that the resettlement area was fragmented and characterized by the proliferation of large numbers of patches with a decline in patch index, increased patch density, and irregular shape of patches within a landscape. Local communities’ perceptions indicate that increased human population size, and expansion of cultivation and grazing areas were largely responsible for the observed land use changes in the study area. The areas converted into settlement were higher than agricultural areas indicating the effect of human activities on the woodland will be higher since construction entails general clearance.
The built up areas, roads and bare lands which this study classified as non vegetation areas increased from 30.5% of the total land area before eviction to 39.3% upon resettlement (2005) and further increased to 36.6 by 2015 (Table 4). While no evictees settled into this area after 2011, population increase meant more land areas was converted into settlement and grasslands. The areas under management either for grazing, crop production or recreation reduced from 40.28% of the total vegetation area to 12.52% after resettlement. The classified maps of 2002, 2005, 2011 and 2015 as shown in Figure 3 indicate that resettlement was predominantly along Lake Albert and the northern tip while grasslands were mainly found in of the reserve. The classified map of 2005 reveals an unprecedented increase resettlement and bare lands diffusing westward and northwards. The decline in grasslands and forest between 2002-2005 and 2005-2015 consistent with an increase in resettlements and bare lands within the same period in indication of a higher conversion when people settled into the areas.
Land use and land cover change matrix analysis indicate a constant change conversion, between 2002 and 2005 the period that represented pre eviction, 78.5% of the woodlands experienced changes either partly into croplands or/and settlements. Before evictions, settlements constituted 43.7% of the total land area. This rose to 56.3% between 2005 and 2011, and reduced significantly to 30.3% by 2015 (Table 4)
The difference in land use matrix was meant to see the percentage and what land was converted to. During the resettlement period 23.2% of woodlands turned into settlements while the post resettlement period presents a significant drop in conversions to only 0.3%. Grasslands experienced a drop in conversion from 31.4% to 9.6%. This suggests that with limited interference, land cover is capable of regaining.
3.3. Resource Utilization Patterns
Rural households depend on biomass for their fuel wood sources, all respondents of this study depended on natural forest to cook food. The socio-economic survey revealed that 17.4% of pre resettlement small holder farmers moved into selling fuel wood and charcoal. This number is high when extrapolate to the total number of the settlers and the population potential of the Albertine. The exploitation of the resource may increase in the future when the urban center where the demand is high and emigrants seeking employment from the oil sector. Settlers depend on construction materials harvested from the natural vegetation to construct their shelter. Accordingly, all of the respondents used the natural forests as a source of construction materials. A small minority was also involved in hunting wild animals to for home consumption; others purposely hunt animals to protect their crops from wild animals such as chimpanzee, kobs and wild pigs. They claimed not to have any desire to hunting for wild meat and cultural values. This was mainly reported in areas around Budongo forest, in Rwamukambe and Rwamutonga villages of Hoima district and around river Wambabya and Mugonje in Buliisa.
4. Discussions
This study depicts that land cover in resettlement sites around Hoima and Buliisa district in Uganda having reduced considerably (by 42.4 percent) due to post eviction resettlements. The study has proven that post eviction resettlement has proven to be one of the already known processes or events capable of causing change; it can be categorized into either abrupt or gradual. Abrupt changes are disturbances due to wild fires, high winds, landslides and floods among other factors [8] . The results are in agreement with [9] that land cover declines with a disturbance but regains when the pressure reduces all happening within acceptable time frames. As a rule therefore, post eviction resettlement fits into two main factors at work, first, the temporal dynamics of disturbance and succession are increasingly unlikely to be in synchrony across any area as the size of that area increases hence the variations in different cover classes. That is, different areas will be at different developmental stages due to different local histories, particularly their times since last major disturbance. This fact interacts with inherent environmental variability (e.g. in soils, climate, topography, etc.), which is also a function of area. Environmental variability constrains the suite of species that can occupy a given area, and the two factors together interact to create a mosaic of vegetation conditions across the landscape. There is always heterogeneity, although its scale and intensity will vary widely [10] . For example, higher vegetation is homogeneous when compared to the same disturbance as sparse vegetation.
Land use change may lead to removal of topsoil by erosion causing loss of fertility and consequently loss of productivity. This is in line with [11] and [12] that states resettlement into new areas cause considerable damage of natural resource base. Studies by [13] stated that earlier settlements around Mountain Elgon caused considerable. Removal of vegetation cover actually threatens the very purpose of resettlement which is achievement of food security and shelter. Post use effects of increased runoff causing flooding and landslides have been documented in areas of Bududa where forest cover was removed causing harmful effects to agricultural fields, settlement areas, grazing fields and other infrastructures [14] . Changes in land cover further threatens ecological systems as removal of land cover escalates evaporation and rainfall water that recharges ground water aquifer is lost through runoff.
Much of the vegetation has already been cleared for agriculture or for logging, especially in densely populated Kibaale districts but large areas of forest still remain in forest reserves and at low altitudes in ranges including. Therefore clearance for settlements cultivation and grazing threatens the ecological role of maintaining microclimate that could increase the aridity and desertification to an area already with higher temperature.
Post eviction resettlement is a threat to the habitat important wild animals causing their migration and eventual loss. Land use change from woodlands to grasslands alters the ecosystem functions that support flora and fauna only endemic to this unique area [15] . As results plants and animal species face difficulties to survive in the new changes leading to migration or mortality and eventually may lead to habitat extinction.
Before evictions (2002) woodlands were the dominant land covers however these had been over taken by settlements after evictions. The rise in settlements coincided with the reduction in woodlands and grasslands. Studies have attributed this to the resettlement effect [16] which is defined as the “loss of physical and non-physical assets, including homes, communities, productive land, income-earning assets and sources, subsistence, resources, cultural sites, social structures, networks and ties, cultural identity, and mutual help mechanisms”. To adapt easily evictees opened up new areas for purposes of ensuring food security. Human-landscape relationships dictate that households rely on resources provided in forests and wetlands for survival. The means of using resources is driven by a combination of direct resource utilization and perceptions about the interactions themselves.
Vegetation cover varied between grazing and cultivated areas, this implied that pastoralists conserve native plant species better than small holder farmers. The explanation is obvious that pastoralists will conserve any palatable species whether planted or weed for their livestock. This study indicates that number of species and families recorded in the farmland and settlement area are lower than that of the woodlands with lower human interference. Resettlement therefore change in species composition of the trees, which could be continuous since the population of the settlers is growing fast.
The absence of a government’s manual for the resettlement indicates that resettlement is voluntary and uncontrolled. Environmental Impact Assessment (EIA) were carried out in oil exploration areas but not in resettlement areas [17] . Impact assessment was never carried out on the settlers’ activities in order to predict their positive and negative impacts on the environment, and on social and economic conditions so as to strengthen the positive and, when possible avoid (or at least minimize) the negative consequences [18] . It is clear that all economic and social development activities carried out in settlement areas were never based on a coherent environmental management plan that enhances the quality of the environment and maximizes its productivity sustainably. There is no tress of care that was given to fragile natural ecosystems that evictees settled in. studies by [19] indicate that pre resettlement EIA guide utilization and management and therefore necessities set out in the guidelines before areas of virgin woodlands are cleared for settlement and agriculture.
Therefore, a clear balance need to be struck between rising demand for environmental resources by displaced households and the national interest of conservation. It is important to solve needs of food and shelter for displaced households. A win-win situation can emerge from a streamlined user guide. Such a guide would allow settlers meet their on-spot needs such as fuel wood, grazing and land conversion for agriculture if limits are given. It is important to note however, that having settled in new environments households gradually device ways of moving from land degradation towards sustainable land management through the development of new mechanisms to tackle land degradation.
5. Conclusions
This study showed that post eviction resettlement has impacts on land use and land cover change. The failure to plan and guide post eviction resettlements led to establishment of resettlement sites in areas that were not listed as potential sites to host settlers and fragile areas, which could not support them. In absence of livelihood and relief support, settlers turned to production of charcoal and fuel wood as sources of income which facilitates the depletion of the woodland. The high number of settlers has an implication on the future demand for natural resources making the problem more complex. Having proved that post eviction induced resettlements can yield potential environmental effects to resettled areas, it is important to plan and implement other means of additional source of income instead to abate vegetation clearance and hence rescue the woodland.
Uganda Wildlife authority and other stakeholders should also take this opportunity to create better awareness among evictee community of the potential benefits from conserving and sustainably utilizing the resource. It is important to maintain population growth at acceptable levels to create a balance with natural resources. Rehabilitation of degraded areas should also be emphasized to better outputs rather than forcing people out without alternative resettlements. Well-planned pre eviction resettlement schemes could result in better land use and land cover outputs with minimum environmental impacts.