Oxidation and Complexation-Based Spectrophotometric Methods for Sensitive Determination of Tartrazine E102 in Some Commercial Food Samples ()
Received 6 March 2016; accepted 25 April 2016; published 28 April 2016

1. Introduction
Food dyes are often added to foodstuffs and drinks in order to supply, intensify or restore their colour to create the desired coloured appearance [1] . Synthetic dyes are widely used as they show several advantages compared with natural dyes such as high stability to light, oxygen and pH, colour uniformity, low microbiological contamination and relatively lower production costs. Tartrazine is a synthetic organic food dye that can be found in common food products such as bakery products, dairy products, candies, and beverages. According to the limitations of European Union [EU] and Federal Food, Drug and Cosmetic Act [2] , the presence and content of Tz dye must be controlled in food products due to their potential harmfulness to human beings [3] . Also it appears to cause the most allergic and intolerance reaction of all the azo dyes, particularly among asthmatics and those with an aspirin intolerance [4] [5] . Therefore the determination of tartrazine in commercial food products is very important. Until now, different methods such as chromatography [6] - [12] , electroanalytical methods [13] - [15] and spectrophotometry [16] - [24] , have been reported for the determination of tartrazine. However, some of these methods are not suitable for routine monitoring as they are time consuming, complicated and have poor sensitivity and selectivity. To the best of our knowledge, no spectrophotometer methods based on complexation with copper have been reported for the quantification of Tz. This paper describes the development of a simple, and rapid two spectrophotometric methods for the assay of Tz in food samples. The first method is based on oxidation of tartrazine by Cu(II) in acetate-acetic acid medium (pH = 5.9) at 30˚C followed by complex formation. The other method is based on oxidation of Tz with alkaline KMnO4 under optimum conditions.
2. Experimental
2.1. Apparatus
An evolution 300 UV-Vis spectrophotometer with 1.0 cm matched cells fitted with vision pro software of Thermo Electronic Corporation (Cambridge, U.K.) was used for electronic spectral measurements. pH measurements were made with Jenway 3040 ion analyzer-pH meter, equipped with Jenway 924,005 combined glass electrode.
2.2. Chemicals
All chemicals were of analytical reagent grade. Deionized water was used to prepare all solutions. The tartrazine dye (E102) was supplied from Alfa Aesar (Germany). Stock standard solution containing 2.672 g・L−1 of the dye was prepared in deionized water. The working solutions were prepared daily by appropriate dilution. A 5 × 10⁻³ mol・L−1 of copper nitrate was prepared by dissolving the required amount in deionized water and standardized complexmetrically with EDTA [25] . The ionic strength of the solutions was maintained at a constant value of I = 0.1 mol・L−1 (NaClO4). Acetic acid (0.2 mol・L−1) sodium acetate (0.2 mol・L−1) buffer (pH = 5.9) was prepared in 100 ml volumetric flask. Potassium permanganate (Merck, Germany) 1 × 10⁻² mol・L−1 was prepared in deionized water.
2.3. Preparation of Real Samples
Powdered gelatin samples (Lemon, pineapple, green apple, apricot, banana and peach) and powdered drinks (apple, orange and tamarind) were bought from local supermarket in Assiut city (Egypt). These samples contained sugars, fumaric and citric acids, beef gelatin, artificial flavour, colour (E102), tricalcium phosphate and aspartame. Each gelatin or drink samples were weighed exactly (about 1 g) and dissolved in 50 ml of deionized water. Then each solution was centrifuged (10 min, 3500 rpm) to remove the insoluble particles. The filtrate was collected in 100 ml volumetric flask and diluted to the mark with deionized water. For determination of Tz in the above real samples, 0.2 ml of sample solution was used and analyzed according to method I. Finally, the Tz content in food samples were determined using the calibration equation and standard addition calibration curves procedure.
2.4. General Procedures
2.4.1. Method I (Complexation Reaction)
Into a 10 ml volumetric flasks, transfer a suitable aliquot of standard solution in deionized water containing up to 181.6 µg of tartrazine and 4 ml of 2 × 10⁻³ mol・L−1 of Cu(II) solution. After mixing, the mixture was buffered to pH 5.9 with acetic acid-acetate buffer. Dilute the resulting solution to volume with deionized water and measure the absorbance at 332 nm, 303 K by using 1.0 cm quartz cell against a similarly prepared blank of the same pH. The calibration graph was constructed by plotting absorbance vs. Tz concentration.
2.4.2. Method II (Oxidation with KMnO4)
Standard solutions in deionized water containing 16.031 - 187.03 µg・ml−1 Tz were transferred into individual 10 ml calibrated flasks, 4.0 ml of 1.0 mol・L−1 sodium hydroxide solution was added followed by 2.0 ml of 1 × 10⁻² mol・L−1 KMnO4 solution and it was diluted to the final volume with deionized water. After 60 min, the absorbance was measured at 610 nm against reagent blank treated similarly.
2.5. Interference from Matrix
Samples were prepared by mixing 0.5344 mg of Tz (method I) or 0.267 mg (in case of method II) with various amounts of common matrix cations, anions, sugar, gelatin, aspartame and dyes such as sunset yellow, and allura red. The procedure was continued as described under general procedures.
2.6. Determination of the Thermodynamic Parameters
The decomposition of stability constant into its enthalpy change (DH), Gibbs free energy change (DG) and entropic (DS) contributions is of fundamental importance to understand the various factors that may influence coordination [26] [27] . Enthalpy changes due to coordination reactions can always be obtained from the determination of stability constants at different temperatures according to the Van’t Hoff [28] relationship (1, 2):
 (1)
(1)
 (2)
(2)
where R is ideal gas constant (8.314 JK−1・mol−1), Ki is the stability constant of the complex and T is the absolute temperature in Kelvin (K).
3. Results and Discussion
3.1. Acid-Base Equilibria of Tartrazine
The absorption spectra of tartrazine salt (HL3−) solution (5 × 10⁻⁵ mo・L−1) in aqueous medium at I = 0.1 mol・L−1 (NaClO4), 25˚C were recorded at various pH values (Figure 1). The food additive tartrazine salt (HL3−) yields four acid―base forms in solution of pH 0.86 - 12.4, H5L+, H2L2−, HL3− and L4− exhibiting the absorption maxima at 440, 430, 420 and 400 nm. The protonated acid form H5L+ at azo-nitrogen (lmax = 440 nm) predominates in strongly acidic medium (pH < 3). The solution spectra of food colorant display a symmetrical and highly intense band (lmax = 430 nm) at pH 3.2 - 4.3 corresponding to the protonated form of the dye salt (H2L2−). On decreasing, the acidity of the medium (4.2 - 6.5), a blue shift of the latter band at 420 nm is obtained resulting from dissociation of protonated nitrogen azo group (HL3−). The electronic spectra of Tz in aqueous medium within pH 7.2 - 10.4 exhibit a broad band at 400 nm with a shoulder at 425 nm corresponding to tautomeric equilibria of monoanionic form of tartrazine salt (L4−), Scheme 1. The absorbance versus pH graph were interpreted [29] assuming that a particular equilibrium established under selected conditions. Under our experimental condition pKa1 [H2L−2/HL−3 (-HN=N-)] = 5.15 ± 0.10, pKa2 [HL−3/L−4 (OH)] = 9.25 ± 0.16.
3.2. Absorption Spectra of Tartrazine Reaction Products
Tartrazine likes Sudan dyes possess two reducible groups, a nitrogen-nitrogen double bond and a phenol group [30] . A reduction process, which corresponds to a spontaneous auto-reduction of the Cu2+ into Cu+, was observed in cases of complexation of Cu2+ ions with sudan(I) [31] and sudan(II) [32] . Because of these features of sudan dyes, tartrazine is considered as chromogenic chelating and redox sensitive agent reacting with copper(II) to form Cu+-Tz complex under optimum conditions. On the basis of redox sensitivity in the Cu(II)-tartrazine
![]()
Figure 1. Absorption spectra of 5 × 10⁻⁵ mol・L−1 tartrazine in aqueous medium, I = 0.1 mol・L-1 (NaClO4), 25˚C at different pH values; 1, pH = 0.86; 2, pH = 0.9; 3, pH = 1.0; 4, pH 1.17; 5, pH = 1.6; 6, pH = 2.26; 7, pH = 2.73; 8, pH = 3.29; 9, pH = 3.73; 10, pH = 4.21; 11, pH = 5.7; 12, pH = 6.48; 13, pH = 7.19; 14, pH = 8.7; 15, pH = 9.2; 16, pH = 9.97; 17, pH = 10.58; 18, pH = 11.12; 19, pH = 12.83.
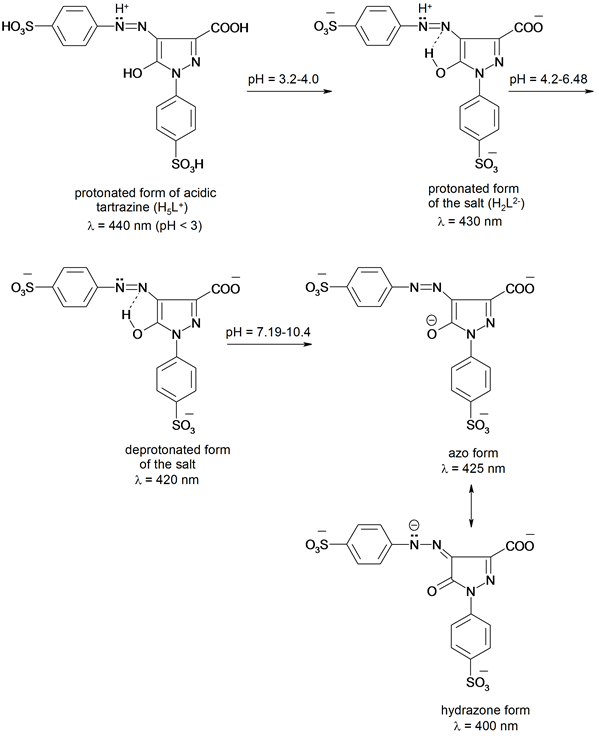
Scheme 1. Protonation process of tartrazine.
interaction in aqueous medium at I = 0.1 mol・L−1 (NaClO4), pH = 5.9, 30˚C, solution spectrum shows an absorption band with a maximum at 332 nm corresponding to Cu(I)-Tz complex (MLCT) (Figure 2(a)).
Figure 2(b) shows the absorption spectrum obtained for alkaline KMnO4 solution (lmax = 530 nm). With addition of tartrazine solution, an absorption spectrum with two absorption bands at 390, 410 (double headed) and 610 nm was obtained. The latter band is attributed to the formation of manganate ion as a result of the oxidation of tartrazine with KMnO4 in alkaline medium [33] [34] and the highly intense double headed band is related to Tz oxidized form.
3.3. Complexation Equilibria of Cu(II) with Tartrazine at Different Temperatures
The complexation equilibria of Cu2+ with Tz were investigated at I = 0.1 mol・L−1 (NaClO4) in aqueous medium over the pH range 3.5 - 10 at 293, 303, 313 and 323 K. The solution spectra were recorded in presence of an excess of the metal ion and in equimolar solutions. The absorption spectra for both metal/Tz ratios at various pH are analogous at the same temperature and exhibit an absorption band at 332 nm.
The absorbance versus pH graphs for the above solutions at different temperatures show the range of complex
![]()
![]()
Figure 2. (a) Absorption spectra of Tz-Cu(II) (pH = 5.9), I = 0.1 mol・L-1 (1) Tz 2 × 10⁻⁵ mol・L-1; (2) Cu(II) 2 × 10⁻⁴ mol・L-1; (3) 1:1 Tz-Cu(II); [Cu2+] = [Tz] = 2 × 10⁻⁴ mol・L-1. (b) Absorption spectra of Tz-KMnO4 reaction (in alkaline medium), (1) Tz 5 × 10⁻⁵ mol・L-1; (2) alkaline KMnO4 (5 × 10⁻⁴ mol・L-1); (3) Tz-KMnO4 reaction product [Tz] = 7 × 10⁻⁵ mol・L-1, [KMnO4] = 2 × 10⁻³ mol・L-1, [NaOH] = 0.4 mol・L-1.
formation (3.0 - 6.5) and existence of one complex equilibria within the pH range studied (Figure 3(a)). All graphs exhibit a similar descending branch above pH 6.5 which is due to the hydrolysis of the complexed Tz. The absorbance versus pH graphs for copper-Tz system at different temperatures were interpreted using relations derived earlier by Sommer et al. [35] , Idriss et al. [36] [37] and Saleh et al. [34] . The following Equations (3, 4) were valid for equimolar and solutions with an excess of metal ion respectively:
 (3)
(3)
 (4)
(4)
All symbols have their usual meanings. The logarithmic transformation are linear with a slope of q = 2, indicating the release of two protons during complexation and an intercept including K*. By considering the values of the dissociation constants of Tz under our experimental conditions, one can assume the following complexation equilibria with Cu(II) in the pH range 3.0 - 6.5.
 (A)
(A)
The mean equilibrium constant K* was determined at different temperatures by considering equilibrium A. the stability constant of Cu(I) complex is related to the equilibrium constant K* by the expression . The calculated values of log K1 for the complex at 293, 303, 313 and 323 K are given in Table 1. The proposed binding model of Tz-copper complex is shown below.
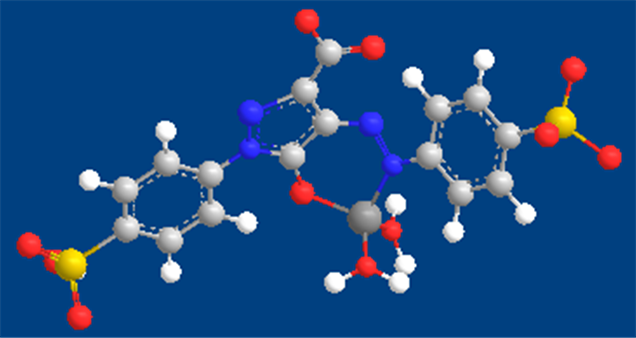
The proposed binding model of Tz with copper(I).
3.4. Thermodynamic Functions of Tartrazine-Copper(II) Reaction
According to Van’t Hoff equation the values of overall thermodynamic parameters DG, DH and DS accompanying complex formation have been determined (Figure 3(b)). The DH and DS values can then be considered as a sum of three contributions, Cu(II)-Tz redox reaction, release of H2O molecules from octahedral copper(II) ions and metal-ligand bond formation. From Table 1, the -ve value of DG for the complexation process Cu(I)-Tz suggests a spontaneous nature of such process [38] . The +ve value of DH means that this reaction is endothermic favourable at high temperature. The +ve value of DS for the complexation process confirm that the Cu(I)-Tz complex formation is entropically favourable [39] .
![]()
Table 1. Stability constants at different temperatures and thermodynamic parameters DG, DH and DS of copper(I)-Tz complex.
![]() (a)
(a)![]() (b)
(b)
Figure 3. (a) Absorbance vs pH graph for Tz-Cu(I) complex in aqueous medium, I = 0.1 mol・L-1 (NaClO4), lmax = 332 nm at various temperature, (1 - 4) [Tz] = 2 × 10⁻⁴ mol・L-1, [Cu2+] = 6 × 10⁻⁴ mol・L-1 at 293, 303, 313, and 323 K respectively; (5) [Tz] = [Cu2+] = 2 × 10⁻⁴ mol・L-1 at 313 K. (b) Van’t Hoff plot of log K1 of Tz-Cu(I) complex against 1/T.
3.5. Optimization of Variables
3.5.1. Complexation Method
In order to optimize the condition we have investigated a number of parameters such as pH, reagent concentration, the temperature and time.
Effect of pH
With other conditions fixed the effect of pH on absorbance of Cu(I)-Tz complex at lmax = 332 nm was investigated from pH 3.5 - 10.0. From Figure 3(a), the quantitative determination of Tz was achieved at pH = 5.9.
In order to determine the best buffer solution at pH = 5.9, several buffer systems at isomolar concentration of 0.2 mol・L−1 were studied. The best analytical sensitivity was obtained in presence of acetate-acetic acid buffer. Next, the effect of buffer volume on analytical sensitivity was also studied in the range of 0.2 - 2.5 ml, and the maximum absorbance was obtained at a buffer volume of 0.5 ml. the results are shown in Figure 4(a).
Effect of Copper Concentration
The effect of copper(II) concentration on the absorbance of the complex was investigated by varying the reagent concentration under the optimum conditions ([Tz] = 2 × 10⁻⁴ mol・L−1), pH = 5.9, T = 293 K. It is clear from Figure 4(a) that the maximum absorbance was attained with 3.0 ml; above this volume, the absorbance remained unchanged. To ensure the complete complexation for determination of tartrazine, 4.0 ml Cu(II) was used.
Effect of Temperature and Time
The effect of temperature on the absorbance of the formed complex was studied in aqueous medium at pH = 5.9 in the range 393 - 323 K, keeping constant concentration of Tz (2.0 × 10⁻⁴ mol・L−1) and copper (8.0 × 10⁻⁴ mol・L−1). The maximum absorbance was obtained at 303 K (Figure 4(b)). Under optimum conditions, the reaction time was determined by following the absorbance of the complex at different time intervals. Complete complex formation was attained after 5 min. at 303 K.
![]()
![]()
![]()
Figure 4. (a) Reaction conditions for complexation reaction at 293 K, [Tz] = 2 × 10⁻⁴ mol・L-1, lmax = 332 nm, pH = 5.9. (1) Effect of different volumes of 2 × 10⁻³ mol・L-1 Cu2+ on absorbance of Cu+-Tz3- complex, acetate buffer volume = 1 ml. (2) Effect of different acetate buffer volume on absorbance of Cu-Tz complex, [Cu2+] = 8 × 10⁻⁴ mol・L-1. (b) Effect of absolute temperature on absorbance of Tz complex, [Tz] = 2 × 10⁻⁴ mol・L-1, [Cu2+] = 8 × 10⁻⁴ mol・L-1; buffer volume = 0.5 ml. (c) Reaction conditions for oxidation reaction of Tz with alkaline KMnO4 at 293 K, [Tz = 1 × 10⁻⁴ mol・L-1]. 1) Effect of KMnO4 (1 × 10⁻² mol・L-1) (by volume), [NaOH] = 0.4 mol・L-1, t = 60 min. 2) Effect of NaOH (1.0 mol・L-1) (by volume), [KMnO4] = 2 × 10⁻³ mol・L-1, t = 60 min.
3.5.2. KMnO4 Oxidation Method
Redox reactions have been used as the basis for the development of simple and sensitive spectrophotometric methods for the determination of many compounds [33] [40] . Tartrazine reacts with KMnO4 in strongly alkaline medium producing green manganate (lmax = 610 nm) (Figure 2(b)). During the current study the produced colour intensity increased gradually with time to reach maximum after 60 min and was stable for at least 24 h. The factors affecting the formation of manganate ions were further studied and optimized.
Effect of NaOH and KMnO4
The dependence of redox reaction on the volume of NaOH (1.0 mol・L−1) was investigated in the range 1.0 - 5.0 ml. The results show that maximum absorbance was obtained using 4.0 ml of 1.0 mol・L−1 NaOH with no significant changes indicated as the volume was increased (Figure 4(c)). Under optimum conditions, the dependence of redox reaction on the volume of KMnO4 was investigated over the range from 0.5 - 3.0 ml (1 × 10⁻² mol・L−1). The results show that the maximum absorbance was obtained using 2.0 ml of 1 × 10⁻² mol・L−1 KMnO4 (Figure 4(c)).
3.5.3. Stoichiometry of Tartrazine Reactions
The stoichiometryt of tartrazine reaction with Cu(II) or KMnO4 was established by the continuous variation method [34] [41] . The solutions having Co = CR + CTz = 6.0 × 10⁻⁴ mol・L−1 at pH 5.9 or > 11.0. The plot of absorbance versus mole fraction of reagent at lmax 332 or 610 nm, reveals the formation of 1:1 (Tz:copper) complex and 1:2 (Tz:KMnO4).
3.6. Quantification
3.6.1. Validation of the Proposed Methods
For our two methods (I, II) the ranges of linearity of absorbance as a function of food additive Tz concentration provide a satisfactory measure of the sensitivity of the method. Under the optimum conditions the absorbance of the complex (Figure 5) or manganate obeys Beer’s law in Tz concentration range of 10.69 - 85.50 or 5.34 - 34.12 µg・ml−1 respectively. For the two proposed methods (I, II), the molar absorptivity and Sandell sensitivity [42] values are 0.361 × 10⁴, 0.80 × 10⁴ L・mol−1・cm−1 and 0.1480, 0.0668 µg・cm−2 respectively. The regression equations, correlation coefficient, limit of detection, and limit of quantification [43] were also calculated and summarized in Table 2.
3.6.2. Accuracy and Precision
The accuracy and precision of the proposed spectrophotometric methods were determined at three different concentration levels of additive food colour-Tz by analyzing five replicate samples of each concentration. The relative standard deviation (R.S.D%) obtained for the analytical results did not exceed 2% (Table 3) which proved a high reproducibility of the results and precision of the methods.
![]()
Figure 5. Absorption spectra of tartrazine-copper complex, pH = 5.9 (acetate buffer), tartrazine concentration range 2 × 10⁻⁵ (1) to 2.0 × 10⁻⁴ mol・L-1 (9) with regular successive additions in presence of 8.0 × 10⁻⁴ mol・L-1Cu(II) at 303 K.
![]()
Table 2. Summary of optical and regression characteristic of the proposed methods for determination of tartrazine.
![]()
Table 3. Summary of accuracy and precision of the proposed methods for determination of tartrazine in pure form.
a) Mean for 5 independed analysis. b) C.L., confidence limit at 95% confidence level at 4 degree of freedom (t = 2.776).
3.6.3. Intraday and Interday Precision and Accuracy
Under optimum conditions the intraday precision was carried out for our procedures through replicate analysis (n = 5) for Tz corresponding to 32.062, 53.437, 64.124 µg・ml−1 (method I) and 16.031, 26.719, 32.062 µg・ml−1 (method II). The interday precision was also evaluated through replicate analysis of the standard Tz for three consecutive days at the same concentration levels as in within day precision. The results of these assays are reported in Table 3. For intraday and interday precision, the recovery and RSD values were in the range of 96.89% - 101.04% and 0.25% to 0.39% respectively. The green manganate ions produced from Tz-KMnO4 reaction in alkaline medium was stable only for 24 hours.
3.6.4. Analytical Recovery and Matrix Effects
To investigate the selectivity of the proposed methods, the effect of various substances on the determination of Tz (53.437 and 26.719 mg・L−1) for method I and II respectively was tested under optimum conditions. Several representative potential interferences such as inorganic cations, anions, molecular species and dyes were investigated individually for their effect on Tz recovery. Tolerance limits were defined by the concentration of interferents which caused on <5% error in the determination of Tz. The obtained mean recoveries and standard deviation ranged between 99.0% - 96.0% and ± 1.0 - 2.0 respectively are shown in Table 4. These results proved the accuracy of the proposed methods and absence of interference from common matrix. The accuracy of our method was also checked by studying the influence of various dyes on the recovery of Tz. Tartrazine determination
![]()
Table 4. Matrix effects on the recovery of tartrazine (E = 102).
![]()
Table 5. Statistical analysis of results obtained by the complexation method for tartrazine in powdered drink samples.
a) From local markets of Assiut city, Egypt. b) Theoretical t-value (u = 4) and F-value (u = 4.4) at 95% confidence level are 2.78 and 6.39.
![]()
Table 6. Statistical analysis of results obtained by the complexation method for tartrazine in powdered gelatin.
a) From local markets of Assiut city, Egypt. b) Theoretical t-value (u = 4) and F-value (u = 4.4) at 95% confidence level are 2.78 and 6.39.
was possible in presence of 0.045 mg/10 ml sunset yellow (0.035 mg in case of method II), 0.05 mg Allura red (0.04 mg in case of method II) and 0.061 mg Tropaeolin 000 (0.045 mg in case of method II). This was attributed to the great sensitivity of the methods that necessitated dilution for the food sample and consequently the matrix beyond their interference capability.
3.7. Applications
The complexation method was successfully applied to the determination of Tz in two different commercial food products (powered drink and powdered gelatin samples). To investigate the applicability of the proposed method, recovery experiments were performed using multiple points standard addition method. For this purpose, a known amount of Tz was spiked to the formulated preparations and the total amount of the dye was estimated. The results are summarized in Table 5 and Table 6. The t- and F-tests indicated no significant differences between the calculated and theoretical values of both the proposed and the reported methods [24] [44] at 95% confidence level, which indicate good precision and accuracy in the analysis of investigated Tz in commercial food products.
4. Conclusion
In this paper, two spectrophotometric methods for the determination of Tz with Cu(II) and KMnO4 were proposed and successfully validated. The methods were based on the redox reaction with Cu(II) followed by complex formation and oxidation with strongly alkaline KMnO4. The positive value of change in enthalpy (DH) for complexation reaction suggested that the reaction was endothermic favourable at high temperature. The negative value of free energy change indicated that copper-Tz redox reaction, dissociation of the ligand and complexation process were spontaneous. It was found that the complexation method was selective and sensitive enough to enable the determination of lower amounts of Tz and could be applied to the food quality control.
NOTES
![]()
*Corresponding author.