Ethnic Minorities and Social Inequities: A Diagnostic Assessment about the Mexican Indigenous Population ()
1. Introduction
The ethnicity consists in identifying itself with an ethnic group and feel part of it, excluding themselves from other groups in virtue of such affiliation, in a way that the other ethnic groups are distinguished by sharing cultural similarities among their members, such as beliefs, values, costumes, habits, norms, language, religion, history, kinship, geography and or race, and for its differences with other groups [1] . These cultural similarities form the ethnic identities, marking behavioral differences which frequently are interpreted through the prejudgment based on stereotypes [2] .
One of the ethnic groups that have historically been considered as a minority in Mexico, and in a global level, is made up by the indigenous population, who actually constitute the 6.7% of the national population [3] . None the less, his condition of minority does not limit itself to the density of population that they present, in the contrary, this rests in the place of such population occupied in the social, political, and cultural areas of the country.
As such, this paper analyzes the social inequities that live the Mexican indigenous population in their minority quality, focusing particularly in the issue of health, with the understanding that the conditions that they have in such areas integrate and show what occurs in other phases of social life. Like the part of the background of the subject, it was found that the actual interest in the inequity in health it has been increased by two key elements [4] : 1) by the notable increase of the social inequalities in between countries, in the center of them, between regions, groups and social strata, the which is expressed in the health conditions casting out notable differences in the sanitary indicators and 2) by the verification that in all of the societies the health conditions have the same form of the social structure, in a way that if it lowers one level of such structure, the prevalence of the sicknesses and the sanitary problems increase.
In this logic, during 2004, the Pan-American Health Organization (PAHO) created the Unit of Genre and Ethnicity with the intention of facilitating the integration of the dimensions of genre and ethnicity as social determinant factors of the equity in health [5] . These factors [2] , besides the age, sexual orientation, formed a new paradigm to explain the social stratification and the inequality in health further more than the income and the educational level (such as use to be done before), signaling that the ethnic identities can have a positive or negative impact in the health, as they determine behaviors of differentiated risk from the rest of the population because of the geographical location of their communities or by their believes and immersion in the labor market, besides favoring mechanisms of institutional exclusion and individual. So that it begins from the idea that in the cultural identity, the affiliation or relevance to determined social groups, generally minorities, determine the access that they have to the health services, such as the quality of them. This idea is not without merit, since other studies have demonstrated that the condition of belonging to an indigenous community, both globally and in Mexico, involves conditions of inequality and inequity both in general and in the field of health [6] .
In consequence, and with the intention to determine if the gaps exist in the situation of health of the Mexican indigenous communities, in contrast with the non-indigenus population, an elaboration was created in an analysis about the situation of health of the Mexican indigenous community, the same integrates the guidelines of the PAHO for the Diagnostic of the situation in health with an ethnic focus [2] . Must be mentioned that in such focus, the equality in health constitutes the central notion of the analysis, such that its operationalization allows reflecting such gaps that exist in the health between distinct groups, gaps that if proved carry generally a strong weight of social injustice, in other words, of inequity. It deals then from a transdiciplinary focus conceived addresses the inequity in health since the intersection of anthropology, the sociology, the epidemiology, the demographic, the social psychology, the social medicine, and public health as a result of a social construction that even though it can be explained it is not justifiable. The results of this type of analysis help to identify minority population groups that are not being benefited with the health policies, allowing their redesign to reach such populations, and, to sum it up, are utilized to base public policy framed in multiculturalism, that promotes better conditions in the situation of health and in the human development of the most vulnerable groups for their condition of ethnic origin.
For the prior, and from the remarks about the incidence of the ethnicity in the situation in health of the indigenous population, the particular objective of the present job was to identify and categorize the differences in health that live the Mexican indigenous population in respect to the national non-indigenous population. The importance of an analysis such as the one here presented eradicates on contributing relevant comparative data that allows dimension of the problem expressed in the middle of a national setting that lacks the specific comparative data, since the sanitary statistics of the country do not count with the information mentioned. As such, although since 2001 a constitutional reform was produced that promoted the recognition of the indigenous population as subjects with rights, deriving in the establishment of heath as a category of backwardness and inequality, to the date studies that allow to give dimension and categorize such lack have not been realized, at the same time does not allow the decision makers to use elements to fight the gaps in health through the foundation, design, and execution of public sanitary policies with an ethnic focus.
2. Methodology
The present papers constitutes a study of quantitative focus and exploratory reach, in all that describes, compares, and establishes the magnitude of the differences of the health situation in the Mexican indigenous population and the national non-indigenous population. As such, as the PAHO methodology [2] indicates for the elaboration of the Diagnostic of the situation in health with an ethnic focus, it was begun taking as a base a groups of ethnic origin and in a group of reference, for our approach of the first groups it was constituted for the Mexican indigenous population, while the second was integrated for the non-indigenous population of the country. Preciously disaggregated information was searched, both qualitative and quantitative, for the three axes thematic to the analysis that are: the general conditions of life, the state of health and the services of health, the same dimensions that are considered in the stratification derived by ethnicity. The variables and indicators selected were grouped by thematic axes, for the first one multidimensional poverty, the human development and marginalization were considered; for the second morbidity, mortality and the life expectancy at birth; while for the third health coverage, quality and cultural commitment to the health services were considered. Finally, the information was analyzed and interpreted, generating the evidence about the differences in health and proceeding to the interpretation of the results, the same that were contextualized in different slopes.
Whereas in the first stage of work it was warned that there lacked the indicators and the general and the specific records, about the conditions of health that the national indigenous population lives, choosing to complete the work through the proposal of the PAHO [2] for cases such ours (and others were the information is not reliable or is not actualized), same that consists in utilizing a geographical proxy to make an indirect but valuable calculation, the which results in selecting the territorial units that make up the majority ethnic population studies and compared with the capital of the country, the first ones are called territorial units (before UT) and are numbered from greatest to lesser, the second is called, as territorial reference unit (before UTR). As such, with the values not segregated that presents a determined indicator of health, the absolute difference, and the relative difference is established that they are just the differences that analyze in order to move towards health inequities. The absolute difference is acquired by subtracting the value of the UT to the UTR utilizing indicators expressed in percentages while the relative difference is the result of dividing the value of the UT by the UTR, utilizing indicators expressed in units.
As mentioned before, for effects of this diagnosis the UT’s have been selected as the ten states with the higher indigenous population (Oaxaca with 34.2% of indigenous population, Yucatan with 30.3%, Chiapas with 27.2%, Quintana Roo with 16.7%, Guerrero with 15.1%, Hidalgo wit 15.1%, Campeche with 12.3%, Puebla with 11.7%, San Luis Potosi with 10.7% and Veracruz with 9.4%) according with the data [3] ; nine of the which have an indigenous population superior to the ten percentage points adding between the ten the 81.01% of the total national indigenous population (Table 1). The UTR is the Distrito Federal that alone has 1.5% of indigenous population. The reference year for all indicators compared is 2010 as such the time of the analysis the official indicators that had been presented or published more recently corresponded to that year.
3. Results
Here the results of the diagnostic made are presented, ordered according to the thematic axes of health that make up the ethnic approach methodology presented.
3.1. General Life Conditions
In this area the variables and indicators that make up the dimensions of multidimensional poverty (particularly regarding the lack of educational instruction and lack of housing services such as piped water, drainage and dirt floor), as such as the index of human development and index of marginalization.
As for the multidimensional poverty this is confirmed by the dimensions of the social rights, the economic wellbeing and territoriality; it is said that it is moderate when one person has at least one social deprivation and this income is lesser than the wellbeing like or rather when said person has one of the two social deprivations and their income is lesser than the minimum wellbeing, while it is considered extreme when there exists three or
![]()
Table 1. Composition of the population in the Mexican states with higher indigenous population, 2010.
Source: Own elaboration, based in [3] . 1Population aged five years-old or older that speaks indigenous language.
more social deprivations and the income is inferior to the minimum wellbeing line [7] . As such, above the situation of multidimensional poverty it was found that while the 79.6% of the indigenous population is found in this condition, only the 44.1% of the non-indigenous population lives in such situation [7] , which reflects a difference in percentage points of 35.5. The same way, if the rates are analyzed by the type of multidimensional poverty in the two studied groups, the moderate poverty is 34.8% for the indigenous population and the 34.9% for the non-indigenous population, the which seems to equilibrate the balance until arriving at the indicator of extreme poverty that is 44.7% for the indigenous population and only the 9.2% for the non-indigenous population, what also generates a difference of 35.5 percentage points. For its part, the percentage of the population that is not poor or vulnerable is of 3.0 for the indigenous population and 20.3 for the non-indigenous population, fiving an unfavorable difference for the indigenous population of 17.3 percentage points. Regarding the monthly per capita income, this is of 3,072 Mexican pesos for the non-indigenous populations and of 1247 Mexican pesos for the indigenous population, what shows that this last population receives barely the 40.5% of monthly income in comparison with the monthly perceptions of the group of that is non-indigenous.
In addition, the thematic analysis found that all the entities that concentrate the most indigenous population present rates more elevated of multidimensional poverty that the UT’R (Table 2), producing significant absolute differences, as so we have as an example Chiapas, Guerrero, and Oaxaca presenting a respective difference of 49.8, 38.9 and 38.8 percentage points more than the multidimensional poverty population then the one that exists in the Distrito Federal.
With regard to the lack of schooling an important gap was found for the indigenous population with respect to the non-indigenous population (Table 3), as such for example the states of Chiapas, Guerrero, Oaxaca and Veracruz present respectively an absolute difference of 13.8, 12.6, 11.1 and 7.9 percentage points more than population without educational instruction in the Distrito Federal and even these indicators in those states are higher than those recorded for the national percentage. In such states the relative difference is also very revealing because for example it shows that Chiapas has 3.31 times more the number of inhabitants without educational in struction than the Distrito Federal, meanwhile in Guerrero such factor increases 2.16, in Oaxaca a 2.19, and in Veracruz 3.39, which is accentuated if one considers that in all the entities mentioned the number of inhabitants is lower than in the Distrito Federal.
![]()
Table 2. Diagnostic without segregated values about multidimensional poverty in the Mexican indigenous population, 2010.
Source: Own elaboration, based in [7] . 1Expressed in percentages. 2Expressed in units.
![]()
Table 3. Diagnostic without segregated values about the lack of schooling in the Mexican indigenous population, 2010.
Source: Own elaboration, based in [3] . 1Expressed in percentages. 2Expressed in units.
About the number of households with dirt floors, it was found that in contrast with the non-indigenous population, the gap is very high for the indigenous population (Table 4), meanwhile the Distrito Federal only has one percentage point of the population in such conditions, Oaxaca, Guerrero, Chiapas and Veracruz present respectively 17.7, 17.4, 13.7 and 10.7 percentage points more than in that entity, that is to say as an absolute difference such that nine of the ten entities with the most indigenous population, exceed the indicated percentage towards the overall national level. In addition, the relative difference shows that Veracruz has 9.60 times more the number of households with dirt floor than those of the Distrito Federal has, while in Oaxaca such factor exceeds by 7.17 in Chiapas by 6.53, in Guerrero a 6.07 and in Puebla a 5.39.
In respect to the number of households without drainage, the absolute difference shows that Oaxaca, Guerrero, Yucatan and San Luis Potosi have the most gaps, with 28.8, 22.5, 19.3, and 18.4 respective percentage points above what is found in the Distrito Federal, who just has one percentage point of its population it such conditions (Table 5). The same way, nine of the ten entities with a population of ethnic origin significantly exceed the
![]()
Table 4. Diagnostic without segregated values about households with dirt floors in the Mexican indigenous population, 2010.
Source: Own elaboration, based in [3] . 1Expressed in percentages. 2Expressed in units.
![]()
Table 5. Diagnostic without segregated values about households without drainage in the Mexican indigenous population, 2010.
Source: Own elaboration, based in [3] . 1Expressed in percentages. 2Expressed in units.
percentage levels recorded towards the national global indicator. For its part, the relative difference shows that Veracruz has 13.30 more times the number of households without drainage than those the Distrito Federal had, meanwhile for Oaxaca this factor is all 11.2, for Guerrero of 7.76, for Chiapas 7.38 and for Puebla of 7.37.
In the topic of the households without running water, the absolute difference shows the gap in this dimension of poverty is more elevated than in the previous ones (Table 6), as such Oaxaca, Chiapas, Guerrero and Veracruz show respectively 55.4, 47.8, 45.5 and 39.8 percentage points more than in the Distrito Federal, which only reaches the 12.6 percentage points of households in such conditions. But one of the states with the greatest national indigenous population, the other nine exceeds the percentage set for the national overall indicator. For its part, the relative difference indicates that Veracruz has 3.41 more times the number of households without running water than those that the Distrito Federal has, while in Puebla and Oaxaca the factor increases to 2.16 and 2.07 respectively.
In the same form, and following the variables and indicators about the general conditions of life of the Mexican indigenous population, it should be noted that the notion of the human developments gives priority to the capacity that people have in choosing between the different ways of live that they consider valuable [8] . As such, the Human Development Index (before HDI) refers to the opportunities that the individuals have to enjoy a long and healthy life, to access knowledge that is useful to the individual and the social level, and to acquire the sufficient means to get involved and decide on their environment [8] . In this theme (Table 7), the absolute differences most elevated in the HDI of the entities with the most indigenous population that are in Chiapas, Oaxaca and Guerrero with .1839, .1644 and .1574 respectively. One revealing fact about this index is the position that fives entities regarding higher or lower level of human development and a list of the 31 states and the Distrito Federal, 32 places are pointed out, located in descending order according to the highest level of human development found for one Mexican entity during 2010, right there the Distrito Federal ranks number one (indicating that it has the highest HDI in the country) and about the ten states analyzed for this assessment, the list continues with Quintana Roo in the 10th place, Campeche in the 18th place, Yucatan in the 20th place, San Luis Potosi in the 23rd place, Hidalgo in the 24th place, Puebla in the 25th place, Veracruz in the 28th place, Guerrero in the 30th place, Oaxaca in the 31st place and Chiapas in the 32nd place. This was on both perspectives Chiapas, Oaxaca and Guerrero obtain the worst HDI indicators.
![]()
Table 6. Diagnostic without segregated values about households without running water in the Mexican indigenous population, 2010.
Source: Own elaboration, based in [3] . 1Expressed in percentages. 2Expressed in units.
The marginalization refers to the set of problems or social disadvantages of the community or location, making reference to a group of people and families; in a way that it not only lacks of certain opportunities for the development, if not also the possibility of acquiring them [9] . As such, of the ten analyzed entities (Table 8), the one that reaches the lowest index of marginalization is Quintana Roo, although all of them present an absolute difference important in relation with the Distrito Federal, such that Guerrero, Chiapas, Oaxaca and Veracruz are located in 85.68, 81.10, 77.44 and 54.59 percentage points more respectively. According to their place in the national context, said states also present the highest levels of marginalization, being Guerrero the number one
![]()
Table 7. Diagnostic without segregated values about human development in the Mexican indigenous population, 2010.
Source: Own elaboration, based in [8] . 1Expressed in units. 2Does not apply.
![]()
Table 8. Diagnostic without segregated values about marginalization in the Mexican indigenous population, 2010.
Source: Own elaboration, based in [10] . 1Expressed in percentages. 2Does not apply.
place in such classification, Chiapas in place number 2, Oaxaca number 3, Veracruz number 4, Puebla number 5, Hidalgo number 6, San Luis Potosi number 7, Campeche number 10, Yucatan number 11, Quintana Roo number 20 and in contrast, the Distrito Federal in place number 32 that is the lowest marginalization.
3.2. The Health Status
The second line of the diagnostic analysis is established for the variables and indicators of morbidity, maternal mortality, infant mortality and hope of life at birth. However, only the last two are available. For the topic of infant mortality, the absolute difference with disintegrated data (Table 9) shows that in all of the states analyzed the indigenous population has higher rates, as such Guerrero, Yucatan, Oaxaca, Veracruz and Hidalgo show 16.2, 9.6, 9.3, 7.1, and 7.1 respective more deaths in children younger than one year for each 1,000 born alive, in contrast with the non-indigenous population. In respect to the life expectancy of life at birth, the indigenous population analyzed in the ten states has the lowest projections; as such Guerrero, Oaxaca and Yucatan are the entities where the absolute difference is higher, respectively with 2.3, 1.4 and 1.4 years less of life than those estimated for the non-indigenous population.
3.3. The Health Services
In this third area of diagnosis are found the variables and indicators regarding coverage, quality, and cultural adhesion to the health services, but due to the lack of official data, the last points are analyzed in previous research. As such, even though the death rates continue to decline, the indicators of heath of the indigenous populations [13] show that, in contrast with the non-indigenous population, there still exists important differences in the basic health services, as such for example the total of the non-indigenous population that is entitled of a sanitary institution reaches the 67.7%, while that in the indigenous population of the country the proportion only reached the 60.9%, yielding an absolute difference of seven percentage points lowers for indigenous people and leaves them below the national figure of 66.4%. The institutional distribution of the indigenous coverage in health (Figure 1) shows that for the most part of the indigenous population is served though the Seguro Popular program [13] , conceived since 2002 [14] , what means that they do not count with medical attention as a result of a guarantee issued by a labor practice.
![]()
Table 9. Diagnostic with segregated values about two dimensions of the health status in the Mexican indigenous population, 2010.
Source: Own elaboration, based in [11] [12] . 1Expressed by the number of deceases of -1 year-old minors for every born 1000 alive. 2Expressed in years.
In this regard, this diagnostic showed that some Mexican states with larger indigenous population have larger sanitary coverage in contrast with the Distrito Federal. Nevertheless in the latter place, the high state levels of sanitary coverage reach precisely across the above mentioned Seguro popular program (Table 10).
4. Discussion
One of the principal critics that the methodology of the PAHO [2] could have for the cases where there is no desegregated data, is the calculation of geographic inequality through proxy is indirect. However, it should be stressed that given the lack of specific official data this a valuable approach to the object of study, since that
![]()
Figure 1. Institutional distribution of the sanitary coverage for the Mexican indigenous population, 2010. Source: Own elaboration, based in [13] .
![]()
Table 10. Diagnostic without segregated values about two dimensions of health services for the Mexican indigenous population, 2010.
Source: Own elaboration, based in [3] . 1Expressed in percentages. 2Expressed in units.
without doubt describes a first outlook for subsequent investigations. In this regard, the PAHO adds that the lack of specific disaggregated data cannot be an impediment to the analysis, because since the beginning it shows a lack of interest by the States to meet the health care needs of minority populations [2] .
In addition, making the geographic proxy with disaggregated data is a very enriching opportunity, since it shows a greater level of depth and stratification in the comparative with the different Territorial Units (which in this case were the federal entities), what constitutes an advantage for the details of diagnosis, such is the case of 1) the infant mortality, which disaggregated data shows one absolute difference of 8.8 more deaths for the indigenous population in contrast with what happened in the non-indigenous population, even though with the geographical proxy of such data this difference that is higher in three of the states with the highest indigenous population was acquired, Guerrero, Yucatan and Oaxaca that respectively obtain an absolute difference of 16.2, 9.6 and 9.3 decreases more in deaths of children under one year old per thousand live births and 2) the hope of life at birth, where the absolute difference with disaggregated data shows that the indigenous population reaches 1.7 less years of life than the non-indigenous population, however, the geographical proxy of such data indicates that in Guerrero this difference reaches the 2.3 years of life.
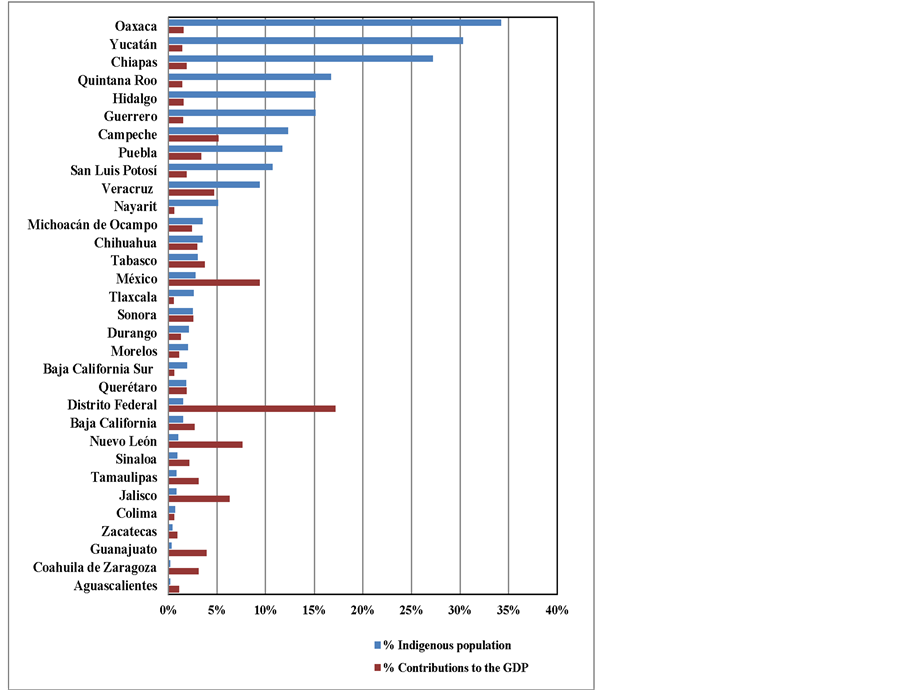
Another of the objections that could be stated to the differences observed between the indicators UTs and the UTR is that each one of them has a development proportional to the contributions made with respect to Gross Domestic Product (GDP). However, states such as Campeche, Veracruz and Puebla provide greater GDP than at least 17 of the remaining states of the country (Appendix A) and yet remain within the group of states that, in addition to recording the largest indigenous populations have higher rates of Marginalization and Human Development, to mention only a couple of items.
Furthermore, and with the intention to discuss the finding of this this analysis, comparative studies of the national health of the Mexican indigenous population and non-indigenous population were searched, but no actual work was identifies or that addressed specifically or the specific theme studied here. Of such way that, except the sources used for this diagnosis it was obtained only in a study that analyzed the health of indigenous people in Mexico, principally during the period between 1990-1996, it was found that the indigenous population had significant strains in their health since in those municipalities with high indigenous population, the rate of deaths from communicable diseases to the indigenous population was similar to that recorded nationwide in 1950, while life expectancy for the period amounted to which it had the year 1980 at a national level [15] . These results are very illustrative because they show that in the category of health of indigenous population reaches a lag of spanning four and one decade respectively. In addition, analyzing the infant mortality rate in 10 counties of Latin America with the census data of the year 2000, it [2] concluded that indigenous children are at greater risk of dying before their first year of life compared with non-indigenous children, noting that in the case of Mexico this risk is doubled; in respect to extreme poverty the discrepancies are not reduced, then analyzed the 14 selected countries in Latin America, this last source found that there are significant gaps in 12 of them at the expense of ethnic groups.
On the other hand, it notes that the indicators analyzed in this paper shows a huge gap in the health situation of the indigenous population, the same that remains continuous for each of the thematic axes of the problem, what probably is explained by the absence of public policy destined specifically to the Mexican indigenous population, despite the fact that since the beginning of this century the national government and their respective plans have recognized the backwardness and lack in such population as well as the urgency to address them [6] .
5. Conclusions
The Mexican indigenous population presents a notable disadvantage in the different thematic axis that make up the diagnostic about its health situation, as such for example the gap of multidimensional poverty reaches 35.5 percentage points, figure that remains in the case of extreme poverty, while the vulnerability of the issue lies under the indigenous population that barely receives the 40.5% of the income that the non-indigenous population receives. On that note, the states of Chiapas, Guerrero and Oaxaca are maintained as the federal states with the most inequities in terms of lack of schooling, presenting higher number of homes with dirt floors, no drainage, piped water, as well as a lower Human Development Index, a higher Marginalization Index, a lower total health coverage and a higher sanitary coverage through the Seguro Popular program, whose effectiveness has been questioned.
As such, after this, the analysis reveals substantial differences between the health situation of the Mexican indigenous and non-indigenous population, being the native ethnic groups that are at the most disadvantage in the subject. Allows us to confirm, that on the themes analyzed the factor of ethnicity in Mexico a determinant for the survival of social inequities and affects the conformity of minority groups. So that the result also allows Mexico to confirm that indigenous people are a minority in the full sense of the word, because as we have seen, these are groups that are subordinate in a sociopolitical hierarchy, with less power and less security for access to resources and services that the majority groups [1] , which in this case are integrated by the non-indigenous population of the country.
This analysis through the geographic proxy and without disaggregated data shows huge gaps for the Mexican indigenous population, constituting a valuable tool for dimensioning the subject studied, here the hypothesis states that these gaps will be higher in both can have disaggregated data, as shown in the case of infant mortality, where they could contrast the disaggregated data and data is not disaggregated and a discrepancy oscillating in a range of 2.2 and 16.2 was obtained with more deaths to the states that formed the geographic proxy (Appendix B). Therefore, this study reveals the need to pursue the subject, making detailed and comprehensive scientific research, and the corresponding analysis of public health policy aimed at these people.
Finally, it notes that the right term to name these gaps in living conditions of the populations studied here are social inequities and not social inequalities, since the term inequity alludes a great injustice in the difference found, while the term inequality only signals that there is a lack of equality, rather a difference that is not a problem precisely because ethnic groups are characterized by not being equal in respect to others, for having a characteristic that distinguishes and defines them as such, so the difference is part of a cultural diversity. However, the term inequality minimizes the importance of the issue here under consideration it softens it, eliminating the political, social, cultural implications and the injustice that are background on the prevalence of the issue, eliminating also its unenviable character, and this analysis participates in the idea that the language must be precise since it constructs realities and legitimizes, perpetuating problems that even those from academia or science are outlined in a general manner, as if their existence were natural and not a result of a historical process of social interaction between different groups, characterized by a asymmetric distribution of power, that is precisely what is shaping minorities.
Acknowledgements
Study realized in the frame of Ph.D. Program on Science, Technology and Society of Cinvestav-IPN (Av. Ins- tituto Politécnico Nacional 2508, Col. San Pedro Zacatenco, Delegación Gustavo A. Madero, Apartado Postal 14-740, 07000 México, D.F., México. Telephone: +52 (55) 57473800, Ext. 6780) and the project Environmental Governance in Latin America and the Caribbean (ENGOV) 2011-2015 (FP7-SSH-2010-3/SSH.2010.4.1-2). Guzmán-Rosas thanks Consejo Nacional de Ciencia y Tecnología (Conacyt).
Appendix A
Comparative graph of Mexican indigenous population and contributions to the GDP by federative entities, 2010. Source: Own elaboration, based in [16] .
Appendix B
Comparative table of inequities in infant mortality of the Mexican indigenous population with segregated values and without segregated values, 2010.
Source: Own elaboration, based in [11] [12] . 1Expressed by the number of deceases of -1 year-old minors for every born 1000 alive.