Qualitative and Quantitative Analysis of Five Bioactive Flavonoids in Salix bordensis Turcz. by HPLC-DAD and HPLC-ESI-MS ()
1. Introduction
Flavonoid is a widespread family of plant secondary metabolites, and it is always conjugated to glycosides. Flavonoids comprise several subclasses, which include flavones, isoflavones, flavonols, flavanones, and so on. These classes are grouped based on the degree of unsaturation and oxidation of the three-carbon segment of C6-C3-C6 flavone skeleton [1] [2] . Many flavonoids have biological activities. For example, kaempferol shows an anti-inflammatory effect on activated macrophages [3] , has chemopreventive properties in brain tumors [4] , and has an suppression effect on cell proliferation in human gut cancer lines [5] [6] . Similarly, quercetin also has various pharmacological actions, including scavenging of free radicals [7] -[9] , modulation of epoxyeicosanoic acid synthesis, prevention of platelet aggregation [8] , and vasodilating effects [10] [11] .
Our main interest in this study is in the flavonoids found in Salix bordensis Turcz., a woody plant of the Salix (Salicaceae) family, which is a variation of Salix microstachya Turcz. It is distributed in the northwest (Gansu, Qinghai and Ningxia province, China) and northeast (Heilongjiang, Jilin and Liaoning province, China) of China and used in the production of fiber and energy. It has a number of desirable characteristics, which include a fast growth rate, short rotation cycle, ease of clonal propagation, high drought and disease resistance, and tight coupling between physiological traits and biomass productivity. Its root and fibrous roots can clear away heat, along with gas, and it has been used in folk medicine for the treatment of gastropyretie toothache and acute lumbar muscle sprain [12] . Previous studies have focused on the drought resistance, wind prevention, and sand fixation of Salix bordensis Turcz. [13] -[16] . Except for studies on the isolation and identification of ten compounds, including seven flavonoids by Luo et al. [17] and Yang et al. [18] , systematic investigations on the phytochemistry of the components of Salix bordensis Turcz. have not been carried out properly, and no reports on the simultaneous quantitation of flavonoids are currently available. The primary focus of this study is to establish a platform for the analysis of identified flavonoids from Salix bordensis Turcz. in Gansu province, China. The objective is to provide preliminary data for a comprehensive HPLC-MS analysis of flavonoids in Salix bordensis Turcz. and to lay a scientific and technical basis for the utilization and development of the plant resources of the Salix (Salicaceae) family.
2. Experimental
2.1. Chemicals and Materials
High-performance liquid chromatography (HPLC)-grade acetonitrile and methanol (E. Merck, Darmstadt, Germany) were used for the HPLC analysis. Deionized water was purified using a Milli-Q system (Millipore, Bedford, MA, USA). All other chemicals were of analytical grade and were purchased from Tianjin Reagent Company (Tianjin, China). The five reference substances, namely, quercetin-3-O-β-D-glucoside (f1), quercetin (f2), kaempferol (f3), rhamnetin (f4), and kaempferol-7,4'-dimethyl (f5), were isolated from the Salix bordensis Turcz. in Lanzhou University. The structures of the five flavonoids are shown in Table1 The purity of all compounds exceeded 98% (determined via HPLC). The structures of the compounds were confirmed by data from mass spectrometry (MS), proton nuclear magnetic resonance spectroscopy (1H-NMR), and carbon nuclear magnetic resonance spectroscopy (13C-NMR) experiments compared with those reported in literature [17] .
The samples of Salix bordensis Turcz. were collected from Zhangye City, Gansu Province and were dried before extraction at 40˚C until a constant weight was obtained in the dark. The botanical origins of the material were identified by Professor Zhigang Ma at Lanzhou University (Lanzhou, China). The voucher specimens were deposited at the Key Laboratory of Chemistry and Quality for Traditional Chinese Medicines of the College of Gansu Province, Gansu College of Traditional Chinese Medicine, Lanzhou, China.
2.2. High-Performance Liquid Chromatography-Diode Array Detection Analysis
High-performance liquid chromatography-diode array detection (HPLC DAD) analysis was performed using an Agilent 1100 series HPLC instrument (Agilent, Waldbronn, Germany) equipped with a G1312A binary pump, a G1315B diode array detector, a G1329A autosampler, and a G1316A column compartment. Data acquisition was done using a copyrighted Agilent Technologies software.
Separation was performed using a ZORBAX SB-C18 column (5 μm, 250 mm × 4.6 mm, i.d., Agilent, USA). The temperature of the column was set at 30˚C. A gradient system with 0.3% (v/v) formic acid in water (A) and methanol (B) was used, as shown in Table2 The mobile phase flow rate for the separation was 1 mL·min−1. The injection volume was 20 μL. Chromatograms were recorded at an absorbance of 360 nm. In this work, all calculations for quantitative analysis were performed with linear regression external standardization by measuring the peak areas. The samples were filtered through a 0.45 μm HPLC filter before injection.
2.3. MS Condition
High-performance liquid chromatography-electrospray ionization tandem mass spectrometry (HPLC-ESI/MS) experiments were performed using the Agilent 1100 HPLC system described above, combined with a Bruker Esquire 3000 Plus ion trap mass spectrometer (Bruker Franzen Analytik GmbH, Bremen, Germany) equipped with an electrospray ionization (ESI) interface. Instrument control and data acquisition were performed using the Esquire 5.0 software. The ion source temperature was 260˚C, and the ESI needle voltage was always set at −4.0 kV. Nitrogen was used for drying, and the nebulizer gas had a flow rate of 10 L/min and a back-pressure of 30 psi. Helium was introduced into the trap to function as the collision gas with an estimated pressure of 6 × 10⁻⁶ mbar to improve trapping efficiency. For HPLC-ESI/MS analysis, the flow was subjected to a split of 1:5 before being introduced into the ion source. A short delay of approximately 0.2 min occurred between the DAD and MS systems as a consequence of the connecting tubing between HPLC and MS.

Table 1. Chemical structure of the five quantified compounds.

*glc: glucopyranuronide; M.W., molecular weight.
Table 2. Solvent gradient program of HPLC analysis.
2.4. Preparation of Standard and Sample Solutions
Appropriate amounts of standards were accurately weighed and dissolved in 80% (v/v) methanol-water to prepare the stock solutions for five reference standards. The solutions for the chromatographic runs were diluted from the stock solutions with 80% (v/v) methanol-water.
The Salix bordensis Turcz. sample was mechanically ground. An accurately weighed sample was ultrasonically extracted for 40 min with ten times 80% (m/v g/mL) methanol. The extracts of the samples were subsequently filtered through a 0.45 μm nylon membrane filter (Tianjin Jinteng Experiment Equipment China) prior to HPLC injection (20 μL). The samples were prepared and analyzed in three replicates. The quantity of each analyte was subsequently obtained from the corresponding calibration curve.
2.5. Validation of Method
The Salix bordensis sample from Zhangye City, Gansu Province were used for the validation of the proposed method. A number of experimental parameters were studied for the methods, namely, precision, repeatability, regression linearity, stability, limit of detection (LOD), limit of quantification (LOQ), and recovery.
Linearity was determined using the square correlation coefficients of the calibration curves generated by three repeated injections of standard solutions at six concentration levels. The chromatographic conditions described above were used to analyze the Salix bordensis. The analyte peak areas obtained were plotted against the corresponding concentrations of the standard solutions, and the calibration curves were set up using the least-square method. The lowest concentration of the working solution was diluted with 80% methanol for a series of appropriate concentrations to determine the LOD and LOQ at signal-to-noise ratios of 3 and 10 for standard solutions, respectively.
Intraand inter-day variations were investigated by analyzing known concentrations of the four analytes in six replicates in a single day and by duplicating the experiments for three successive days. The relative standard deviation (RSD) was taken as a measure of precision.
Repeatability was assessed by analyzing five independently prepared samples via the same method. Sample stability was evaluated at room temperature and analyzed at 0, 2, 4, 8, 12, and 24 h within 1 day. Variations were expressed as RSD.
A recovery test was used to evaluate the accuracy of the proposed method. Accuracy was determined by adding the mixed standard solution at low (80% of the known amounts), medium (same as the known amounts), and high (120% of the known amounts) amounts to a Salix bordensis Turcz. sample with known concentrations. The resulting samples were then extracted and analyzed via the proposed procedure. The quantity of each analyte was subsequently obtained from the corresponding calibration curve. The recovery was calculated as follows:
Recovery (%) = 100 × (Amount found − Original amount)/Amount spiked.
3. Results and Discussion
3.1. Optimization of Analysis Conditions
The first step in the quantitation of the five flavonoids in Salix bordensis Turcz. (structures shown in the Table 1) is the full extraction from the materials. The preliminary tests made in this study indicated that the different extraction methods (ultrasonication, reflux, or Soxhlet) have a great influence on the content of the five flavonoids. As shown in Figure 1, the contents of the five flavonoids are higher when subjected to the ultrasonication extraction method compared with those subjected to other methods. The extraction solvent (methanol, ethanol, and ethyl acetate), extraction solvent concentration (30% methanol, 50% methanol and 80% methanol), solvent volume (1:8, 1:10, or 1:12 medicinal materials/solvent, m/v g/mL), and ultrasonication extraction time (30, 40, 50, or 60 min) were designed and evaluated in this experiment by comparing the sums and contents of characteristic peaks in each chromatogram of different factors. The sample that was ultrasonically extracted for 40 min with ten times 80% (m/v g/mL) methanol resulted in the best extraction process.
3.2. Optimization of the Chromatographic Separation by HPLC
The Salix bordensis Turcz. is a challenging matrix because of the complexity of water-soluble compounds, such as flavonoid aglycones. Hence, the optimization of HPLC separation for quantitative analysis was difficult because of the complex chromatographic profile. The preliminary tests made in this study indicated that a longer column should be used in the presence of f5. Therefore, to optimize the resolution and run time, several mobile phases, including MeOH-water, ACN-water, and MeOH-ACN-water were tested on a 250-mm long C18 column. The other serious problem in the separation of flavonoids is peak tailing, which is related with the dissociation of the hydroxyl groups. The presence of acid in a mobile phase can prevent this effect by changing the pH, thereby improving the peak symmetry of the analytes [19] [20] . As shown in Figure 2 (there are four section A, a, B and b in Figure 2), the routine addition of 0.3% formic acid to the mobile phase was only sufficient to reduce tailing in real Salix bordensis extracts (shown in section A of 0.2% formic acid and section a of 0.3%

Figure 1. Effect of the different extraction method in the sample solution on the content of the five quantified compounds. All data are the mean of a triplicate analysis.
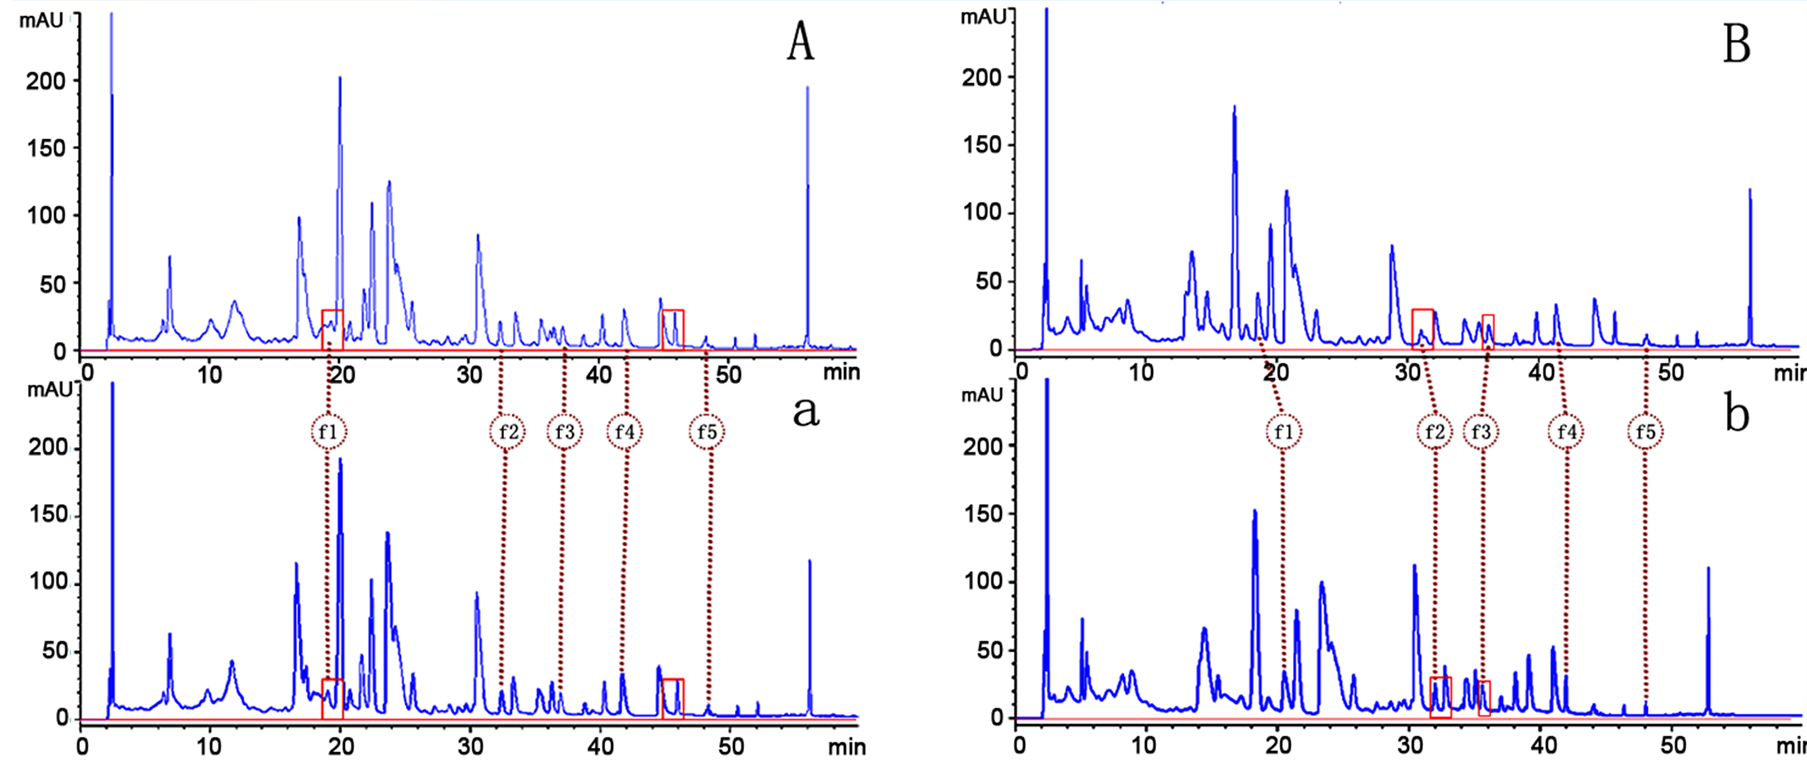
Figure 2. Chromatograms of the separation of the five quantified compounds of extracts of the Salix bordensis Turcz. (A) 0.2% (v/v) formic acid in water as solvent A, methanol as solvent B, solvent gradient program as following: 0min: 28% B;25 min: 46% B; 40 min: 60% B; 53 min: 100% B; (a) 0.3% (v/v) formic acid in water as solvent A, methanol as solvent B, solvent gradient program the same as (A); (B) 0.3% (v/v) formic acid in water as solvent A, methanol as solvent B, solvent gradient program as following: 0min: 28% B; 25 min: 46% B; 40 min: 60% B; 53 min: 100% B, (b) 0.3% (v/v) formic acid in water as solvent A, methanol as solvent B, solvent gradient program as following: 0min: 32% B; 20 min: 40% B; 35 min: 60% B; 50 min: 100% B.
formic acid to the mobile phase of Figure 2). Different elution programmings (shown in section B and section b of Figure 2) with 0.3% (v/v) formic acid in water (A) and methanol (B) as the mobile phase were tested. Finally, a valid and stable HPLC was achieved through a gradient system mobile phase (shown in Table 2) at the conditions described above. The representative DAD (360 nm) chromatograms for the standard solutions of the five flavonoids and for the solution of inflorescences of Salix bordensis Turcz. are shown in Sections a and b of Figure 3, respectively.
3.3. Identification of the Five Bioactive Flavonoids
The five flavonoids in the mixture were identified by comparing their ultraviolet spectra of HPLC-DAD, retention time, and MS data with those of the corresponding reference compounds.
Diode array detection allowed the online recording of UV spectra and rapid attribution of peaks, which corresponded to the flavonoids in the chromatograms. The assignment of compounds peaks was unambiguous because these peaks exhibited characteristic UV spectra, with two absorption bands (Band I, λmax approximately 320 nm to 360 nm and Band II, λmax approximately 250 nm to 280 nm). The UV spectra of the five bioactive flavonoids in the mixture were in agreement with those of their authentic reference compounds. Their UV spectra are shown in Figure 3. The peak purity of the flavonoids was determined by overlapping the UV/DAD spectra in different regions of the same peak by using the HPLC software. On the other hand, the assignment of HPLC peaks was confirmed by comparing the retention times with those of the authentic standards (Figure 3).
To confirm the above identification further and to determine a rapid and exact method that could be used to identify directly the five bioactive flavonoids in the mixture, HPLC-ESI/MS experiments were employed for online identification in the study. Positive and negative ion modes were utilized for the compounds, and the results suggested that the positive ion mode was more sensitive. The ESI source gave [M+]">1]+ and [M+Na]+ ions as quasimolecular ions. Figure 4 shows that the molecular masses for peaks f1, f2, f3, f4, and f5 are 478, 302, 286, 316, and 314, respectively.
3.4. Validation of Methodology
The regression equation for each reference standard, along with the LOD and LOQ values, are shown in Table3 The calibration curves show good linearity (r2 ≥ 0.9998) within the test ranges. The overall intraand inter-day precision RSD values were higher than 1.33% and 2.44%, respectively. The overall stability over 24 h was 4.62%, and the repeatability variation was 4.62% (shown in Table 4). The developed analytical method showed excellent accuracy, and the overall recovery for all compounds was between 95.5% and 103.0% (RSD ≤ 2.34%) (shown in Table 5). Therefore, the method is precise, accurate, and sufficiently sensitive for the simultaneous quantitative analysis of the five main bioactive flavonoids in Salix bordensis Turcz.
3.5. Analysis of the Five Bioactive Flavonoids in Salix bordensis Turcz.
The established HPLC-MS/MS and HPLC-DAD method was applied to the simultaneous determination of five bioactive flavonoids in Salix bordensis Turcz. The representative chromatograms of the extracts of Salix bordensis are shown in Figure 3. The symmetric factors (0.95 - 1.21) and tailing factors (0.93 - 1.13) showed that the investigated chromatographic peaks were sharp and symmetrical. The contents of the investigated compounds were calculated by individual calibration curves, and the mean values for three parallel determinations are summarized in Table6 The six primary compounds were detected in the samples of Salix bordensis Turcz. Although the chemical constituents of the three samples were quite similar, several differences were observed in the contents of the five investigated flavonoids. The total amount of flavonoid ranged from 2.56 mg/g to 3.71 mg/g, which indicates that the total amount of flavonoids from Jiuquan is higher than those from other areas. Thus, the resources of Jiuquan deserve attention because of the higher content of flavonoids. Furthermore, this study showed that a number of flavonoids exist in the Salix bordensis Turcz. Thus, further investigations are needed to understand the biological activity of these resources to provide a scientific basis for exploiting this plant resource.
4. Conclusion
In this study, HPLC-UV/DAD and HPLC-MS/MS methods proved to be suitable and reliable for the qualitative
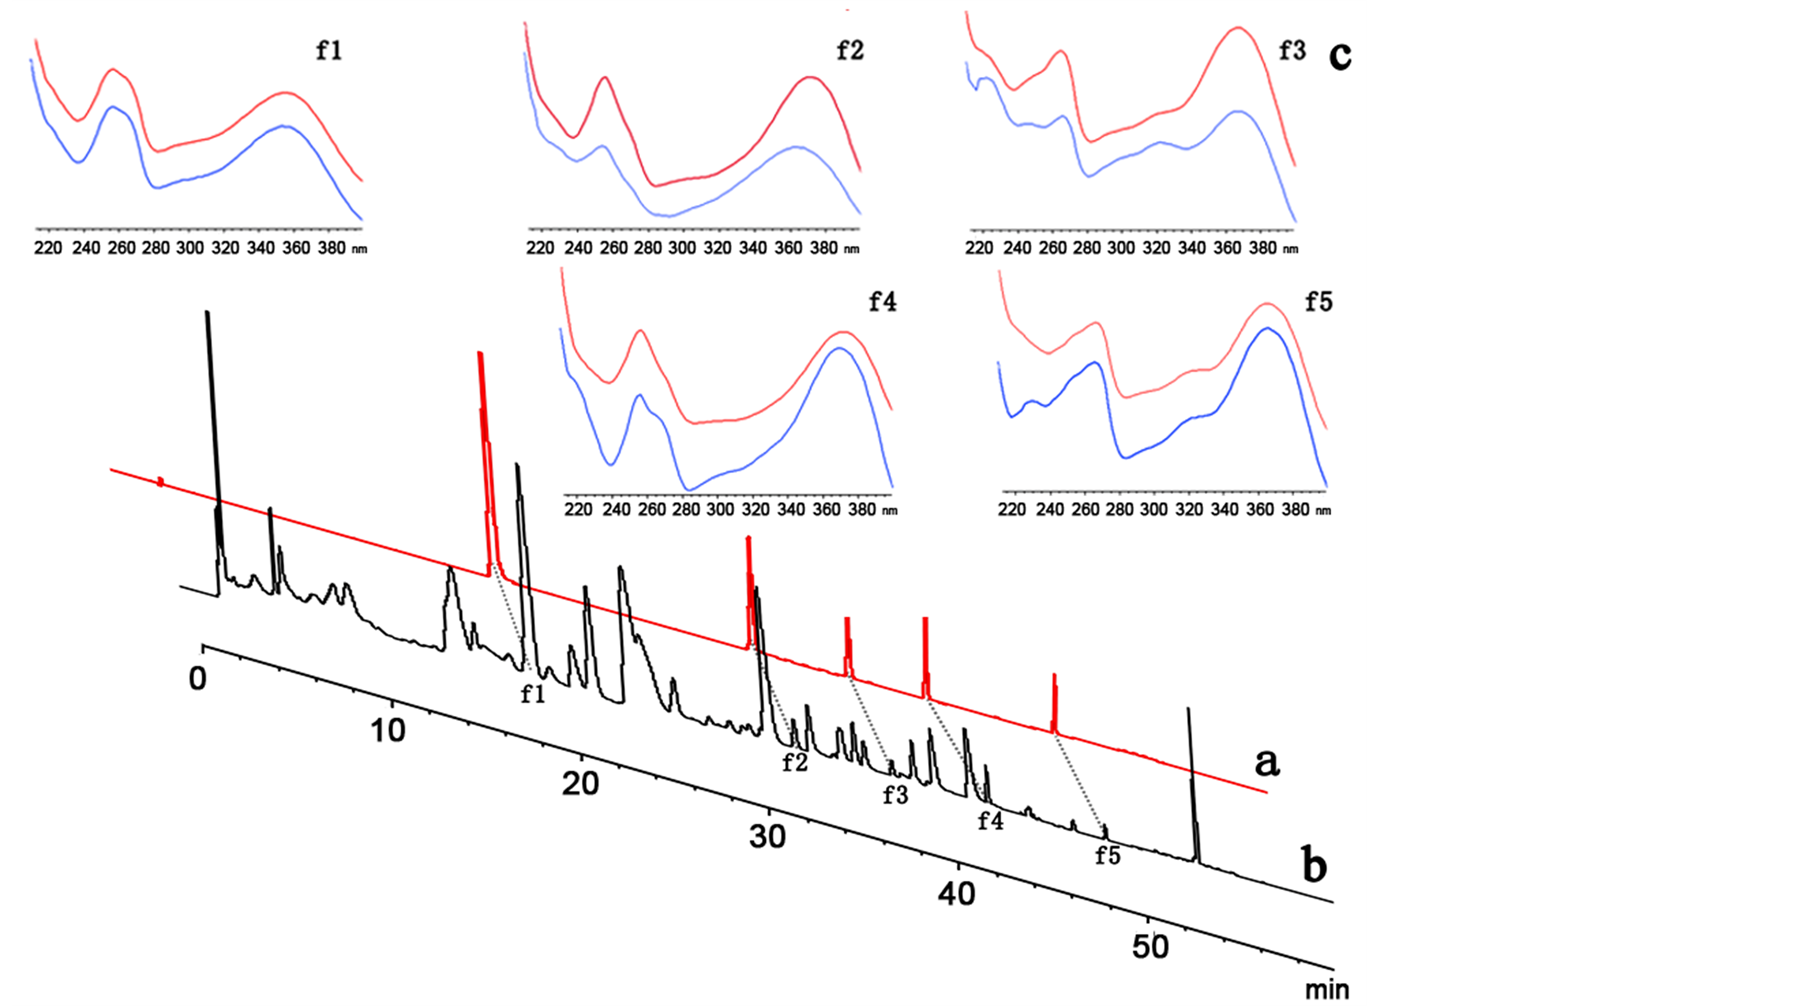
Figure 3. HPL C chromatogram recorded at 360 nm of mixed reference standards: Quercetin-3-O-β-D-glucoside (f1), Quercetin (f2), Kaempferol (f3), Rhamnetin (f4), Kaempferol-7,4'-dimethyl (f5) (a); and HPLC chromatogram of the 80% methanol extracts of the Salix bordensis Turcz. (b); Ultraviolet spectrum of the five quantified compounds, the upper from the HPLC chromatograms of the 80% methanol extracts of the Salix bordensis Turcz. and the nether from the HPLC chromatograms of mixed reference standards (c).
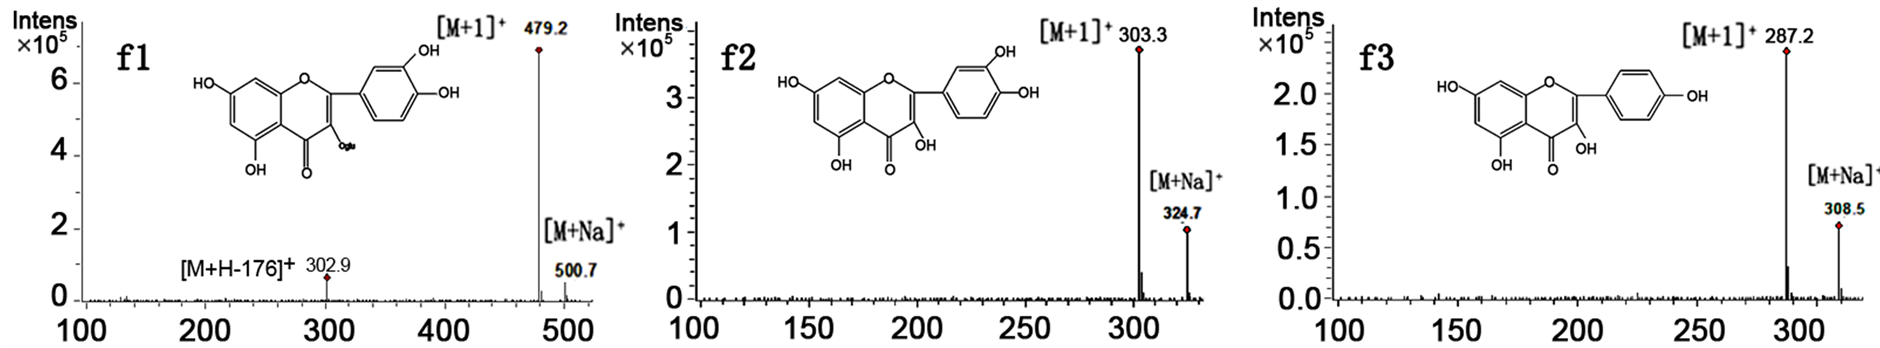
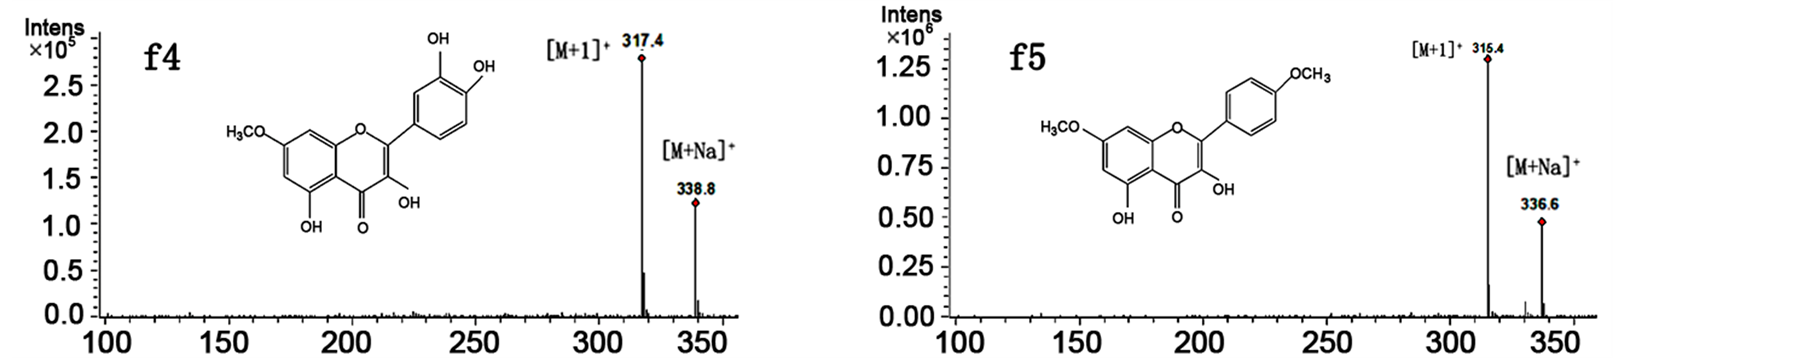
Figure 4. MS spectra of peaks f1, f2, f3, f4 and f5 of the Salix bordensis Turcz. sample on HPLC-MS/MS.
Table 3. Calibration curves of the five quantified reference standard compounds.
ax, amount of substance (μg); y, peak area; bLOD, limit of detection (S/N = 3); cLOQ, limit of quantification (S/N = 10).
Table 4. Precision, stability and repeatablity of the five quantified compounds.
a(SD/mean) × 100.
Table 5. Recoveries of the five quantified compounds.
a[(Mean of measured concentration-spiked concentration)/spiked concentration] × 100; b(S.D./mean) × 100.
Table 6. The contents (mg/g) of the five quantified compounds in Salix bordensis Turcz. from Gansu province.
aRD, relative deviation (%) = (|measured value mean/mean) × 100. bSalix bordensis T. from Gansu province. cThe data were presented as average of three replicates. dThe sum of five compounds including quercetin-3-O-β-D-glucopyranuronide, quercetin, kaempferol, rhamnetin, kaempferol-7,4'- dimethyl.
and quantitative analyses of five bioactive flavonoids in Salix bordensis Turcz. The evaluated parameters demonstrated that the methods offer good specificity, linearity, accuracy, and precision within acceptable limits, and the LOD and LOQ confirmed the efficiency of the methodologies in quantifying low concentrations of flavonoids, thereby revealing that the comprehensive evaluation method effectively controls the quality of Salix bordensis Turcz. on a regular HPLC system. This research also showed that a number of flavonoids exist in the Salix bordensis Turcz., thereby providing a useful basis for the utilization of this plant resource.
Acknowledgements
The authors gratefully acknowledge the Fund of National Nature Science Foundation Projects (81060327), (81260616), the Fund of the Scientific and Technical Innovation Project of Gansu province (1104FKCA122, 1305TCYA043) and the Basic scientific research Fund of Colleges and Universities in Gansu province (2011-06) and Found of Key Laboratory of Pharmacology and Toxicology for Traditional Chinese Medicines of Gansu Province, Gansu College of Traditional Chinese Medicine (ZDSYS-ZZKJ-2013(A)-001) for financially supporting this research. The authors thank Prof. Chong Li for providing reference standards.
NOTES
*Corresponding authors.