1. Introduction
Many natural minerals exhibit luminescence properties that are suitable for dating and dosimetry applications. Among the minerals with luminescence properties, quartz and feldspar are the most used ones. Feldspars are attractive dosimeters for luminescence dating because of their higher saturation dose and widespread availability compared to quartz [1] . Feldspar generally gives brighter luminescence signal than quartz and as its level of saturation dose is much higher it can provide a better estimate of burial age for older sediment [2] .
Duller (1997) summarized the advantages of feldspar in luminescence applications as follows [3] : 1) in geological samples feldspars typically have a higher intrinsic luminescence brightness than quartz, which means that they can be used to measure smaller absorbed radiation doses; 2) certain types of feldspar contain a significant proportion of potassium, whose radioactive isotope (40K) can contribute a large percentage of the total ionizing radiation dose to the sample. This “internal” component is unaffected by variations in interstitial water or in the thickness of the overburden, and hence the overall uncertainty in the dose rate is reduced; 3) the possibility to obtain an infrared stimulated luminescence (IRSL) signal from feldspars using stimulation from ~800 to 950 nm discovered by Hütt et al. (1988) [4] . Over the past few years feldspar IRSL dating has received increasing attention [5] -[8] . The luminescence properties of minerals are affected by a number of factors which include the origin, the composition, the radioactivity, the age, the temperature and the pressure [9] . Luminescence characteristics of feldspar of different origins have been investigated [10] -[15] . Previous work has identified high temperature TL peaks (310˚C, 330˚C, 400˚C, between 410˚C and 420˚C) [3] [16] [17] . Murray et al. (2009) reported that high temperature source is responsible for the majority of IRSL signal [17] . Gliganic et al. (2012) reported difference in the dependence of the shape of the net IRSL decay curve on stimulation temperature for samples from different locations. They concluded that the observed difference in the rate and pattern of the net IRSL decay as a function of stimulation temperature suggested that the process of IRSL production may vary between samples [12] .
This study aims at investigating the luminescence properties of feldspar collected from a mining site in Ibadan, Southwestern Nigeria. These include the relationship between TL and IRSL signals, the effect of stimulation temperature on IRSL, the dose response of IRSL and TL signals and dose recovery test using the SAR method.
2. Materials and Method
Feldspar mineral was sourced from a mining site in Ibadan, Southwestern Nigeria. According to Itiola (1998), the area host pegmatite [18] . Pegmatite is known to host a wide range of minerals, both metallic and non-metallic. The area is thus rich in minerals like mica, feldspar, lepidolite, quartz etc. The feldspar sample was pulverized and treated with 10% HCl to remove carbonate matter. It was then washed with distill water, wet sieved and kept in the oven at a temperature of 50˚C to dry. Samples were fixed on plantchet covered with light silicon spray. The TL and IRSL measurements were performed on a Risø TL/OSL-DA-15 reader equipped with a 90Sr/90Y beta source and a 7.5 mm U-340 Hoya filter.
3. Results and Discussion
3.1. TL Glow and IRSL Decay Curves
The TL glow curve and IRSL decay curve for a beta dose of 820 mGy are shown in Figure 1(a) and Figure 1(b), respectively. For the TL, the sample was heated to a temperature of 500˚C before irradiation. TL measurement was performed for a Tmax of 500˚C at a heating rate of 5˚C/s. Two peaks were observed at temperatures of ~136˚C and ~175˚C. No high temperature peak was observed as reported in previous work [3] [12] [16] [17] . This could be due to the origin of the feldspar used in this study. The IRSL signal was measured at room temperature for 100 s. The sample showed IRSL sensitivity.


Figure 1. (a) Thermoluminescence glow curve of feldspar at Tmax of 500˚C at a heating rate of 5˚C/s for a beta dose of 820 mGy; (b) IRSL decay curve of feldspar taken at room temperature for a beta dose of 820 mGy.
3.2. Characterising the Relationship between TL and IRSL
The relationship between TL and IRSL signals was investigated employing the approach used by Gliganic et al. (2012) [12] . Two aliquots were heated to a temperature of 500˚C and then irradiated with a beta dose of 2 Gy. This was immediately followed by TL measurement at Tmax of 500˚C with a heating rate of 5˚C/s. After the first measurement the samples were irradiated with same dose and preheated to a temperature of 200˚C at a heating rate of 5˚C/s and maintained for 10 s before the second TL measurement. Third TL measurement was done after irradiation, preheat and IR stimulation at 50˚C for 100 s. The TL glow curves for the three different treatments are shown in Figure 2(a). The TL measurement taken immediately after irradiation showed two peaks at ~138˚C and ~179˚C (as in Figure 1(a)). Only one peak was observed at a temperature of about 240˚C following preheat after irradiation. The TL signals with preheat treatments were integrated between 200˚C and 300˚C and the intensities subtracted. There was a reduction of about 89% in intensity for each of the aliquot. This shows that IR is able to remove charge from traps which are responsible for the TL peak. The signal of the preheat plus IR was subtracted from that of the preheat signal to obtained the loss TL (Figure 2(b)). Much of the signal was lost between 158˚C and 334˚C. This result suggests that the IRSL may be associated with this temperature region.
3.3. Effect of IR Stimulation Temperature on IRSL Decay Curve
The intensity of the total integrated IRSL signal of feldspars is observed to increase with increasing stimulation temperature [19] [20] . It is also reported that the decay rate of the IRSL signal increased with stimulation temperature [19] [20] . According to the latter authors [20] , this increase is due to a thermally assisted process of recombination. In contrast, Poolton et al. (2002) found that the form of the decay is not affected by stimulation temperature [21] . Thomsen et al. (2008) also reported that the rate of IRSL decay is not dependent on stimulation temperature, prompting them to suggest that tunneling recombination dominates IRSL production and thermal assistance is not significant [22] .
The effect of temperature of IR stimulation on the IRSL signal was examined. Feldspar sample was heated to a temperature of 500˚C to remove the natural signal, given a dose of 2 Gy and preheated to a temperature of 200˚C. IRSL was acquired using different stimulation temperatures ranging between 50˚C and 500˚C in the increment of 50˚C. The IRSL decay curves are presented in Figure 3(a) and Figure 3(b). Figure 3(c) shows the relationship between the net IRSL intensity and stimulation temperature. The net IRSL intensity (summation of the first 2 s signal minus the background, the summation of the last 10 s) increases as the stimulation temperature is increased to 250˚C, above which it decreases with temperature. This is in agreement with the observation of Duller and Wintle (1991) and McKeever et al. (1997) [19] [20] . This informed the choice of 250˚C IR stimulation temperature for the dose recovery test in Section 3.6.


Figure 2. (a) TL glow curves for different treatment before measurement; (b) TL glow curves for different treatment and the lost signal.
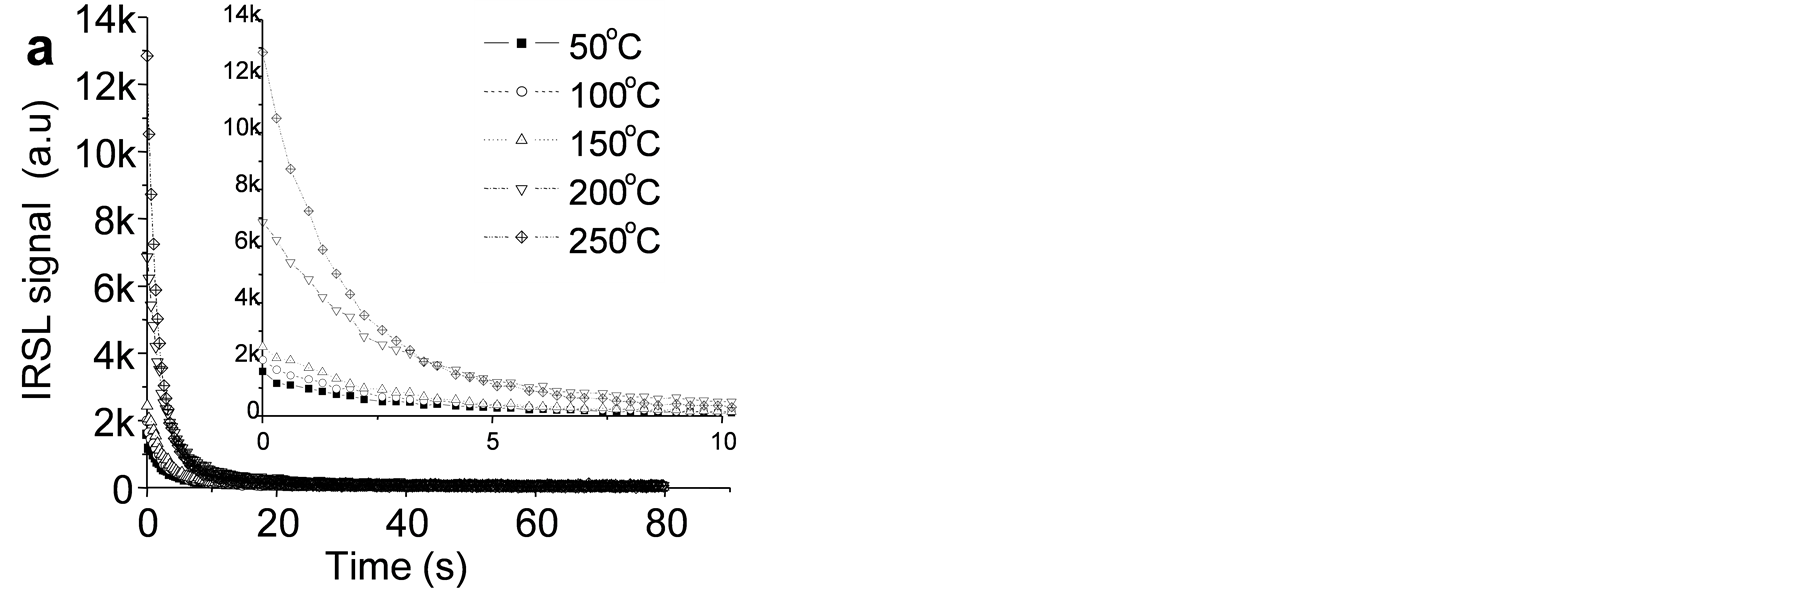
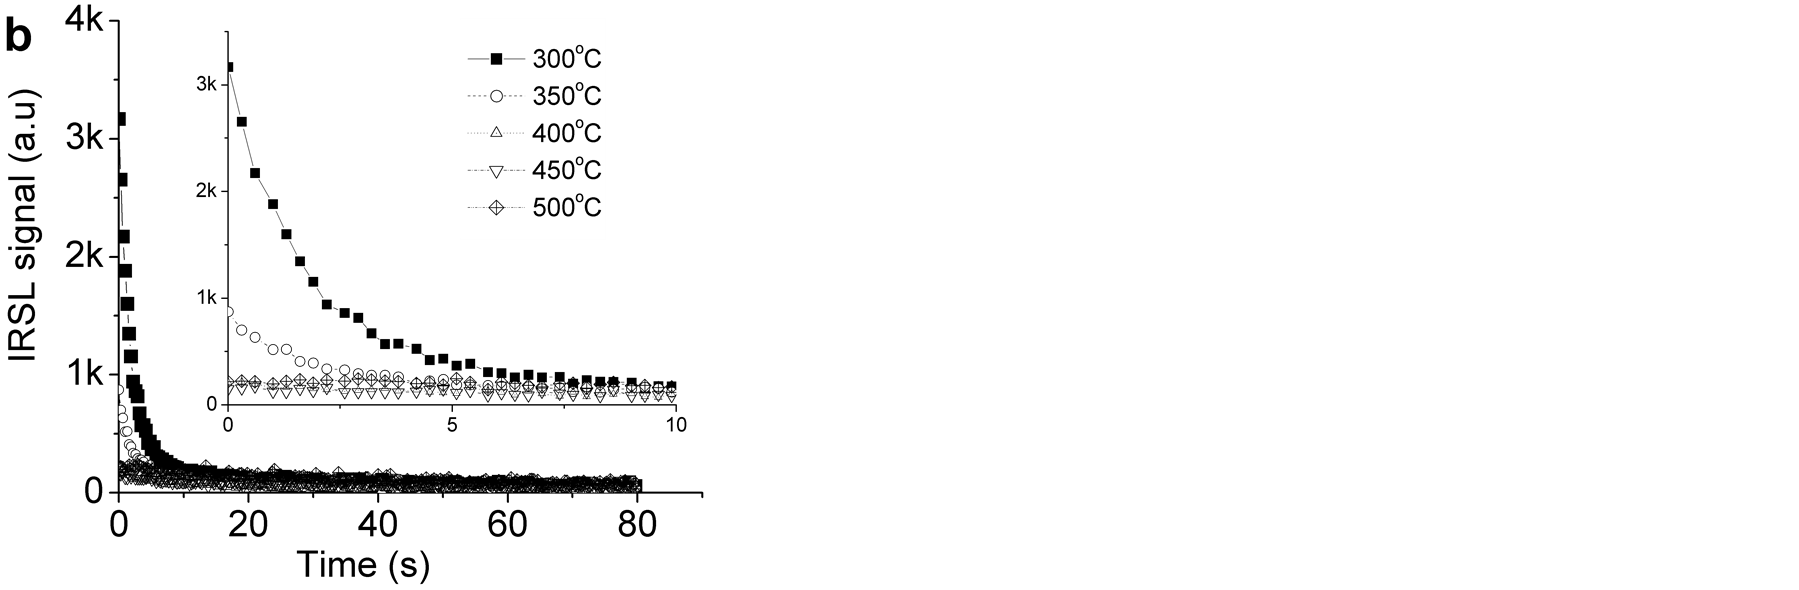

Figure 3. (a) (b) IRSL decay curves at different stimulation temperatures; (c) The plot of net IRSL intensity against stimulation temperature.
3.4. Effect of Prior IR Stimulation on TL
The effect of prior IR stimulation on TL trap stability was investigated. Two aliquots were heated to a temperature of 500˚C to remove the natural signal and then irradiated with a beta dose of 2 Gy. The irradiated samples were preheated to a temperature of 200˚C at a heating rate of 5˚C/s and maintained for 10 s. Samples were then illuminated with IR for different times. TL measurement was done at a temperature of 500˚C with a heating rate of 5˚C/s after each illumination. The effect of 0, 1, 10, 100 and 1000 s of IR stimulation on the TL signal is shown in Figure 4(a). As shown in the figure, TL signal is reduced by IR stimulation and the longer the stimulation, the more pronounced the effect. Unlike those reported by Panzeri et al. (2012), there was no emission at low temperature due to phototransfer (see insect) [14] . The TL signals after IR stimulation subtracted from the TL signal without stimulation is shown in Figure 4(b). The lost TL signal shows that the 240˚C peak is reduced by IR stimulation. It is also observed that there is no shift in the peak position of the lost TL signal.
3.5. Dose Response
The dependence of TL and IRSL intensities on dose was examined. TL and IRSL signals were measured for doses ranging from 0.41 to 3.29 Gy. The TL intensity was obtained by integrating from 200˚C to 300˚C and that of the IRSL was obtained from the first 2 s. The dose response curves for the IRSL and TL are shown in Figure 5(a) and Figure 5(b), respectively. Both the IRSL and TL exhibited a linear response in the range of the doses considered.
3.6. Dose Recovery Test
Dose recovery experiments were performed using five aliquots each for TL and IRSL. A laboratory dose of 2.47 Gy was given to each aliquot. Samples were heated to a temperature of 500˚C in order to remove the natural signal. They were irradiated with beta dose, preheated to a temperature of 200˚C at a heating rate of 5˚C/s and maintained for 10 s. TL measurements was done for Tmax of 400˚C at a heating rate of 5˚C/s. IRSL was done at a stimulation temperature of 250˚C for 80 s. The well established SAR protocol was employed using six regeneration doses with the first regeneration dose recycled. A test dose of 0.41 Gy was administered. All the aliquots for both IRSL and TL passed the criteria of a good recycling ratio and a very low recuperation effect. This suggests good repeatability of sensitivity-corrected luminescence signal [13] [23] .
The ratio of the measured dose to the given dose is shown in Figure 6(a) and Figure 6(b) for IRSL and TL, respectively. The known doses for the IRSL and TL could be recovered to within 6%. The dose recovered for the IRSL measurement ranged between 2.33 and 2.53 Gy with a mean value of 2.42 ± 0.09 Gy. That of the TL ranged between 2.56 and 2.59 Gy with a mean value of 2.57 ± 0.02 Gy. The errors quoted are standard deviations of the mean values. No significant overestimation was observed in the recovered doses. This suggests that the currently applied SAR is applicable to the sample considered in this work.

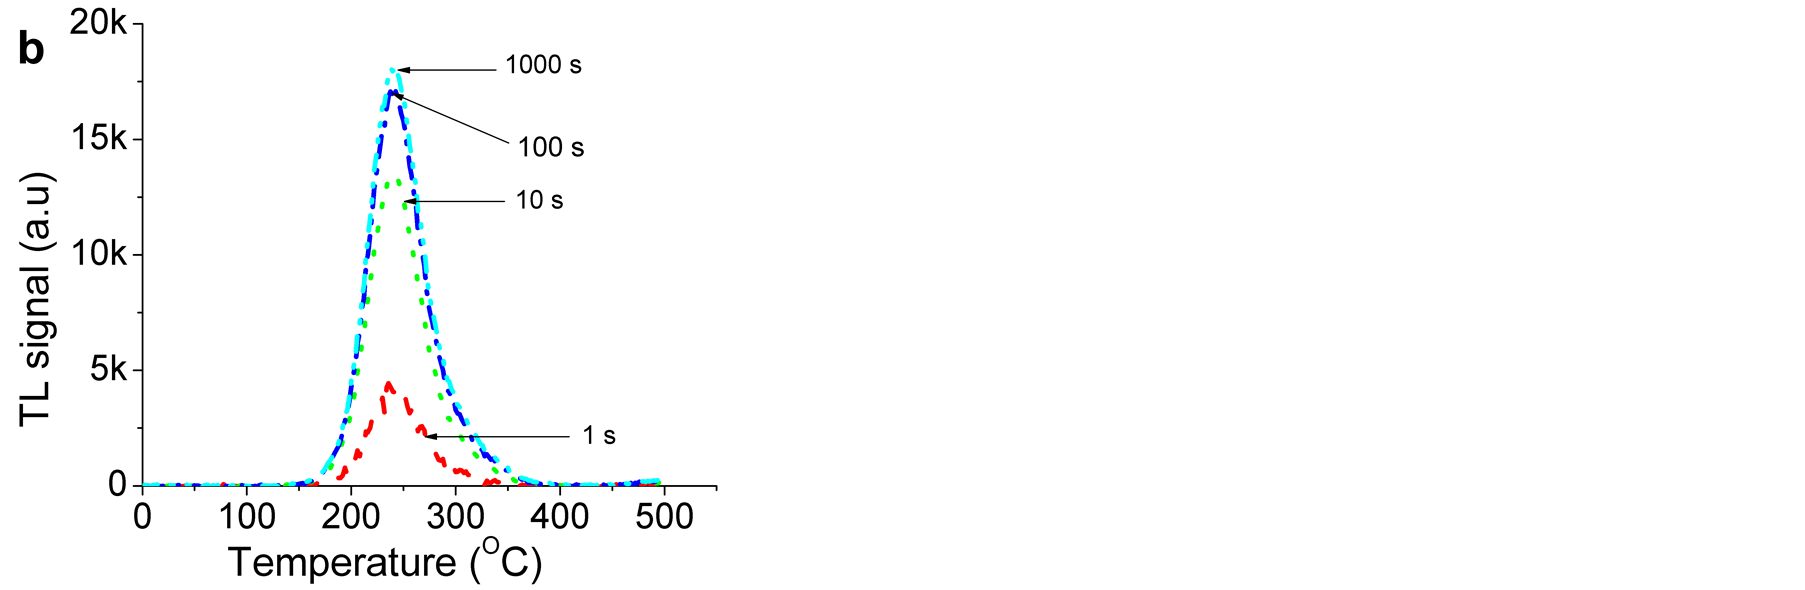
Figure 4. (a) The effect of IR stimulation time on TL; (b) the lost signals for the different IR stimulation time.


Figure 5. The relationships between the intensity and dose for (a) IRSL signal and (b) TL signal.


Figure 6. The ratio of measured dose to given dose for dose recovery test for a given dose of 2.47 Gy. (a) Infrared stimulated luminescence; (b) Thermoluminescence.
4. Conclusion
Luminescence characteristics of feldspar obtained from Ibadan, Southwestern Nigerian have been investigated in order to examine its potential for dosimetry. The feldspar sample exhibited a strong radiation-induced TL and IRSL signals. Unlike previous studies no high temperature TL peak was observed. No emission at low temperature due to phototransfer was observed in prior IR stimulation on TL. The IRSL stimulation temperature of 250˚C resulted in the maximum obtained net IRSL intensity. The dose response curves for both the TL and IRSL exhibited a linear relationship. The results of dose recovery tests showed no significant overestimation of the recovered doses. Further investigation on the effect of stimulation temperature on anomalous fading of the feldspar will be carried out.
Acknowledgements
The author would like thank the Alexander von Humboldt Foundation for the fellowship award and Dr. C Woda and all the other members of Anthropogenic Environmental Radiation research group of the Institute of Radiation Protection, Helmholtz Zentrum München.