Flaw Detection Capability and Sensitivity in the Inspection of Nuclear Containment Liner and Shell Mock-Ups Utilizing a Magnetostrictive Sensor (MsS) Guided Wave UT Technique ()
1. Introduction
At a nuclear power plant, the containment building is of primary importance for safe operation. The primary containment and other safety related structures at a nuclear plant site must be capable of maintaining their design features for the operating life of the plant. Demonstrating the satisfactory condition of the containment building and other safety related structures is required for long-term operation of the plant, particularly when plant operation beyond 60 years is considered. Many pressurized water reactors (PWRs) have liners and most of those liners have concrete poured inside of them to form a floor. ID corrosion can occur in locations where there is an interface between the liner and the concrete. This location where the liner goes behind the concrete is a location of susceptibility to corrosion that is generally inaccessible via visual inspection. Water seals are typically installed at this location and they have the potential to be damaged or degrade over time in service, resulting in water intrusion between the concrete and the liner. Liner corrosion in the region from the ID was noted at twenty three PWRs—all caused by coating failures or moisture barrier degradation [1] -[3] . Much of the corrosion from the OD has occurred because of foreign material that was left in the concrete during initial plant construction. The drywell shells of boiling water reactors (BWRs) are also susceptible to ID and OD corrosion. Corrosion has been noted at Oyster Creek, Dresden, Hope Creek, and other commercially operating plants [4] [5] . The OD areas in the sand cushion region and in the ID near concrete that has been poured are also susceptible to corrosion over time. This operating experience shows that PWR and BWR liners are susceptible to corrosion if foreign objects were left in the concrete when it was initially poured and if these foreign objects are in contact with the metallic liner. The motivation for the current work was to demonstrate the ability to detect and quantify degradation in visually inaccessible areas of containment liners and shells, to allow informed decision making with regard to long-term operation of nuclear plants to be made.
Due to the fact that these locations where corrosion has been observed are generally inaccessible via visual inspection, there is a need to develop data on the feasibility of nondestructive examination (NDE) techniques that have the possibility of a high probability of detection (POD) for flaws. Guided waves (GW) are structure-borne elastic waves that propagate along the length of plate, guided by and confined within the inner or outer boundary of plate. This unique feature is a very capable tool for long-range plate inspection from a single probe location [6] [7] . Since the wave is guided by the plate boundary, the boundary decides on the wave modes and propagating velocity. The Magnetostrictive sensor (MsS) generates and detects ultrasonic guided waves electromagnetically in the material being tested. For the generation of ultrasonic waves, the sensor relies on the Magnetostrictive (or Joule) effect; which is the manifestation of small changes in the physical dimensions of ferromagnetic materials (on the order of several parts per million in carbon steel) caused by an externally applied magnetic field [6] . For wave detection, it relies on the inverse magnetostrictive (or Villari) effect. The change in the magnetic induction of ferromagnetic material is caused by mechanical stress (or strain). Since the probe relies on the magnetostrictive effects, it is called a magnetostrictive sensor (MsS).
A feasibility study was conducted in three stages to enable the inspection of the mockups at the following fabrication intervals: 1) Inspection of the liner and shell components with welds and studs but prior to concrete being placed and with no flaws; 2) Inspection of the mockup liner and shell components following the introduction of flaws meant to simulate potential in-service degradation but prior to placement of concrete; 3) Inspection of the mockup liner and shell components with flaws and with concrete placed and cured. The purpose of performing the inspections iteratively in the above described manner was to attempt to quantify the effect of signal attenuation in the GW method as a result of both flaws and concrete.
2. Mock-Up Design and Construction
To demonstrate the adequacy of the magnetostrictive sensor inspection technique for inspection of inaccessible metallic liner and shell surfaces, a number of mock-ups were constructed at LPI Inc.’s facilities in New York City. The mock-ups were designed to provide a full-scale, accurate representation of a PWR containment liner and a BWR drywell shell. Prior to construction, CAD drawings were prepared to provide a visual rendering of the fully fabricated assemblies. The PWR containment liner mock-ups were represented by two different mock-up constructions. One was for the transition of the external wall liner into the containment floor concrete. This is shown in Figure 1. A second mock-up was prepared for demonstrating a degradation screening process for a straight wall. The straight wall was meant to simulate an area where classical manual UT could be performed but would be too time consuming. This mock-up is shown in Figure 2. One of the benefits of guided wave UT is that since it is a technique capable for long-range plate inspection from a single probe location, it could be used as a “screening” process to quickly identify regions of interest for more detailed follow-up NDE
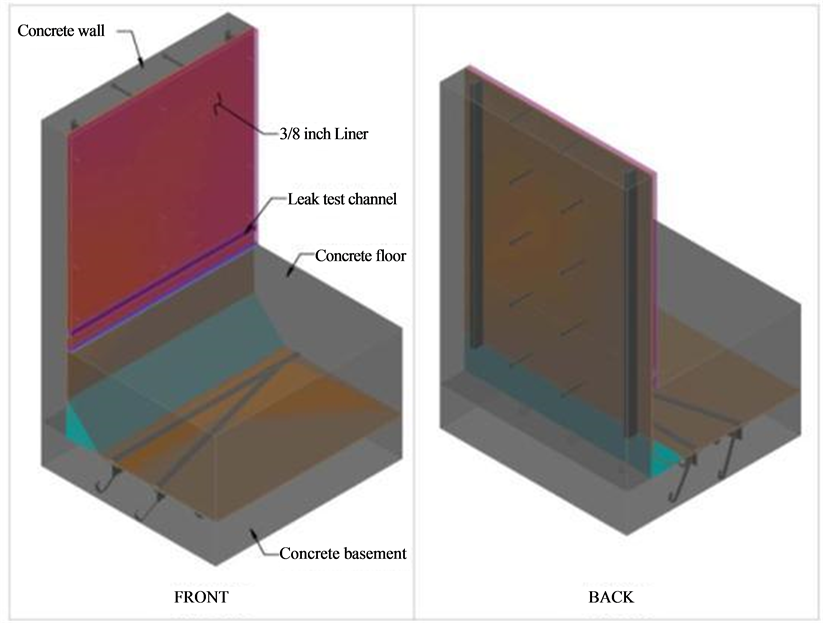
Figure 1. Rendering of mock-up of PWR containment wall liner.
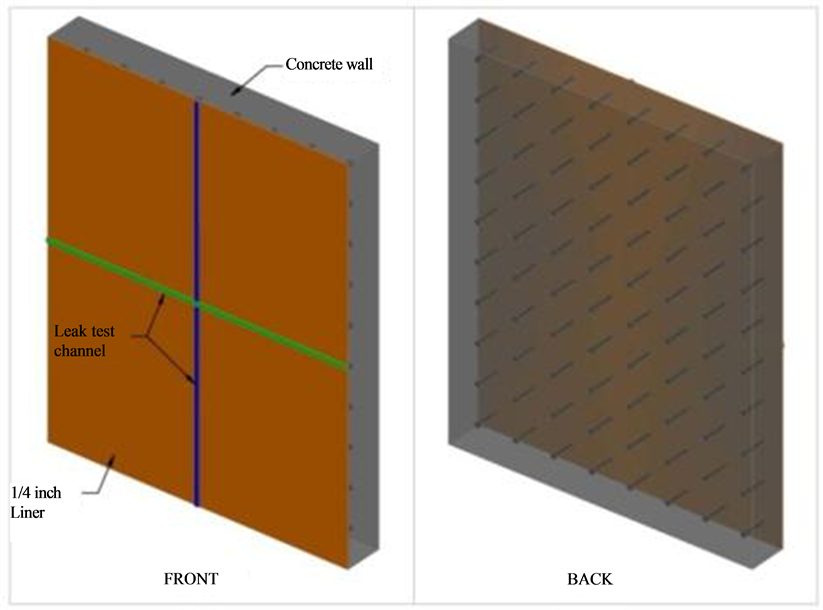
Figure 2. Rendering of mock-up of PWR flat wall liner.
inspection when utilized in the field at an operating plant. This NDE methodology provides redundancy to the overall inspection process that decreases the probability of false positives, increases the overall detection capability, and does both of the former in a cost-conscientious manner. The BWR drywell mock-up included the drywell shell adjacent to the sand cushion region. This is shown in Figure 3.
The mock-up shown in Figure 1 is a replica of a typical liner design and includes liner plate butt welds, attachments, and surrounding concrete. The liner plate is 3/8 (0.375) inch (0.95 cm) thick along the wall and the curvature into the floor where it transitions at a weld to 1/4 (0.25) inch (0.64 cm) thickness. An additional weld in the floor region created a triangular steel section and an irregularly shaped steel section. Testing of this mock-up was performed to demonstrate the extent of the coverage of the MsS guided wave inspection system into the embedded liner and beyond the 90 degrees curvature where significant signal attenuation was anticipated due to contact with the steel embedment, welds, and concrete. The mock-up was oriented in the field-observed position with the containment wall concrete oriented vertically and the floor oriented horizontally. The potential effects of concrete bonding, concrete shrinkage, and deadweight on horizontal surfaces were then examined.
The mock-up of the straight wall shown in Figure 2 represents a typical wall where the liner is exposed on one side and is backed by reinforced concrete on the other. The liner plate is 1/4 (0.25) inch (0.64 cm) thick. It contains butt welds and stud attachments on the concrete side. The mock-up of the BWR drywell shell demonstrated the feasibility to inspect the area of a nuclear plant which is embedded in the concrete and adjacent to the sand cushion. The shell was 1 1/8 (1.125) inch (2.86 cm) thick, which closely represented the field observed shell wall thickness. This increased thickness necessitated a change in the GW inspection system parameters, most notably the use of a lower frequency range.
The steel shell and liner components for the three mock-ups were fabricated at a company specializing in the
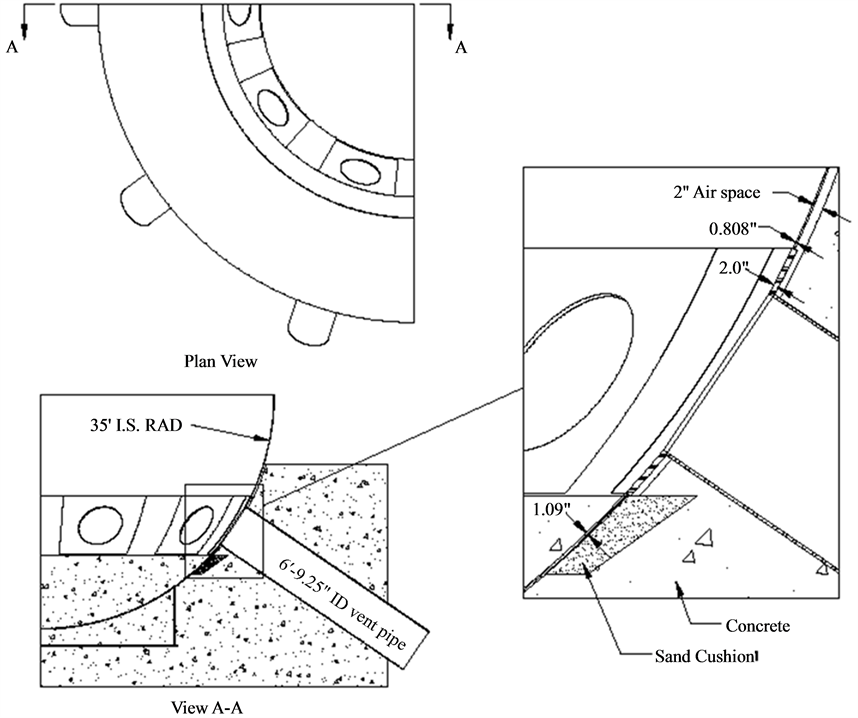
Figure 3. Rendering of mock-up of BWR drywell shell.
rolling of steel. The parts were delivered in pieces and all welding and final assembly was performed on site at LPI’s laboratory facilities in New York City. The mockups were assigned the following nomenclature during testing: “BWR” for the BWR shell mockup, “A” for the PWR straight wall mock-up, and “G” for the PWR basemat mock-up.
Following assembly of the steel liner and shell components, the three mockups were inspected with the GW technique prior to any flaws being machined into them and prior to any concrete being poured, in order to gain a baseline reading. Figure 4 and Figure 5 show the mockups prior to flaw insertion and concrete placement, while Figures 6-9 show the fully constructed mock-ups after flaw insertion and concrete placement. Flaws were placed on both the ID and OD sides. A coordinate system for each mockup was developed and the coordinates for all flaws was identified. Replication of all flaws was performed before concrete was poured so flaw topography could be maintained for future inspections.
3. Experimental Procedure
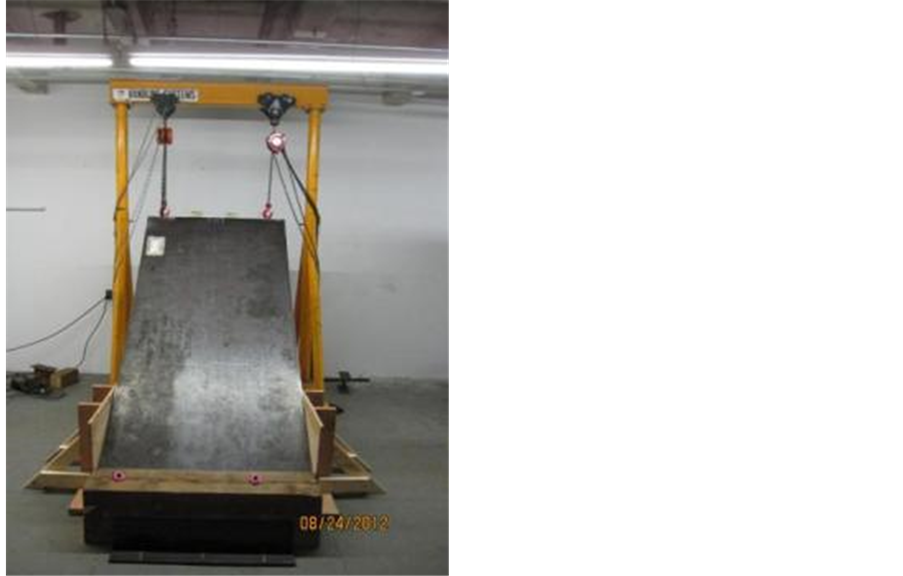
The model MsSR3030R instrumentation and probe (Guided Wave Analyis LLC, San Antonio, TX) shown in Figure 10 were utilized to perform the guided wave testing. The operating software in the laptop computer controlled the operating parameters of the MsSR3030R instrumentation. Data was acquired through a USB port between the probe and laptop. The MsS probe consisted of a thin iron cobalt (FeCo) ferromagnetic strip and plate probe, which was used to apply a time-varying magnetic field to the nuclear mockups being tested. The instrumentation captured magnetic induction changes in the steel liner and shell components caused by the guided waves. The directional control of the wave propagation was achieved with this system by employing a phased array approach with two sensors. The GW was controlled such that propagation along one direction on either side of the MsS probe could be distinguished and separately evaluated.
Figure 11 shows dispersion curves that plot wave velocities at different frequencies propagating in 0.375- inch-thick (0.95 cm) plate. The plate has three wave modes: Symmetric Lamb wave (S), Asymmetric Lamb wave (A), and Shear-horizontal wave (SH). Except for the SH0 wave mode, the velocities of other wave modes are dispersive and vary with the wave frequency. The velocity of the SHO-wave, however, is constant (that is,
 (a)
(a)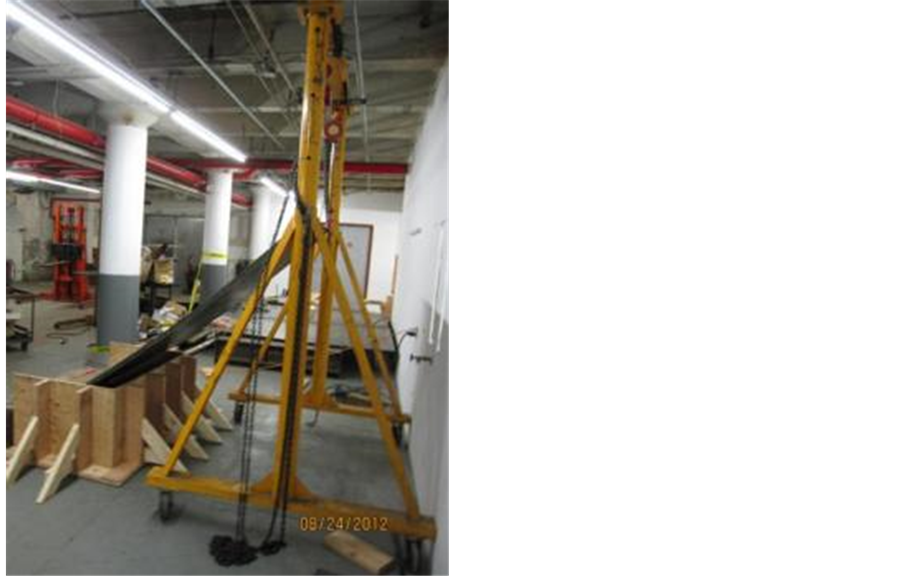 (b)
(b)
Figure 4. (a) Front and (b) side view of the BWR mock-up prior to concrete placement.
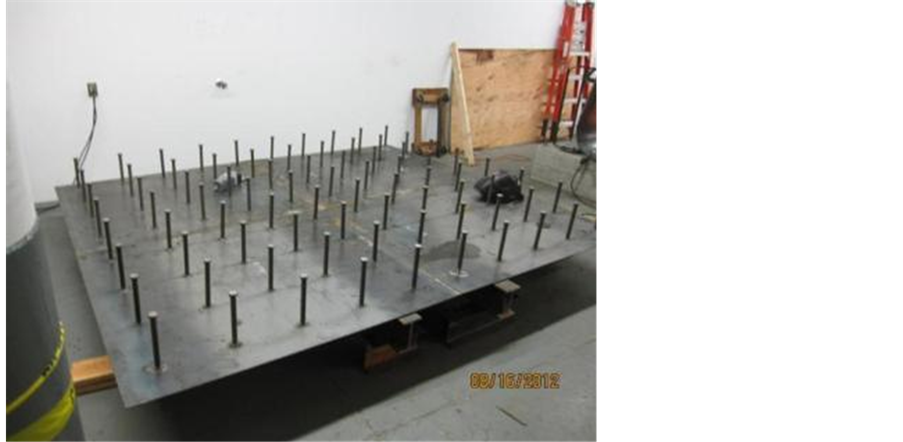
Figure 5. The straight wall PWR mock-up, “A”, lying with its OD side sticking up following welding of the four quadrants.
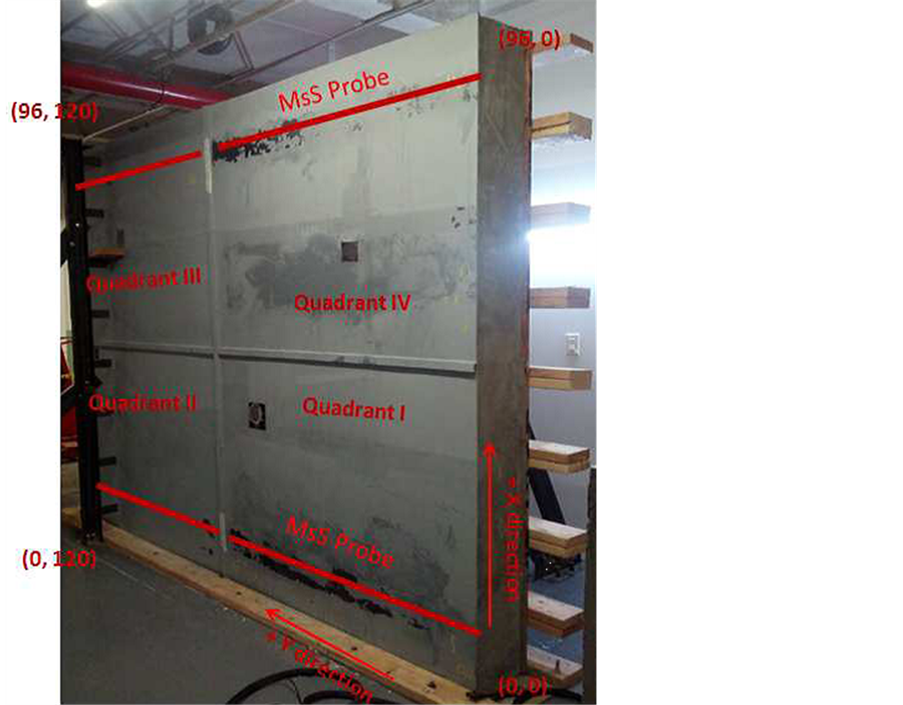
Figure 6. The PWR wall mock-up, “A”, in the upright position following placement of concrete. Orientation of the four mock-up quadrants, the mockup coordinate system for flaw location, and location of the Magnetostrictive sensor (MsS) probe placement noted in red.
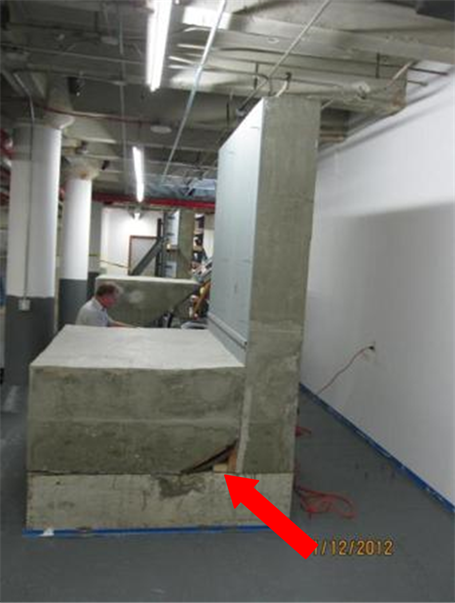
Figure 7. The PWR basemat mockup, “G”, following placement of concrete. Red arrow points to curved region of the liner.
 (a)
(a) (b)
(b)
Figure 8. (a) Front and (b) side views of the fully constructed “BWR” shell mockup.
equal to the shear wave velocity of the plate material) and thus is independent of the frequency. This property means the SHO wave is non-dispersive so that its wave form does not change as the wave propagates a long distance. Therefore, the SHO wave mode is mostly used for the inspection of steel plate samples and was used for the evaluation of the nuclear mockups.
A scan was initially performed on the three mockups (labeled “A”, “G”, and “BWR”) using the model MsSR3030R instrumentation prior to introduction of flaws and placement of concrete to generate a baseline signal response. The procedure utilized to acquire data included cleaning the steel liner and shell surfaces prior to testing. Any dirt or superficial corrosion was wiped off. If these tests were to be performed in the future
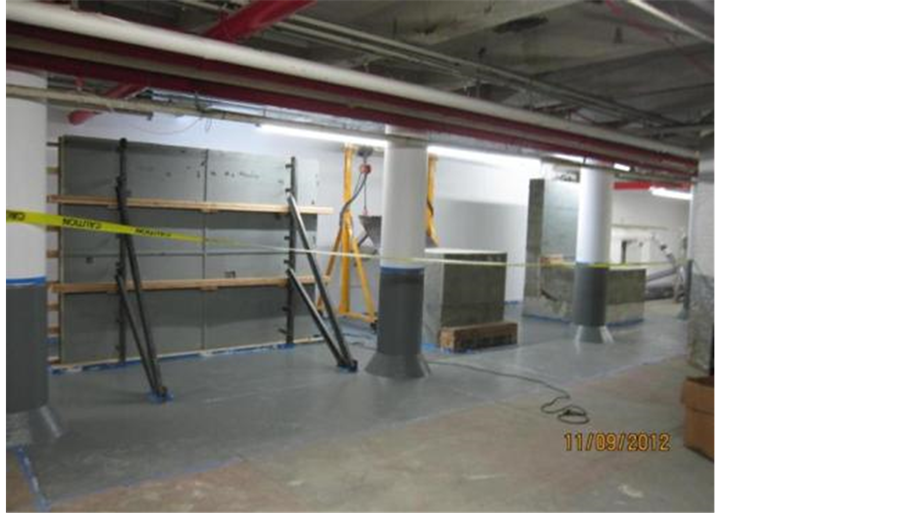
Figure 9. Appearance of the three fully constructed mock-ups.
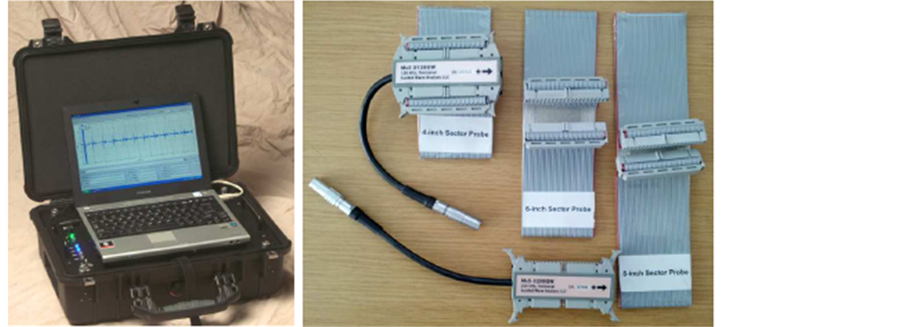
Figure 10. MsSR3030R equipment and MsS plate probe used for inspecting mockups.
on-site at an operating plant and the test surface was rough, a wire brush or sand paper would additionally be used for surface preparation. Following surface preparation, FeCo strips of suitable length were prepared and attached at exposed steel locations via a wax bonding technique. The wax bonding technique was removable and did not damage the steel surface. Mechanical coupling, shear coupling or epoxy bonding are also considered suitable for attachment of the FeCo strip. Tape was placed over the length of the FeCo strip and position coordinates were marked on the tape. The FeCo strip was then conditioned (magnetized) for shear-horizontal mode operation. The MsS probe was then connected to the MsSR3030R instrumentation and placed on the object under test. Data was then acquired and analyzed, as shown in Figure 12. This procedure was followed on all mockups for all three stages of testing.
4. Results and Discussion
One result revealed from performing the baseline scans was that the thickness of the steel liner or shell under inspection affected both the allowable and the optimal test frequencies. For the “BWR” mockup, which was 1.125 inch (2.86 cm) thick, data were acquired at nine locations along the vertical y-axis direction with the horizontal
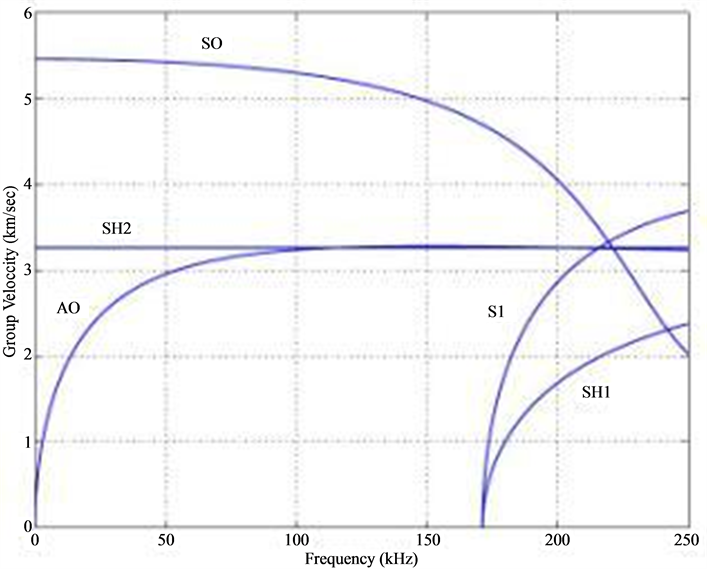
Figure 11. Dispersion curves of 0.375-inch-wall (0.95 cm) steel plate.

Figure 12. Baseline data acquisition of “G” mockup with MsS instrumentation.
x-axis position being held constant following placement of the FeCo strip. Two different lengths of MsS probe, 4 in. and 8 in. were used to acquire baseline data. Data from the 4 in MsS probe were acquired at center frequencies of 64, 90, and 128 kHz and two cycles. The resulting data plots for this mockup with the probe located at the (−26, 12) coordinate position are shown in Figure 13 and Figure 14. The data shows one end-reflected
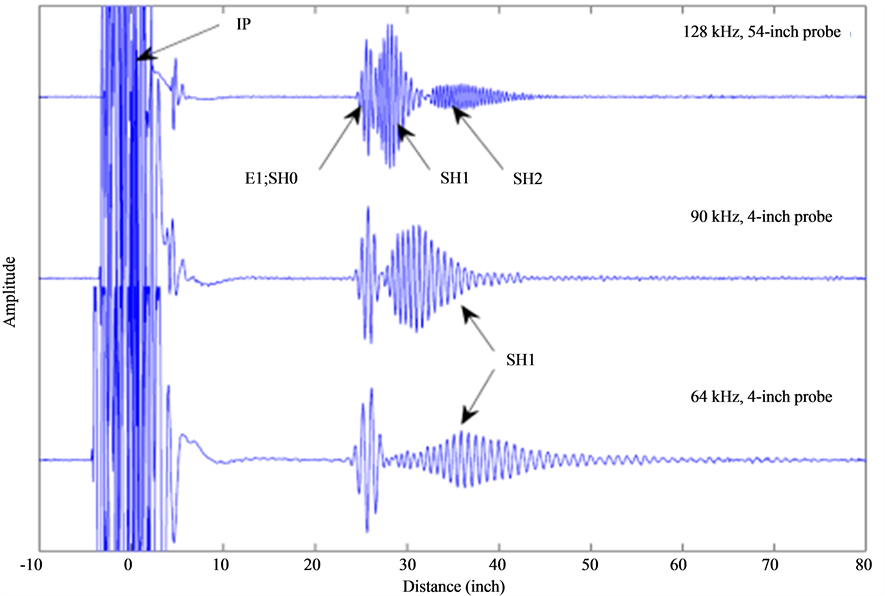
Figure 13. RF data plot acquired with 4 in. long MsS plate probe located at (−26, 12).
signal, E1, for three different shear-horizontal wave modes (SH0, SH1, and SH2). The spectrogram data of Figure 14 shows the dispersive characteristics of the SH1 and SH2 wave modes. The dispersion curve for the BWR mockup is shown in Figure 15 for shear-horizontal wave modes only. The cutoff frequencies for SH0 through SH4 are shown with respect to group velocity in Figure 15. The cutoff frequency is defined as the frequency at which the mode does not remain purely guided, or in other words, when a guided wave mode is converted into a radiation mode. The effectiveness of the subject NDE technique requires that the wave remain guided. The cutoff frequencies for the SH1 and SH2 wave modes were determined to be 57 kHz and 115 kHz. In an attempt to remove the dispersive SH1 and SH2 wave modes, follow-up data was acquired at lower frequencies of 32 kHz and 45 kHz, however the resulting data did not have a high signal-to-noise ratio (SNR) for end-reflected signals. It was determined that at frequencies of approximately 90 kHz and higher, the amplitude of the SH1 mode is approximately equal to the SH2 mode. For this reason, during subsequent inspections this higher operating frequency was used and the number of cycles was increased. The two operating conditions found to generate the best SNR for detection of flaws were determined to be 1) 82 kHz, 5 cycles and 2) 138 kHz, 5 cycles. The liner mockups “A” and “G”, which were only 0.375 in. and 0.25 in. thick, did not have the same limitations with dispersive waves as was found with the “BWR” mockup.
Various types of flaws were introduced into all three of the mock-ups in order to simulate flaws typical of in-service degradation, such as pitting and corrosion, as well as flaws typically used in the evaluation of nondestructive systems, including flat bottom hole (FBH) flaws and cluster-type flaws of multiple FBHs in close proximity. The flaws and the number of flaws were selected to determine the feasibility and sensitivity of various inspection techniques. The flaws would have been different if they were to be used for qualification of
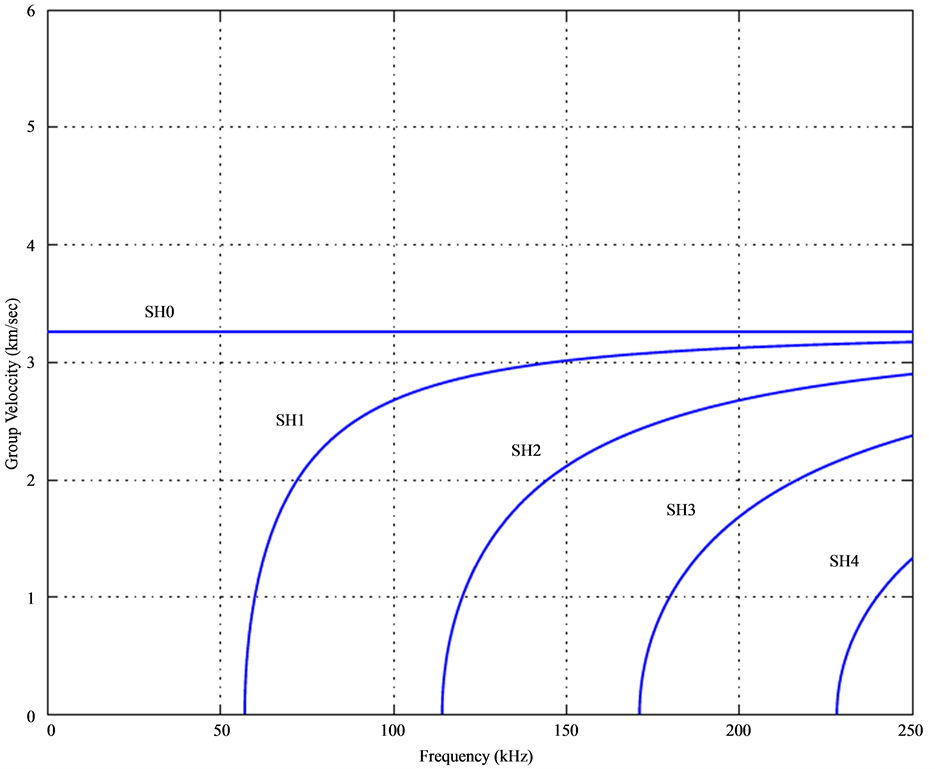
Figure 15. Shear-Horizontal mode dispersion curve for BWR mockup.
inspectors. In all cases, a point of origin and coordinate system were selected for each mock-up, and the exact location of flaw placement was noted in order to compare with future inspections after concrete placement obscured visual observation of flaws. Flaws of varying depths and diameters were placed on both the ID and OD sides of the mock-ups, as shown in Figure 16, and a flaw map legend was developed to facilitate the quantification of each NDE technique with respect to flaw detection. A full description of the flaw map and inspection results is provided in reference [8] . Prior to pouring of the concrete, all flaws were replicated and then filled with a non-conductive epoxy mount material to inhibit intimate contact of the concrete with the flaw.
For the “BWR” mockup, six flaws were inspected from the ID side and five flaws from the OD side. The MsS guided wave UT system was able to detect all six flaws (6/6) on the ID side prior to concrete placement, and three of five flaws (3/5) on the OD side prior to concrete placement. Following placement and curing of the concrete, the system detected 5/6 flaws on the ID side and 2/5 flaws on the OD side. Flaws that were not detected prior to concrete were not detected after concrete had been poured. The flaw type with the lowest detectability was the “scalloped” flaw, which had an irregular shape and was meant to simulate actual in-service wall loss. Both the diametrical size of the flaw as well as the depth of the flaw affected detection capability.
For the “G” mockup, nine flaws were inspected from the ID side and four flaws from the OD side. The MsS guided wave UT system was able to detect 7/9 flaws on the ID side and 4/4 flaws on the OD side prior to concrete placement. Following placement and curing of the concrete, the system detected 7/9 flaws on the ID side and 3/4 flaws on the OD side. As was the case with the BWR mockup, flaws not detected prior to concrete were not detected after concrete had been poured. Flat-bottom hole (FBH) and cluster type flaws were in general more easily detectable than scalloped type flaws. Detection of pitting flaws depended on flaw depth. In general, the presence of welds significantly attenuated the signals from the NDE technique. The presence of a liner thickness deviation at the weld location in the basemat region of the mock-up also significantly lowered flaw detection capability.
For the “A” mockup, three flaws were inspected from the ID side and 13 flaws from the OD side. The MsS guided wave UT system was able to detect 3/3 flaws on the ID side and 11/13 flaws on the OD side prior to concrete placement. Following placement and curing of the concrete, the system detected 3/3 flaws on the ID side and 10/13 flaws on the OD side. Flaws not detected prior to concrete were not detected after concrete had been poured. Sensitivity to flaw detection was decreased for flaws in close proximity to mockup features such as studs or leak-tight channels.
For all three stages of testing, data was acquired and evaluated by an ASNT Level III inspector certified in Guided Wave UT. In general, it was demonstrated that flaws or progressive degradation such as simulated corrosion could be detected with the GW technique in visually inaccessible areas of the mock-ups. Simulated
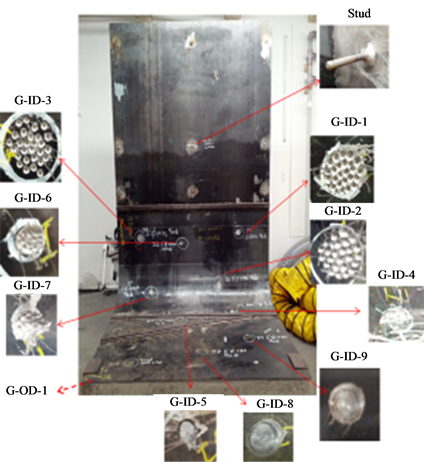

Figure 16. Various flaws inserted into both ID and OD side of the BWR and G mock-ups.
corrosion-type flaws, as small as 2 inches in diameter, were detected at a distance of several feet with the advanced NDE technique. Flaws with a scalloped-type appearance had the poorest detection capability. Significant GW signal attenuation was observed at weld locations, with an approximately 50 percent loss in amplitude observed. It should be noted that the signal effectively passed through three welds, as fillet welds were required for placement of the leak-tight channels, which were found around all full-penetration butt welds. Surprisingly, the presence of concrete had very little effect on the detection capability of the MsS guided wave system. It is believed that shrinkage of the concrete during curing permitted a small (micrometers) air gap to be present between the concrete and the metal liners and shell. This air gap allowed wave propagation over long distances. If the concrete had been in intimate contact with the liner and shell regions, it is expected that wave propagation would have been severely inhibited. The flaw sizing capability of the MsS system was not found to have adequate precision for application in operating plants, and improvement in this area is a goal of future research and development.
5. Conclusion
This research demonstrated that flaws or progressive degradation such as simulated corrosion could be detected with the GW technique in visually inaccessible areas of the constructed nuclear containment mock-ups. Simulated corrosion-type flaws, as small as 2 inches in diameter, were detected at a distance of several feet with the advanced NDE technique. In general, the presence of welds significantly attenuated the signals from the GW technique. The presence of a liner thickness deviation at the weld location in the “G” mock-up also significantly lowered flaw detection capability and increased signal attenuation. Future research in optimization of the flaw sizing ability of the MsS instrumentation would be required before implementation of the technique could be pursued in an operating nuclear plant.
Acknowledgements
This work was supported by the Electric Power Research Institute (EPRI) and the United States Department of Energy (DOE) through Idaho National Laboratory (INL).