Microclimatic Factors Effect on Productivity of Construction Industry ()
1. Introduction
It well known that there is a relationship between climate and economic activities of construction industry. It is intuitive that climate can impact outdoor activities of the construction materials manufacturing, agriculture activities, tourism especially of the projects; lost opportunity profits from projects cannot be pursued; the costs of bidding and managing projects (defensively) and so no. Besides, there are intangible costs, such as personal cost to the careers of people who are enmeshed in acrimonious disputes. Although, the costs are positive things, like reducing costs and improving the lifecycle quality, the wrong type of the change can increase the cost of the projects and reduce the economic value of a project.
Obviously, extreme climatic factor such as heat can affect projects in many ways, the most importantly by disrupting and impairing a project’s labor productivity. Different types of changes have been studied by research workers: weather, schedule acceleration, and so forth. Postulated that change implemented late in a project will have more unsettling impact on labor productivity than the same change implemented either in the project [1] .
A number of papers investigate sourcing strategies when supplies have varying reliability [2] -[4] while some work investigated disruption empirically by [5] . There are none of these cases are connection made between timing changes and severe weather.
Previous studies exist on the subject of discrete timing impact than on the subject of accumulative impact. Some of the studies are based on scientific research methodologies where empirical data are collected and analyzed, and others are controlled. A study on overtime portrays the effects that extended periods of overtime of 55 hours work weeks for 1 - 14 weeks have on labor productivity. In the reality of this study [6] is extrapolation of a series of small, independent projects over a 10 year period time. The outcome of the results from this data is imperfect.
The effect of temperature and humidity on productivity study was conducted by [7] -[9] tested the effects of schedule acceleration on productivity. [10] examed the amount of change for different project delivery systems.
The impact of timing changes on productivity was not examined.
[10] studied the timing changes on productivity but this study did not prevalence of bad weather which the results can be expected to become more relevant as climate change may increase the severity and frequency of severe weather, particular of construction industry to long-term changes in climate conditions and in the a short-term to changes in the weather is grown concern to many states in the region officials.
The objective of this study is to confirm that weather can be used as an exogenous shock in construction industry timing and production, which is useful in the development of valid instrument for other research. in hot regions.
[11] reported that less clear is the impact on climate insensitive section such as manufacturing and services.
Changes in production and timing especially when it results in protracted disputes and litigation is a serious and expensive problem for the construction industry. The changes in production and timing were pervasive and added about 6% to the direct cost of 22 government projects [12] [13] found averages can be deceiving: 50% of the 24 Canadian projects in this data set had cost claims for more than 30% of the original bid value. These 24 projects also had large claim for time extensions, in some cases 80% of the original contract duration.
[14] reported that the value of construction work put in the place in 1997 was $1.3 trillion. 6% changes in timing and production rate of the value ($1.3 trillion) were direct costs ($78 billion per year. In addition there are indirect costs such as higher insurance rates; delayed commissioning This study focuses on the construction industry, which offers several advantages; it is economically significant industry, there are many geographically dispersed assembly plants operated by a number of different companies, and detailed production data is available over a long period of time at the weekly level rather than monthly. However, it is clear which extend these results carry over to other industries with similar weather and depends on the underling mechanism.
This study data has been collected over five year’s period. The first is weekly production of construction materials plants. The second includes the daily weather conditions at gulf regional samples. A disputed and no disputed manufactures have now been benchmarked from 22 contractors in four different locations at the region. The manufacture samples are public and private sectors. The manufacture size ranges between $300 million and $3 billion. The projects are light and heavy building materials. Both types are commercial and industrial.
Manufacture production, labor hour, cost were selected at 20%, 40%, 60%, 80%, 100% milestones of design and construction phases. Regression analysis was done for the available data.
Productivity values analyzed here are cumulative; end the manufacture productivity can be calculated As follows:
 (1)
(1)
Where Pum is unimpacted productionWHum is unimpacted work hoursPim is the impactedWhim is the impacted work hours.
Table 1 defines the main weather variable used in our analysis. Heat is the number of days in a week in which the extreme temperature for the day exceeds a threshold 40 Celsius. Heat is included because it could influence ambient temperature within the plant or employees that must work outside. Many of variables, such heat directly capture extreme weather shocks. Wind & dust storms are numbers of days in a week in which a wind & dust storm advisory was issued by the region weather stations offices.
Long term dust storm data were recorded in four locations. The aim of collecting visibility data is to use the available data to estimate the effect dust storm of construction industry production. Table 2 shows an average time per year for which visibility was deduced base on five years dust at construction companies. Visibility was calculate as follows:
 (2)
(2)
V is the visibilityCa is dust concentration mg/cm3 at 180 cm height.
2. Results
The projects located in the different locations in the same region and similar segment could still have different in their production patterns. The production patterns are related to the weather then this could generate a bias in the casual effect which try to estimate. We can mitigate this kind of bias, then we propose a third set of controls which captures seasonal average weather patterns specific to a project. In this case, let Wjf a weather factor impacted variable for project j in week period, p and let W (p) be week t ’s within its year (24 weekth). Ẃ(j, w(p)) as the average weather at the project location j during a 5 week period around week w(p) across all the years (N = 4) in our study. The correlation between the project production and severe weather variables (Figures 1-3), this should be captured by Ẃ(j, w(p)) Notice that when we include this third set of control in the model, a coefficient for these weather variables are estimated using deviation from weekly average at each project.
 (3)
(3)
Table 3 represents the heat, dust storm and both variables, the coefficient shows the percentage drop in weekly production when the corresponding weather event occurs during a given week as any production recovery that might occur in each study week. For heat waves during May through September with 6 or more of days high temperature. For dust storm, the coefficient measures the percentage drop in weekly production in addition day with the indicated high wind speed. To put the impact of weather in respective, the productivity lose during the first week slab (construction materials) is introduced in 36%, similar in magnitude to the combined impact.
Table 4 represents the frequency of heat and dusty storms. Because the number of days with high temperature and dust storms advisory alert are relatively infrequent levels for this variable were defined based on visibility.
Three levels were presented with ≤10, ≤100 ≤ 200 ≤ 300 ≤ 400 and ≤500 m visibilities. The levels of visibility distance level count the number of days with minimum visibility on each level’s range. The region weather used to be hot and humid in almost 85% of the summers.
The average reduction is not statistically different across region locations it is possible to observe a statistically significant differences for the impact of heat and dust storms across the different locations. To estimate the economic impact, we measure the expected production reduction which combines the like hood of the weather incident with impact estimated in Table 4
The impact of weather on production is measured in relative terms (% of production) rather than in absolute terms. The covariates in the regression can be grouped into three categories, Factors related to project weather, seasonal variables and other productivity related factors. The model can be used as follows:
 (4)
(4)
where W is project local weather, S, seasonal factor, PF, project productivity, βi, the project average net production

Table 2. Average of visibility at the locations.
Table 3. Ranking of average total productivity lose.
Table 4. Average frequency economic impact of severe weather variable.
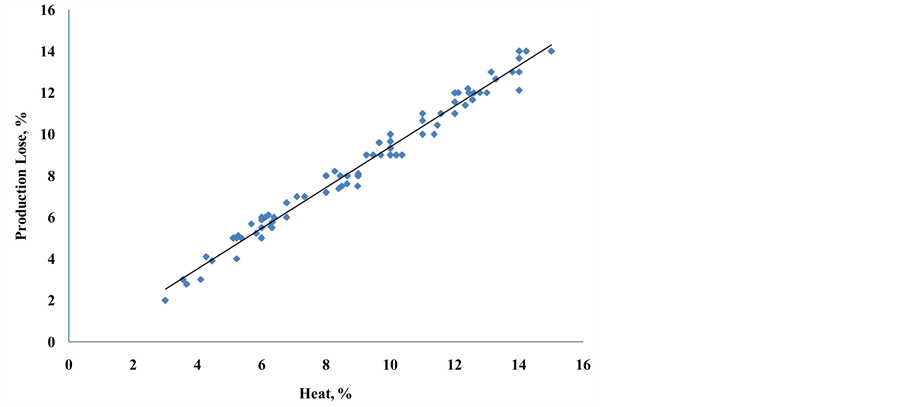
Figure 1. Relationships between heat percentage and production lose percentage.
and ρ is the error factor.
Weekly mean of daily average weather factors data for the project locations in the study period. The weather and climate factors measurements were arranged based on probability distribution for a given time period and project location. The number of days of above specific absolute threshold of heat or number of dusty days then the
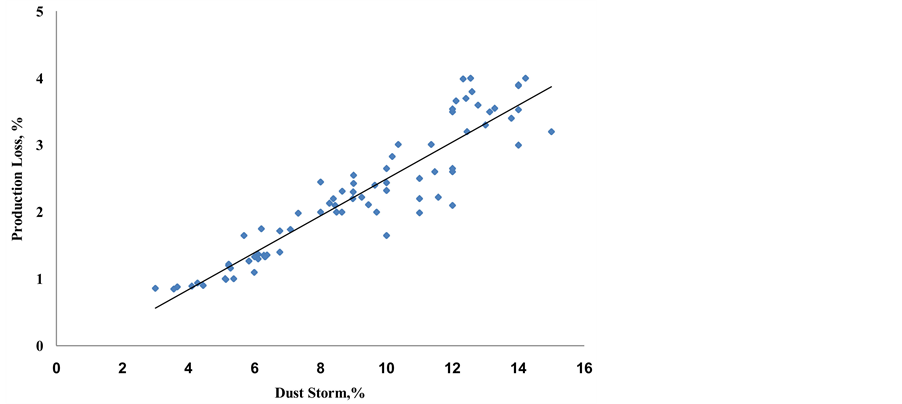
Figure 2. Relationships between dust storm percentage and production lose percentage.
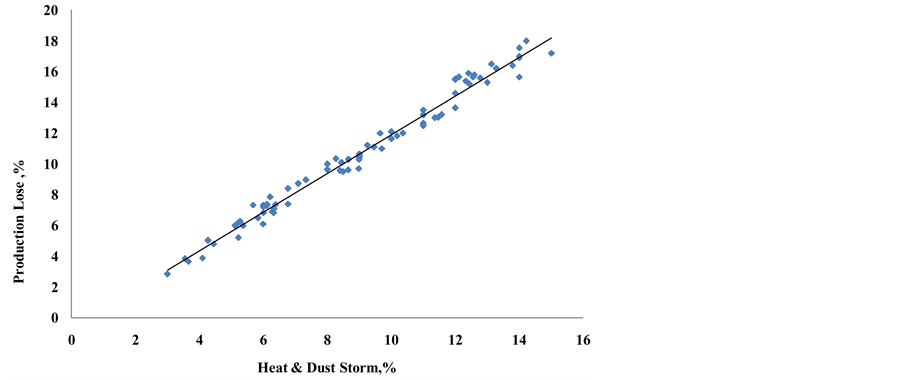
Figure 3. Relationships between heat & dust storm percentage and production lose percentage.
comparisons was made between the project regions. The impact of weather factors variation were discussed base on the statistical tests. Table 5 shows summary statistics for the weather variable. Four regions were defined that cover the location of the projects in the study; Iraq, United Arab Emirates, Kuwait and Kingdom of Arabia Saudi.
Table 6 shows the results for the four locations in our study. The weather is almost no significant differences between the locations because all location are within same region (Arid region, similar natural environment). The results indicated that the productivity lose percent due to the weather factors is not statistically different across the region it is possible to observe a statistically significant difference for impact of heat waves and humidity across the region.
The measured construction materials production lose % and the heat for the recording weekly period were shown in Figure 1
Table 5. Mean standard Deviation of heat and wind storm variables by region.
. The figure shows that the linear relationship exists between the values. By fitting the data points in the figure, the following equation was formed with a high correction coefficient, R2 = 0.98.
 (5)
(5)
The measured construction materials production lose % (%Plose) and dusty days for the recording weekly period
Table 6. Correlation values of weather variables.
were shown in Figure 2. The figure shows that the linear relationship exists between the values. By fitting the data points in the figure, the following equation was formed with a high correction coefficient in both regression types, R2 = 0.86 and R2 = 0.88.
The calculations for the weather variable that have a statistically significant effect on production as reported in The Table 4 and Figures 1-3 as we cannot reject the null hypothesis that the effect of the weather factors heat is larger than dusty storms. In this analysis than both weather factors tend to have significant economic effect on overall construction industry production.
 (6)
(6)
 (7)
(7)
3. Discussion
The projects are rank ordered according to the time when a change was formally recognized Formal recognition in this case is when one party notifies the other by either. There are some imprecision In this definition but this researcher felt it was the best choice available.
Base on the study of the gulf region construction materials projects over five years period. The results outcomes reported that local weather can have a major impact on regional projects productivity and timing which ranging from a lose 2.80% - 17.00%, 2.7% - 14.00% and 0.88% - 3.60% for total production (heat + dust storm), heat, and dust storm impact, respectively with average of total production loss of 10.8%.
If this construction industry authorized people can do better job managing confront severe weather by underlying alternative mechanisms. Part of construction materials manufacturing was done outside particular companies in Iraq, Kuwait and part in KSA. It is possible that disruption to employee’s performance is a major cause. In this matter could mitigate this factor by avoid the time of heat waves during summer and increasing work time by doubling the shifts. This approach goes against the just in time solution of lean inventory and ensuring a smooth production flow, bur avoiding production losses due to weather may justify a more flexible operating strategy. Some companies (e.g. Kuwait, Iraq) has absenteeism employee problematic because the severe weather such as heat or dusty days due to health and/or transportation problems especially, houses are not provided by plant (e.g. Iraq). In this case it is hard to develop mitigating strategies. The obvious mitigation strategy for heat is to provide cooling systems. It is possible that heat is influencing worker productivity in interface I areas between the outside and inside environments. Such as materials casting and air drying areas, because these areas be either difficult or required to be open. If these open areas are required, then maybe an investment in higher capacity cooling systems could be justified. It is not clear the extent to which construction industry are aware of the impact of weather on their productivity beyond obvious effect like a very severe heat waves or extreme atmospheric dust storms can disrupt production. Base on companies [15] , about 95% of company’s employee are Asian citizens, except Iraqi company, (5% non-Iraqi citizen). The companies’ survey reported that their experienced a weather related disruption to their supply chain, but magnitudes were not estimated and our results suggest that early all facilities may experience some form of weather disruption. Iraqi construction industry is indeed not aware then it is possible that mitigating strategies discussed above (or others like private companies could improve productivity. But if there are already aware of these effects like companies managed by government and includes our study projects, they may have already implemented all cost effective mitigation strategies. The studied region is characterized as arid region hot to very hot with dusty storms during summers, so it is difficult to follow the option to move production to more weather friendly location. Of course, moving production is costly and raises a host of other issues-labor costs, access to supplies, etc.
4. Climate Change Consequences
This work provides evidence on the impact of climate change on economics output. Climate change is forecasted to be associated with increase in severe weather in particular with heat waves during summers. The results found a direct link between extensive period of high heat and dust storms and total productivity losses. Long run forecasts on severe weather are challenging and there can be uncertainty in the direction of change in storms as well as the magnitude of the change such heat.
In addition , the construction materials industry authorization are not comfortable combining our estimation of the project productivity losses with severe weather forecasts to yield a long forecast of potential losses in the gulf region construction industry due to climate change, the author believes the impact of weather on project productivity is likely to be a growing concern.
5. Conclusion
The research concluded in this paper explored the construction industry of the gulf-region productivity at too-hot weather workplace makes it is difficult for labor to concentrate at work. There are many factors that can affect industry productivity. Weather factors include high temperatures as well as dust storms include humidity. Construction industry performance decreased with temperatures up to between 40 degrees and 50 degrees. The results of our study also suggest raising the temperature to a less comfortable thermal zone.
6. Data Source
Iraqi Construction Co. Baghdad ITP Publishing Group is part of ITP Holdings Airdeck®, Airdeck® Thermo, Molenweg 41 I B - 3530 HOUTHALEN arabianbusiness.com arabianoilandgas.com arabiansupplychain.com utilities-me.com hoteliermiddleeast.com itp.net timeoutdubai.com Al Mulla for Buildings and Construction, Kuwait Institute for Scientific Research.
ABB Suadi Industries Co. Riyadh KSA.