Potential Association between Soil and Leaf Chemical Properties, and Soybean Seed Composition ()
1. Introduction
Understanding the contribution of environmental variables to seed composition may help develop cultural and breeding strategies to produce high quality soybeans, especially due to the increasing global need of more nutritious food. Plant nutrient uptake is active during vegetative plant growth as soil extracted nutrients are incorporated into proteins to activate enzymes and contribute to the charge balance in the cell [1] . During the reproductive period, nutrients can be remobilized to seeds from vegetative tissue via the phloem, and to a lesser extent, newly uptaken by the roots via the xylem, transferred to phloem, and transported to the reproductive organs [2] [3] . Decreases in leaf element concentrations during the reproductive period have been well-documented, and have been used as evidence for nutrient remobilization in several crops [4] -[7] . Thus, factors affecting the availability of nutrients in the soil and the rate of uptake and remobilization of chemical elements by the plant have the potential to affect seed inorganic composition. Furthermore, because soil extracted nutrients are essential for plant metabolic processes, those factors also have the potential to significantly affect the organic composition of the seed [8] .
Bellaloui et al. [9] measured soil elemental concentration and soybean seed composition of field sections that differed in yield potential. Areas of low yield potential exhibited lower seed protein and oleic acid concentration than that in areas of medium and high yield potential. Areas of low yield potential had lower soil organic matter, and extractable sodium (Na), calcium (Ca), potassium (K), boron (B), and zinc (Zn) concentrations than areas of medium and high yield potential. Differences in seed protein concentration between areas were hypothesized to be caused by differences in soil Na, B, and Zn, which are important in enzymatic reactions involved in protein and nitrogen metabolism. In addition, differences in soil K between the areas studied were proposed to have determined differences in photosynthetic capacity and the consequent alteration of seed protein and oil concentrations. Similarly, Poutaraud and Girardin (2004) studied the correlation between soil chemical properties and the alkaloid concentration in meadow saffron (Crocus sativus) seeds in France. A significant positive linear relationship was observed between soil Ca and Ca + cobalt (Co) concentration and seed alkaloid concentration. The fact that the enzymes in the alkaloid synthesis pathways needed Co and that Ca prevented alkaloids from entering cell compartments, where otherwise they would be degraded, was proposed as the explanation for the observed results. No such soil-leaf-seed chemical composition studies have been conducted for soybeans grown in the mid-southern US. It is possible that soil chemical properties may have a significant effect on seed composition, as they greatly contribute to plant nutrient availability, their mobilization, and overall plant growth.
The objective of this study was to evaluate potential associations between soil properties and element concentrations in the leaf, with seed composition in four types of specialty soybeans: high protein, high oil, modified fatty acids, low phytate/low stachyose grown at two Arkansas locations in 2011.
2. Materials and Methods
2.1. Field Experiment
Eight breeding lines with modified seed composition and a high-yield check were used for this study (Table 1). Breeding lines were arranged in a randomized complete block design with three blocks. Each plot was 5 meters long and 4 rows wide. Seeding rate was 30 seeds per meter. The experiment was planted at the Arkansas Agricultural Research and Extension Center in Fayetteville, AR (36.099, −94.178), and at the University of Arkansas Vegetable Research Station in Kibler, AR (35.398, −94.232) in 2011. The soil at the Fayetteville location is mapped as Captina silt loam (fine-silty, siliceous, active, mesic Typic Fragiudult) and described as a very deep, moderately well-drained soil developed on a thin mantle of silty material [10] . The previous crop in the Fayetteville field was wheat (Triticum aestivum). Kibler soil is mapped as Roxana silt loam [10] and described as a well-drained, moderately permeable soil formed in a stratified loamy alluvium [11] . The previous crop in the Kibler field was soybean. The row spacing was 100 cm and 90 cm and planting dates were June 2nd and May 31st for Fayetteville (planted on beds) and Kibler (planted on flat ground), respectively. Field plots were fully irrigated (overhead at Kibler; furrow irrigation at Fayetteville) and managed during the growing season using standard cultural practices adopted for full-season soybean production in Arkansas [12] . Cultural practices included tillage with chisel plow and disc, and fertilization based on soil test results and recommendation of University of Arkansas Cooperative Extension Service. Weed control was performed by applying pre-plant (e.g.,

Table 1. Seed traits of soybean lines used in this study.
†all lines, except AG5605, which is property of Asgrow Seed Company, were developed at the University of Arkansas soybean breeding program. ‡see Chen et al. [13] and Chen et al. [14] for more details on these lines.
glyphosate) and post-emergence herbicides at label rates. Average temperature and rainfall for these two locations during the 2011 season can be found in [15] , which is a larger experiment the present study was part of. At maturity, the two center rows of each plot were harvested using a plot combine. Seed was stored for phenotypic analysis.
2.2. Soil Sampling, Soil Chemical Element Composition and Soil Texture Analysis
Soil samples were collected from the top 12.5 cm of each plot about one week before the beginning of the reproductive period (flower initiation). Twelve soil cores (three per row) were extracted with a 2.5 cm diameter push probe, and mixed in a plastic bucket. Soil samples were dried at 50˚C for 2 days and ground to pass a 2 mm mesh screen. Soil was extracted with Mehlich-3 extractant solution in a 1:10 soil/extractant solution ratio and analyzed for extractable nutrient concentration [phosphorus (P), K, Ca, magnesium (Mg), sulfur (S), iron (Fe), manganese (Mn), Zn, copper (Cu), and B] using a Spectro Arcos Inducted Coupled Plasma Mass Spectrometer (Spectro Analytical Instruments, Mahwah, NJ). Data were expressed in milligram of element per kilogram of dry soil. Soil pH and electric conductivity were determined with an electrode on a 1:2 soil/water paste. Sand, silt and clay were determined on dried ground soil using the 2 hours hydrometer method [16] .
2.3. Leaf Composition Analysis
Composite samples of the uppermost fully developed trifoliates were collected randomly from the four rows of each plot the same day soil samples were collected. Leaf samples were dried at 50˚C for 2 d, and ground to pass a 0.84 mm mesh screen. Samples were digested using concentrated HNO3 and 30% hydrogen peroxide on a heating block system (Environmental Express, Mt. Pleasant, SC) and analyzed using Spectro Arcos Inducted Coupled Plasma Mass Spectrometer (Spectro Analytical Instruments, Mahwah, New Jersey). Data were presented as percentage of dry tissue for P, K, Ca, Mg, S, and as milligram per kilogram of dry tissue for Fe, Mn, Zn and Cu.
2.4. Seed Composition Analysis
Protein and oil analysis. Samples containing 20 - 25 g of seed were sent to the USDA research facility at Peoria, IL or to the University of Missouri Delta Center at Portageville, MO for protein, oil and moisture analysis in a FOSS® (Eden Prairie, MN) near infrared transmittance instrument. Protein and oil concentration were presented in milligrams per gram of seed in dry-weight basis.
Fatty acid analysis. Samples containing five seeds were sent the DNA facility at Iowa State University in Ames, IA. Fatty acid concentrations [oleic acid, linolenic acid, and saturated fatty acids (sats)] were determined by gas chromatography according to the methods developed by Hammond [17] . The fatty acid concentration was presented in milligrams per total grams of oil.
Sugar analysis. Each seed sample was processed separately for sugar extraction, sugar fractionation and identification, and sugar quantification by high-performance liquid chromatography (HPLC). For a detailed description on the HPLC methods see Jaureguy et al. [15] . Sugar data were presented in milligrams of sugar per gram of seed.
Inorganic phosphorus (Pi) analysis. Seed samples were ground in a coffee grinder (Krups®, Shelton, CT) and the powder was screened through a 450-μm sieve (VWR International, West Chester, PA). A 0.1 g of soybeanseed fine powder was weighed in a 2.0 ml centrifuge tube. One ml of extraction buffer (deionized water, 12.5% trichloroacetic acid, 1 M MgCl2) was added to the tube, and the solution was vortexed until homogeneous. The solution was incubated overnight at 4˚C, vortexed again, incubated at room temperature for 30 min, and centrifuged at 1400 g for 4 min. Samples were stored at 4˚C until Pi analysis. For Pi analysis a 10 μl sample of each extract was placed in a well of a flat-bottom 96-well plate (Becton Dickinson, Franklin Lakes, NJ) containing 90 µl of deionized water. The plates included Pi standards consisting of proportional dilutions of K2PO4 in deionized water. Standards and samples were allowed to react with 100 μl of Chen’s reagent (6 N sulfuric acid, 2.5% amomiummolybdate, 10% abscorbic acid, deionized water) for 1 h, and absorbance at 882 nm was measured in a plate reader (Biotek, Winooski, VT). Samples were analyzed in batches of 96, and all the samples were analyzed with the same batch of reagents. A sample of breeding line CX1834-1-6 (high Pi/low phytate) and cultivar Osage (low Pi/normal phytate) were also included in each batch of samples as controls for the extraction process. Inorganic P concentrations were determined by linear extrapolation using the formula µg Pi in sample = μg Pi in standard/curve slope. The conversion factor was calculated according to the changes in concentration that Pi undergoes during extraction procedures. Data were presented as micrograms of element per gram of seed.
Chemical element analysis. A sample of seed fine powder was digested using concentrated HNO3 and 30% hydrogen peroxide on a heating block system (Environmental Express, Mt. Pleasant, SC) and analyzed using Spectro Arcos Inducted Coupled Plasma Mass Spectrometer (Spectro Analytical Instruments, Mahwah, New Jersey). Data were presented as mg of chemical element per gram of seed for P, K, Ca, Mg, S, and as milligram of element per kilogram of seed for Fe, Mn, Zn and Cu.
2.5. Statistical Analysis
Soil, leaf and seed composition data were evaluated by analysis of variance (ANOVA) considering location and breeding line as fixed factors and block as a random factor using the PROC MIXED procedure in SAS [18] . Significant interactions were further investigated with the “slice” option, which allowed testing main effects or interactions at different levels of other main effects. Least-square means were compared using the “contrast” option.
The sum of squares for each of the factors of the model: soil element concentration + leaf element concentration + error = seed element concentration was calculated as a measure of the contribution of soil element concentration and leaf element concentration to the variability observed in the seed concentration. This analysis was performed for each location separately.
3. Results and Discussion
3.1. Soil Characteristics
The soil particle size analysis showed that both soils used in this study were silt loams [10] [11] . However, the clay content was significantly greater at the Kibler site, whereas the sand content was significantly greater at the Fayetteville site (Table 2). Silt content did not differ between locations. Soil at Fayetteville exhibited lower pH than soil at Kibler and was slightly acidic. Although it is known to affect plant nutrient availability, soil pH at Fayetteville was adequate to not to limit plant growth. Soil electrical conductivity differed between locations, but both were below the range (>500 μmhos/cm) at which plant injury due to high soil salt concentration may be expected. Soil at Kibler had greater concentrations of all extractable soil chemical nutrients analyzed except for P and Fe, which did not differ between locations, and S, which was greater at Fayetteville (Table 2). Soil P concentrations were optimum at both locations, but soil K, Zn and Cu, and S concentrations were below optimum at Fayetteville and Kibler, respectively. Soil Ca, Mg, Mn, and B concentrations were above the optimum level at both locations. However, Kibler soil exhibited more properties in the optimum range and perhaps was a better overall soil environment for soybean growth (Table 2). The differences in soil chemistry between locations were possibly due to natural differences between soil parent materials and the cumulative effect of previous management practices (e.g. tillage, and fertilization) at the two locations.
Table 2. Physical and chemical properties of the top 12.5 cm soil at the two Arkansas locations (Fayetteville and Kibler) where the study was conducted.
†EC = electrical conductivity; all minerals expressed in mg∙kg−1. See Materials and Methods for details. ‡ratio between the seed component concentration observed at Kibler and the concentration observed at Fayetteville. §from the location effect in ANOVA. ¶the low range values were obtained, when available, from the University of Arkansas Soil Test report. NS not significant at 0.05 probability level. *significant at 0.05 level. **significant at 0.01 level. ***significant at 0.001 level. #data from Minarik and Shive [19] .
3.2. Leaf Chemical Element Composition
None of the leaf chemical properties showed significant location by breeding line interaction (P > 0.05), which suggested that the leaf elemental concentration across all lines responded similarly to the environment and without significant changes in the ranking of the breeding lines between locations (Table 3). Thus, whether breeding lines had been selected for specific seed components did not influence the ability of the plants to take up inorganic nutrients from the soil and supply them to the metabolic systems during growth and development. However, leaf Mg, Fe, Mn, Zn, and B concentrations, averaged across breeding lines, differed between locations. Breeding lines had greater concentrations of leaf Mg, Fe, Zn, and B at Kibler but, a greater concentration of leaf M nat Fayetteville (Table 4). All lines at both locations had adequate leaf nutrient concentrations for normal growth, such that it would not have resulted in a recommendation for fertilization.
3.3. Seed Organic and Inorganic Composition
Oleic and linolenic acids showed significant location by breeding line interaction, which indicated that the expression of these two traits depended on both breeding line and location (Table 5). Four breeding lines (R05- 1415, R05-1772, R05-655, R07-2000, R07-8292) had greater oleic acid concentration at Fayetteville than at Kibler, but only breeding line R07-8292 had greater oleic acid concentration at Kibler than at Fayetteville. In contrast, except for breeding line R07-8292, linolenic acid concentration of all breeding lines differed between locations. The different response of R07-8292 compared to the other lines may have caused the significant location by breeding line interaction for oleic and linolenic acid concentrations. Differences in genetic background and breeding history of the breeding lines studied had a larger effect on seed organic components than on environment (locations) where the lines were evaluated. It is possible that the differences in soil properties and leaf inorganic nutrient concentration between locations did not contribute significantly to variation in organic seed composition. Maybe deficient or higher levels of soil nutrients were needed to detect considerable differences.
All seed chemical elements, except for Ca, showed no breeding line by location interaction (Table 5), which suggested that seed inorganic components responded to the effect of the environment, but without significant
Table 3. Analysis of variance of leaf chemical element concentrations for breeding lines with modified seed composition grown at two Arkansas locations (Fayetteville and Kibler) in 2011.
†degrees of freedom of numerator in F test. ‡degrees of freedom of denominator in F test. §P, K, Ca, Mg, S in %; Fe, Mn, Zn, Cu and B in mg∙kg−1. See Materials and Methods for details. NS not significant at 0.05 probability level. *significant at 0.05 level. **significant at 0.01 level. ***significant at 0.001 level.
Table 4. Leaf elemental concentrations averaged across breeding lines of soybeans with modified seed composition grown at two Arkansas locations (Fayetteville and Kibler) in 2011.
†P, K, Ca, Mg, S in %. Fe, Mn, Zn, Cu, B in mg∙kg−1. See Materials and Methods for details. ‡ratio between the seed component concentration observed at Kibler and the concentration observed at Fayetteville. §from the location effect in ANOVA. ¶from Marschner (1997). NS not significant at 0.05 probability level. *significant at 0.05 level. **significant at 0.01 level. ***significant at 0.001 level.
Table 5. Analysis of variance of seed organic and inorganic components for breeding lines with modified seed composition grown at two Arkansas locations (Fayetteville and Kibler) in 2011.
†degrees of freedom of numerator in F test: Loc = 1; Bl = 8, Loc x Bl = 8. Degrees of freedom of denominator in F test: Loc = 4; Bl = 25, Loc x Bl = 25. ‡Pro = protein concentration (mg∙g−1); Oil concentration in mg∙g−1; Ole = oleic acid concentration (mg∙g−1); Lin = linolenic acid concentration (mg∙g−1); Sats = saturated fatty acids (palmitic + stearic acids) (mg∙g−1); Suc = sucrose concentration (mg∙g−1); Sta = stachyose concentration (mg∙g−1); Pi = inorganic phosphorus concentration (µg∙g−1). From P to S in mg∙g−1; from Fe to Zn in mg∙g−1. See Materials and Methods for details. NS, not significant at 0.05 probability level. *significant at 0.05 level. **significant at 0.01 level. ***significant at 0.001 level.
changes in breeding line ranking. Alternatively, lack of genetic variation may also explain these differences. Overall, soybeans had greater linolenic acid, P, K, Ca, Mg, and B concentrations at Kibler, but greater oleic acid, sucrose, stachyose, S and Zn concentrations at Fayetteville (Table 6). Differences in leaf elemental composition between locations were not reflected in seed elemental composition. For example, leaf P, K, Ca, S, and Cu concentrations did differ between locations but, except for Cu, the same elements in the seed differed significantly between locations. Furthermore, Fe and Mn differed between locations in the leaf, but had similar concentrations in the seed. Seed-to-leaf enrichment ratios [20] showed that plants at Fayetteville had greater seed P and Mg relative to the leaf than plants grown at Kibler (Figure 1). Similarly, plants grown at Kibler had greater seed Ca relative to the leaf than plants grown at Fayetteville. Because leaf elemental concentrations were within the medium-optimum range at both locations, differences observed in seed enrichment ratios may have been caused by different rates of elemental remobilization/uptake between locations from the time. Plants were sampled until maturity. The lack of direct relationships could mean that the soil had no impact on leaf elemental composition
Table 6. Seed elemental concentrations averaged across breeding lines with modified seed composition grown at two Arkansas locations (Fayetteville and Kibler) in 2011.
†Pro = protein concentration (mg∙g−1); Oil concentration in mg∙g−1; Ole = oleic acid concentration (mg∙g−1); Lin = linolenic acid concentration (mg∙g−1); Sats = saturated fatty acids (palmitic + stearic acids) (mg∙g−1); Suc = sucrose concentration (mg∙g−1); Sta = stachyose concentration (mg∙g−1); Pi = inorganic phosphorus concentration (µg∙g−1). From P to S in mg∙g−1; from Fe to B in mg∙kg−1. See Materials and Methods for details. ‡ratio between the seed component concentration observed at Kibler and the concentration observed at Fayetteville. §location effect from ANOVA. NS, not significant at 0.05 probability level. *significant at the 0.05 probability level.
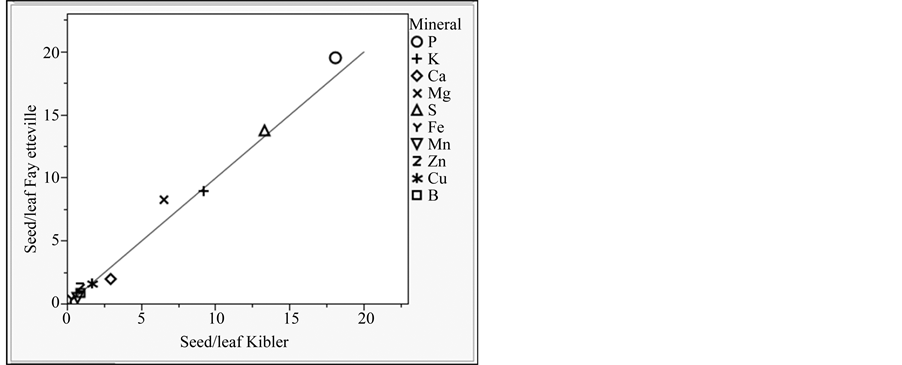
Figure 1. Seed enrichment ratios (seed chemical element concentration/leaf chemical element concentration) of breeding lines (combined) with modified seed composition grown at two Arkansas locations (Fayetteville and Kibler) in 2011. The line represents equal enrichment ratios at both locations. Elements above the diagonal have higher enrichments ratios at Fayetteville, whereas elements below the diagonal have higher enrichment ratios at Kibler.
and seed traits, or all soil properties measured were adequate, in other words, no deficiencies or excesses. Future research should involve experiments with minerals that showed the largest contrast between leaf and seed concentrations and applied at deficient, optimum, and excessive levels to the growing plant.
In general, except for in a few cases, soil and leaf variables were not correlated with organic seed components (data not shown). Variation in the concentration of inorganic seed composition was, in general, not explained by variation in soil or leaf elemental concentrations (Table 7). The only exception was seed Zn concentration at Fayetteville, in which 47% of the variation was explained by leaf Zn (Table 7). These results suggest that at Fayetteville, leaf Zn concentration may be an adequate predictor of seed Zn concentration.
Several studies have also failed to show significant association between soil or leaf elemental and seed organic compositions. Boswell and Worthington [21] studied the effects of varying amounts of soil B and Mn on seed protein, oil, and fatty acids in a field experiment. Soil Mn and soil B had only a slight effect on protein concentration and no effect on oil or fatty acids. Similarly, Heenan and Campbell [22] observed no effect of Mn in the growing medium on protein and oil of two cultivars grown in the greenhouse. Wilson [8] reported that deficient levels of soil Mn increased seed linoleic, linolenic, saturated fatty acids and protein, but decreased oil and oleic acid concentrations. Interestingly, these effects were absent when plants were above the deficiency levels (15 mg∙kg−1). Ham et al. [23] studied the effect of S fertilizer on seed protein and fatty acids and reported no effect of S on these two seed components. Similar results were observed for protein and oil measured in soybeans grown with different S fertilizer rates in Missouri [24] , Kansas [25] and Iowa [26] , and increasing levels of macronutrients N, P, K, Ca, and Mg in soybeans grown in hydroponic conditions [27] .
Other studies have shown significant relationships between soil or leaf elemental and seed organic compositions. Gaudou and Arrivets [28] studied the effect of soil P, K, and N on soybean seed organic components and showed that P increased protein and oleic acid, whereas soil K increased oil and linolenic acid, but decreased protein concentrations. Bellaloui et al. [29] [30] studied the effect of foliar B application on soybean seed composition and demonstrated a significant increase in protein and oleic acid, but a decrease in oil and linolenic acid concentrations. In a different study, Bellaloui et al. [9] observed a significant correlation among soil K, B, Zn, seed protein and oleic acid for a high-yield cultivar grown at one location for two consecutive years.
The lack of agreement among the studies described here suggests that the effects of cultivars (e.g. high yield, specialty), environments (temperature, moisture, soil type), and methods used (field, greenhouse) may have accounted for the observed variability in results. It appears that if producers want to attain different levels of organic seed components, fertilization with minerals may not be a recommended practice; alternative management strategies may be more adequate. For example, previous studies have shown planting early tends to increase oil and oleic acid concentration [31] [32] , whereas late planting tends to increase sucrose [33] .
In this study it was shown that although they had a different breeding history, all specialty soybean breeding lines were able to take up, transport, and increase leaf elemental concentrations to adequate levels before the re
Table 7. Summary of the sum of squares for each of the factors of the model: soil element concentration (Soil) + leaf element concentration (Leaf) + error = seed element concentration, calculated as a measure of the contribution of soil element concentration and leaf element concentration to the variability observed in the seed element concentration of soybean breeding lines with modified seed composition grown at two Arkansas locations (Fayetteville and Kibler) in 2011.
productive period. Differences in leaf minerals between locations were not translated to the seed. Other factors such as temperature during seed-fill may have overridden potential associations between leaf minerals and seed components. Altering fertilization practices may not result in changes in seed composition. Results presented in this study may be used as a starting point for research aimed to understand which mechanism plays a relevant role in seed composition, and ultimately develops fertilization and management practices that improve soybean seed quality [34] .
Acknowledgments
We wish to thank all the individuals of the University of Arkansas Soybean Breeding Program for their help with field and laboratory work. The research presented in this paper is part of LMJ PhD dissertation and supported by grants from the United Soybean Board and the Arkansas Soybean Promotion Board.
Abbreviations
EC: electrical conductivity;
HPLC: high performance liquid chromatography;
Kib: Kibler: AR;
Fay: Fayetteville: AR;
Pro: protein;
Ole: oleic acid;
Lin: linolenic acid;
Sats: saturated fatty acids;
Suc: sucrose;
Sta: stachyose;
Pi: inorganic phosphorus;
P: phosphorus;
K: potassium;
Ca: calcium;
Mg: magnesium;
S: sulfur;
Fe: iron;
Mn: manganese;
Zn: zinc;
Cu: copper;
B: boron;
dfn: degrees of freedom of numerator;
dfd: degrees of freedom of denominator;
NOTES
*Corresponding author.