Clinical Application of T-SPOT.TB Using Pleural Effusion as a Diagnostic Method for Tuberculosis Infection ()
1. Introduction
Tuberculosis (TB) is a major cause of morbidity and mortality worldwide [1] . TB pleurisy is the second most common extrapulmonary manifestation of Mycobacterium tuberculosis (MTB) infection following TB lymphangitis, accounting for up to 23% of all extrapulmonary TB patients [2] .
The positive rate of smear and culture examinations for MTB, or the detection rate of MTB-DNA from pleural effusion (PE), ranges from 12% - 70%, and [3] 0% - 100%, respectively [3] -[6] . Pleural biopsy for culture of MTB, MTB nucleic acid amplification and histological detection of caseating epitheloid granuloma showed sensitivities of 40% - 80%, 90%, and 50% - 97%, respectively [7] -[10] . Although the procedure is invasive and is associated with more clinical complications, the sensitivity to detect active TB disease is higher in biopsies compared with PE. The diagnosis of TB pleurisy is difficult to establish, not only in terms of the nonspecific clinical presentation, but also due to the lack of useful diagnostic examinations.
In interferon-gamma release assays (IGRAs), there are two in vitro tests which measure the interferon-gamma release of activated T cells isolated from the patient’s peripheral blood; Quanti FERON-TB (QFT) as an enzymelinked immunosorbent assay (ELISA) and T-SPOT.TB as an enzyme-linked immunospot assay (ELISPOT). Of the two IGRAs, T-SPOT.TB has a higher sensitivity and is applicable to other clinical specimens excluding peripheral blood as a supporting diagnostic method for active TB disease because it measures IFN-γ-producing T cells after regulation of the mononuclear cell count (the cell count of pleural effusion mononuclear cells (PEMCs) was 2.5 × 10⁵, the same as peripheral blood mononuclear cells (PBMCs)).
Therefore, we evaluated the results of T-SPOT.TB using PE including the usual IGRAs results using peripheral blood without invasive diagnostic methods to diagnose TB pleurisy in routine clinical practice.
2. Methods
2.1. Patients
We prospectively evaluated 45 patients with lymphocyte-dominant exudative pleural effusion. These clinical specimens were collected from Kawasaki Medical School Hospital (Kurashiki, Japan) and five affiliated hospitals and the final diagnosis was decided between January 2009 and September 2013. This study was approved by the ethics committee of Kawasaki Medical School, and written informed consent was obtained from all subjects.
Peripheral blood (PB) was obtained by drawing venous blood for MTB-specific ELISA (QuantiFERON TB-Gold In-Tube (QFT)) and MTB-specific ELISPOT (T-SPOT.TB) before the initiation of antituberculous treatment. PE were also extracted before the initiation of antituberculous treatment and microbiological examinations for acid-fast bacilli, MTB-specific DNA amplification, ADA and MTB-specific ELISPOT were performed. These samples were firstly examined by Ziehl-Neelsen staining and were digested and decontaminated by the sodium hydroxide method. They were inoculated onto slants of 1% Ogawa egg medium (Japan BCG, Tokyo, Japan) and identified by growth characteristics and conventional biochemical tests. Mycobacteirium tuberculosis was identified by an Amplicor polymerase chain reaction assay (Roche Diagnostic Systems, Branchburg, NJ, USA) and also identified by DNA-DNA hybridization (DDH) methods (Kyokuto Pharmaceuticals, Tokyo, Japan).
2.2. Definitions of Patients in the TB-Definite Group and the Other Disease Group
We firstly decided the TB definite group patients if MTB was cultured from PE or a pleural biopsy specimen. Secondly, we decided the other disease group patients if other clinical diagnosis was established by the detection of malignant cells or satisfying the diagnostic criteria of other disease. We excluded patients with healed pulmonary TB from the other disease group patients to avoid the influence on the results of T-SPOT.TB when the specificity was calculated in this study.
2.3. ADA in PE
The ADA activity in PE was measured by an auto analyzer using commercially available kits (Nittobo Medical, Tokyo, Japan). The cut-off level of ADA activity in PE was judged as a positive result at over 36 U/ml according to the study of Ogata et al. [11] .
2.4. QFT Test
QFT was performed according to the instructions of the manufacturer (Cellestis Ltd). The judgment was performed according to the guidelines proposed by the Centers for Disease Control and Prevention (CDC) [12] .
2.5. T-SPOT.TB
MTB-specific ELISPOT assays were made using the T-SPOT.TB test [13] [14] . PBMCs and PEMCs were prepared from peripheral blood (PB) and PE which obtained before the initiation of antituberculous treatment. In brief, 2.5 × 10⁵ PBMCs and 2.5 × 10⁵ PEMCs were placed overnight on 96-well plates that had been pre-coated with a mouse anti-human IFN-γ antibody in 100 μl volumes of culture medium per well. The cells were left unstimulated (negative control), or were stimulated with 50 μl of phytohaemagglutinin (positive control) or 50 μl of ESAT-6 and CFP-10 peptides in separate wells. The culture of the plates, washing, counterstaining, visualization and analysis of the spots were performed according to the manufacturer’s instructions. The response of stimulated cultures was considered positive when the test well contained six spots or above and had twice the number of spots shown in the control well. The background number of spots in negative control wells (nil wells) was below 10 spots per well in both PBMCs and PEMCs of all patients.
2.6. Statistical Analysis
All statistical analyses were performed using Stat View software Version 6 (Artec Institute, Osaka, Japan). The ADA, IFN-γ, and spot forming cell (SFC) levels in the two patient groups are expressed as the median level. Mann-Whitney tests were used to compare the differences between two groups. Sensitivity was calculated by dividing the number of positive results tested into the number of patients in the TB-definite group for all clinical practice. Specificity was calculated by dividing the number of negative results tested into the number of patients in the other disease group, excluding patients with healed tuberculosis, for all clinical practice. A probability value of less than 0.05 was considered significant.
3. Results
The TB-definite group for TB pleurisy consisted of 12 patients and the other disease group consisted of 33 patients (lung cancer in 24 patients, asbestos-related pleural disease in 5, collagen vascular disease in 3, malignant lymphoma in 1). Clinical findings of these cases showed lymphocyte-predominant exudative PE are shown in Table 1. Concerning the backgrounds of the two patient groups, the frequency of respiratory diseases in the underlying diseases was significantly higher than those in the other disease group. There were no significant differences among the two patient groups in the laboratory data.
The median levels of ADA in PE and the positive response rates were significantly higher in the TB-definite group (positive response rate: 83%, median level: 66.6 IU/l) than the other disease group (positive response rate: 21%: median level: 20.9 IU/l), as shown in Figure 1. The sensitivity of ADA in PE was 83% and the specificity was 79%, respectively.
Regarding the results of QFT using PB, while the positive response rate was 83% in the TB-definite group, it was significantly lower in the other disease group (9%). On the other hand, indeterminate results accounted for 8% in the TB-definite group and 6% in the other disease group (Table 2). Indeterminate results of both groups caused by low response of mitogen (positive control) in all patients. The sensitivity of QFT was 83% and the specificity was 85%, respectively.
As for the results of T-SPOT.TB using PB and PE, while the positive response rate was 92% in the TB-definite group and 15% in the other disease group by using peripheral blood mononuclear cells (PBMC), it was 100% in the TB definite group and 18% in the other disease group using pleural effusion mononuclear cells (PEMC) when we used the same cut-off values (6 spot forming cells (SFCs)), as well as PBMC (Table 3 and Table 4). Also, while the sensitivity of PBMC was 92% and the specificity of PBMC was 82%, the sensitivity of PEMC was 100% and the specificity was 82%, respectively.
The median numbers of SFCs in the two groups were significantly higher in patients in the TB-definite group (PBMC: median level 18 SFCs versus PEMC: median level 83 SFCs) than the other disease group (PBMC: median level 2 SFCs versus PEMC: median level 3 SFCs) for the T-SPOT.TB results using PBMC and PEMC (Figure 2 and Figure 3). Especially, the median numbers of SFCs of T-SPOT.TB using PEMC were significantly higher than those of T-SPOT.TB using PBMC in the TB-definite group.
4. Discussion
IGRAs such as QFT or T-SPOT.TB have recently become popular as supportive diagnostic methods for TB

Table 1. Clinical findings of cases that showed lymphocyte-predominant exudative pleural effusion.
*Duplication (+), N.S.: Not significant. #p < 0.05.
*p < 0.05.
PBMC: Peripheral blood mononuclear cell. *p < 0.05.
PEMC: Pleural effusion mononuclear cell. *p < 0.05.
disease. They have a high sensitivity of 83% - 97% [15] [16] , and a high specificity of 92% - 100% [16] [17] . However, IGRAs cannot distinguish between active TB disease and latent TB infection (LTBI) or healed TB disease using PB. The reason is that only a minority of lymphocytes are found in PB [18] . Moreover, the number of MTB-specific T cells with regard to ESAT-6 and CFP-10 specific T-cells is very low (0.002% - 0.4%), even in active TB disease [19] [20] . On the other hand, antigen-specific T-cells migrate to the site of inflammation in active TB disease and rapidly release some cytokines such as interferon-gamma (IFN-γ) [21] [22] . While an ELISA assay such as QFT quantifies IFN-γ production following MTB-specific antigen contact in
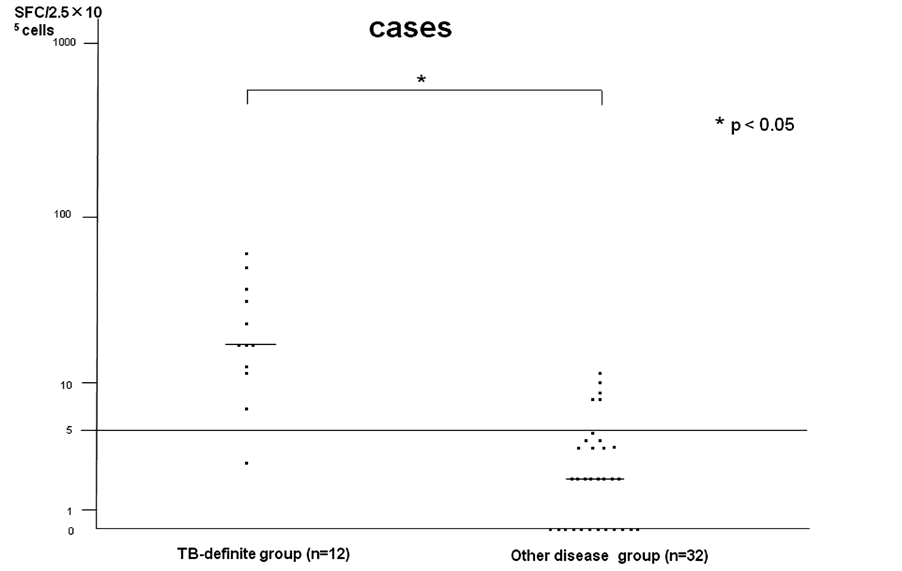
Figure 2. T-SPOT.TB (PBMC) determinate cases.
clinical specimens, it is possible to enumerate single MTB-specific cells using an ELISPOT assay such as T-SPOT.TB. Therefore, because ELISPOT assay results can compensate for lymphocyte numbers (2.5 × 10⁵) in order to compare the results of T-SPOT.TB using PBMC and PEMC, we measured MTB-specific cells in not only PB, but also PE using an ELISPOT assay in this study.
Regarding the study of TB pleurisy, a first report indicated that the median number of ESAT-6 SFCs in PEMCs was 15-fold higher than that in PBMCs [23] . Losi et al. reported that the diagnostic sensitivity of T-SPOT.TB for active tuberculous pleurisy was very high (95%) by enumerating antigen-specific mononuclear cells from PE of patients with exudative pleurisy, but the specificity was only 76% [24] . The median concentrations of ESAT-6 and CFP-10-specific cells were 4.2 to 7.5 fold higher in PEMCs than in PBMCs. In this study, although total number of patients tested was low because of intermediate incidence of TB disease such as Japan, we confirmed excellent results for the diagnostic sensitivity of T-SPOT.TB using PE for active TB pleurisy in combination with patients in the TB-definite group (100%) compared to the results of ADA (83%) in PE, QFT (83%) and ELISPOT assays using PBMC (92%), while the median numbers of ESAT-6 and CFP-10-positive SFCs were 3 to 5 fold higher in PEMCs than in PBMCs.
On the other hand, when we judged the positive response of PEMC at the same cut-off level as PBMC (≥6 SFCs), the diagnostic specificity for the ELISPOT assays using PEMC showed almost same percentage (82%) (not significant) for ADA (76%) and QFT (85%). There were six patients who showed false-positive responses for the ELISPOT assay in the other disease group; four patients with carcinomatous pleuritis, one with pleuritis combined with collagen vascular disease, and one with malignant lymphoma. It was reported that the sensitivity was generally higher in the ELISPOT assay (T-SPOT.TB) compared to the ELISA assay (QFT), and the specificity was better in QFT than T-SPOT.TB [25] [26] . It is unknown why six patients showed false-positive responses for T-SPOT.TB using PE through this study. Therefore, we have to try to answer the question in the ongoing study. Indeterminate results of QFT and T-SPOT.TB were detected in one case in the TB-definite group and two patients in the other disease group due to low response of mitogen (positive control). These patients had severe underlying disease or collagen vascular disease, were receiving immunosuppressive treatment and showed lymphocytopenia and/or hypoalbuminemia on laboratory findings. Although we reported that lymphocytopenia and/or hypoalbuminemia may cause indeterminate IGRAs results in previous reports [27] [28] , these findings support our hypothesis.
There are some limitations involved in the use of IGRAs in PE samples. Firstly, although the cut-off level of T-SPOT.TB using PBMC is defined, the cut-off levels for IGRAs using PE have not yet been defined. We challenged the estimation of ROC curve analysis or AUC calculation to ascertain the appropriate cut-off levels for ESAT-6 and/or CFP-10 for PEMC in this study, but because the numbers of patients were small scale in individual group, we could not obtain the appropriate cut-off levels for PEMC. Although several reports have used various cut-off levels derived from small scale studies in heterogeneous settings [24] , this causes some problems in routine clinical application. A large, comparative study is required to determine the appropriate cut-off levels for positivity, and this may be different in countries with a high or low incidence of TB disease. Secondly, when we calculated the specificity in this study, we used patients who showed lymphocyte-dominant exudative pleural effusion due to other underlying disease except healed pulmonary TB as a negative control group. However, there is no evidence which can completely exclude this influence on the results of IGRAs. Regarding the specificity of IGRAs, although age-wise analysis may be required to evaluate previous TB infection, we could not do age-wise analysis regarding specificity because there were not many patients (33 patients) in the other disease group and most of these patients were old in this study. In retrospect, we think that we need perform a large scale study including many younger age patients. Thirdly, the total numbers of patients with TB-definite group enrolled in this study was low because of intermediate incidence of TB disease such as Japan. Therefore, the results may be considered preliminary and need to be confirmed in large scale cohorts, including immunocompromised patients such as HIV-positive patients, and in countries with a higher incidence of TB disease [29] .
5. Conclusion
The diagnosis of TB pleurisy is difficult in clinical practice using standard diagnostic methods. In particular, MTB-NAT in PE or PCE cultures has low diagnostic sensitivity. Therefore, methods for establishing a definite diagnosis are desirable. For such cases, when thoracocentesis is technically feasible, although there are no assessment criteria for ELISPOT assay for MTB using PE, a strong positive ELISPOT assay for MTB using PE (very high SFCs of PEMCs compared to PBMCs were recognized in this study) may be a rapid test before the initiation of antituberculous treatment. The further large scale investigation is needed to assess both the sensitivity and specificity of the ELISPOT assay for MTB using PE applied to the diagnosis of TB pleurisy.
Acknowledgements
The authors would like to thank T. Matsushima (Kurashiki Daiichi Hospital, Kurashiki, Japan, Asahigaoka Hospital, Okayama, Japan), N. Okimoto (Kawasaki Medical School Kawasaki Hospital, Okayama, Japan), Masaaki Abe (Takahashi Central Hospital, Takahashi, Japan) and J. Nakamura, H. Yoneyama (Kasaoka Daiichi Hospital, Kasaoka, Japan) for their constructive comments.
Funding
This work was supported by MEXT KAKENHI (23591168).