1. Introduction
The purpose of this paper is to describe the stresses and strains and possible damage which can occur in the ZPPR fuel elements when raised to a given temperature to determine if damage to the cladding can occur. Damage to the cladding is a concern because even a small hole can allow air and moisture to be exposed to the fuel. The fuel will oscillate through the hydride oxide cycle (like the ZPPR Uranium fuel described in Ref. [1] ) over a long period of time and eventually turn into an oxide powder. This turns the metal fuel into a useless highly reactive hydride powder that can burn and spread (contamination) quickly during handling. It would need to be processed back to a useable form. The conductivity of both the metal and the clad are so high that the entire fuel element would be at a uniform temperature in storage. The temperature which the fuel elements achieve in storage under various conditions is estimated in Ref. [2] . This paper concludes that no damage would occur to the fuel elements is raised to 290˚C (554˚F) (which is the maximum temperature calculated in Ref. [2] ), because the maximum plastic strain that can be induced in clad due to the fact that this temperature is small, and even though it is possibly beyond the yield strain, it cannot cause a hole in the clad because the strain will not exceed 0.005 even though the elastic limit strain is 0.0012. Failure does not occur inface centered cubic (fcc) metals with elongation less than 0.20. No damage is predicted as long as the fuel temperature is below the design limit of 600˚C. Thus, even though damage has occurred to a limited number of fuel elements [3] , this study concludes that this damage has not been caused by the temperatures encountered in storing the fuel.
A conservative calculation indicates the cladding would exceed its yield stress at any fuel element temperature above 170˚C (338˚F) (referred to as the yield temperature). A more realistic calculation indicates the fuel cladding yield temperature is reached at 370˚C (698˚F). At temperatures above the yield temperature, the clad will yield (i.e., permanently deform), but only a small amount because thermal expansion of the metal fuel is relatively small. The deformation will be small enough that the thinning would be in the behavioral region where the clad thickness thins uniformly with elongation and should not form any pinholes. Metal damage in fcc metal does not occur as long as the plastic strain less than 0.20 although most designs limit strains to significantly less than the elastic limit [4] .
This paper briefly describes the ZPPR reactor, then the fuel elements and the coefficient of thermal expansion of the fuel plate and the elastic plastic tensile characteristics of the clad. An elastic model of the fuel and cladding is developed, then a modification of the model is derived to describe the elastic-plastic behavior of the clad. The calculated results of the stress and strain using these models are compared to experimentally determined ultimate stresses and strains of the cladding.
1.1. Description of the ZPPR Reactor and Pu Based Fuel Elements
ZPPR (Zero Power Physics Reactor) was the largest of the split-table fast reactor critical facilities. ZPPR was operated as a criticality facility from April 18, 1969 until decommissioned in 1990. It was used to obtain a large amount of very detailed data on a variety of full-sized reactor configurations including large, commercial-sized fast reactors with powers of up to 1200 MW (electric). The purpose was to construct assemblies that closely resembled various fast reactor designs and then use the experimental results to validate and refine the data and methods used to design large fast reactors. There were 21 major assemblies, most of which had several major variants (e.g., beginning of cycle, middle of cycle, end of cycle, various control rod positions, etc.). The experiment campaigns included several large plutonium reactors, engineering mockups for both major design concepts for the Clinch River Breeder Reactor designs, larger fast reactor designs as part of the JUPITER collaboration with Japan, the SP-100 space reactor, and assemblies supporting the Integral Fast Reactor Design [5] .
The ZPPR critical assembly is put together from rectangular building blocks of fuel, coolant and structural materials inserted into drawers. Figure 1 shows a picture of the ZPPR reactor with a technician inserting material into the drawers in the left half of the reactor. The right half, also seen in Figure 1, contains identical drawers. The entire reactor system is shown in this figure. Once the two halves were fully assembled, all personnel would exit the room and the two halves would be slowly brought together using remote controls. With the reactor fully assembled, control rods would be carefully withdrawn and the reactor would be brought to a critical state. To avoid generating large quantities of fission products in the fuel plates and to prevent the need for coolant flow, a low reactor power would be maintained, typically on the order of one kilowatt. With the reactor in a low power critical state, various reactor physics parameters would be measured such as neutron reaction rates, neutron flux profiles, excess reactivity, and control rod worth measurements. The reactor is designed to withstand credible and incredible accidents and is surrounded by a containment designed with filters which would remove any radioactive contamination generated in a potential accident.
There is a very large inventory of critical facility materials that could be assembled in various combinations to construct any reactor within a short time. Because ZPPR was operated at very low power, the materials did not

Figure 1. Experimenter loading fuel in the ZPPR reactor.
become very radioactive, and they were used over and over again and are inserted in the drawers by hand with minimal radiation protection required. These features, combined with the short time required to assemble a core, meant that nuclear reactors could be built and tested in ZPPR for about 0.1% of the capital cost of construction the whole power plant.
The cores were made up on many platelets of various materials which were loaded into drawers. The drawers were then loaded into a matrix structure which was made up of many square matrix tubes clamped tightly together into a large square array. The array of matrix tubes was positioned horizontally so that the drawers were inserted horizontally into the matrix tubes, and the core simulations were generally cylindrical with axis of the cylinder positioned horizontally. In addition, the array of matrix tubes was separated into two halves at the cylindrical axial midplane. During operation, the two halves of the array of matrix tubes were positioned tightly together, but at shut down the two halves of the assembly were separated giving easy access to the midplane of the assembly and provided a huge shut down reactivity margin.
The ZPPR Facility includes the ZPPR cell, ZPPR Vault/Workroom, the ZPPR Materials Control Building, and the ZPPR Control Room.
The fuel which is inserted in the drawers comes in thin 2 inch by 0.20 inch thick clad plates of different lengths up to 8 inches long. It was manufactured in 1967 and has been in storage since the reactor was decomissioned. So although the reactor has been decommissioned, the fuel must still be stored and maintained to prevent any degradation and possible contamination.
The high Pu ZPPR fuel plates are made of a Pu U Mo metalalloy [6] about 2 in. high, 0.2 in. thick, and of various lengths, (designated by A in Figure 2) from 1 to 8 in (See Figure 2). The plates are clad in a 304 L Stainless Steelsheet [7] wrapped around the plates with end caps which are inset into the clad wrapper and welded in. One end cap is welded into the cladding, then the fuel plate is inserted, and finally, the final seal is made by pressing the other end cap firmly against the fuel and then welding that end cap in place. The details of the fuel element geometry and assembly are described in more detail in the fuel specification [8] (PF-1600, 1967).
In the low temperature range, the coefficient of thermal expansion (CTE) of the fuel plate is the same as that of the cladding. At higher temperatures, the CTE of the fuel plate is greater than that of the cladding, so as the fuel element heats up, it will attempt to elongate more than the cladding will allow. Since the closure design of the clad requires both to be the same length at room temperature when the temperature rises, a tensile stress is built up in the cladding and a compressive stress in the fuel plate. The stresses and strains which build up as the fuel is heated up are modeled in this paper to determine if failure of the cladding due to thermal expansion is probable.

Figure 2. Schematic diagram of the ZPPR fuel elements.
1.2. Coefficient of Thermal Expansion of the Fuel Plate
The coefficient of thermal expansion of the stainless steel is reported on the internet in several different references and is approximately 16 × 10−6/˚C to 18.7 × 10⁻⁶/˚C in the range of 0˚C to 650˚C with higher values being at the higher temperatures.
The plutonium uranium alloy is more complicated. Plutonium undergoes more phase transitions at ordinary pressures than any other element. As plutonium is heated, it transforms through six different crystal structures, α, β, γ, Δ, Δ′, and ε, before melting at 640˚C (1184˚F). Density and thermal expansion vary significantly from phase to phase. The linear expansion of plutonium over all these phases [9] is shown in Figure 3. This figure shows that there are three volume expansion jumps in going through the first four phases. The first three phases show respectively CTEs of 48, 47, and 45 × 10−6 cm/cm˚C. The fourth and fifth phases, Δ and Δ′, show negative CTEs and negative volume jumps between these two and the sixth phase. The sixth again shows an increase in CTE. The CTE and phase change volume jumps calculated from this graph are shown in Table 1.
When plutonium is mixed with uranium, the CTE changes quite a bit. Measurements made on the SEFOR fuel are shown in Table 2 which is taken from Johnson (1965) page 3-6. Dilatometric studies were made at Argonne National Laboratory in which 1 inch long cast specimens were heated and cooled through several cycles between 30˚C (86˚F) and 700˚C (1292˚F) to check for reproducibility. Average expansion coefficients for ranges of temperatures on heating are given in Table 2. The average coefficient increases from 15.3 × 10⁻⁶ cm/cm˚C in the range 30˚C (86˚F) to 220˚C (428˚F) to 24.8 × 10‑6 cm/cm˚C in the range 380˚C (716˚F) to 545˚C (1013˚F). A transformation occurs between 545 (1013˚F) and 617˚C (1143˚F) results in an expansion of 3.95 × 10⁻³ cm/cm but the average expansion rate is included in Table 2. As will be seen, these CTEs are similar to the that of the ZPPR fuel. According to Johnson [6] , the over-all expansion coefficient from 30˚C (86˚F) to 700˚C (1292˚F) is 24.6 × 10‑6 cm/cm˚C.
The compressive strength at room temperature and at 280˚C (536˚F) was 190,000 psi and 150,000 psi, respectively. It has enough toughness at room temperature to permit handling and machining but exhibited brittle failure in the above compression tests. Ductility increases rapidly above 400˚C (752˚F). Thin castings of the metal have smooth, bright surfaces. Porosity is not a problem. Castings can be drilled and machined with carbide tools.
The ZPPR FSAR [10] reports the CTEs for “Alloy Fuel” which are listed in Table 3. These values are higher than for the SEFOR fuel. Although not specified, it is assumed that the alloy fuel referenced in the FSAR is the NUMH fuel listed in Table 65 of Ref. [11] , which has a higher concentration of Pu (U-34 wt% Pu-2.5 wt% Mo-0.7 wt% Am) perhaps accounting for a higher CTE.
2. Fuel Element Internal Pressure and Clearance Between Fuel and Clad
This section show that the fuel elements internal pressure is atmospheric even though the initial pressure loading is from 1/2 to 1/3 atmospheric pressure. It also shows that in most cases the cladding and the fuel are probably not rubbing against one another due to differential thermal expansion of the fuel and cladding.
The fuel element’s final assembly consists of taking cladding which has one end plug already welded in it.
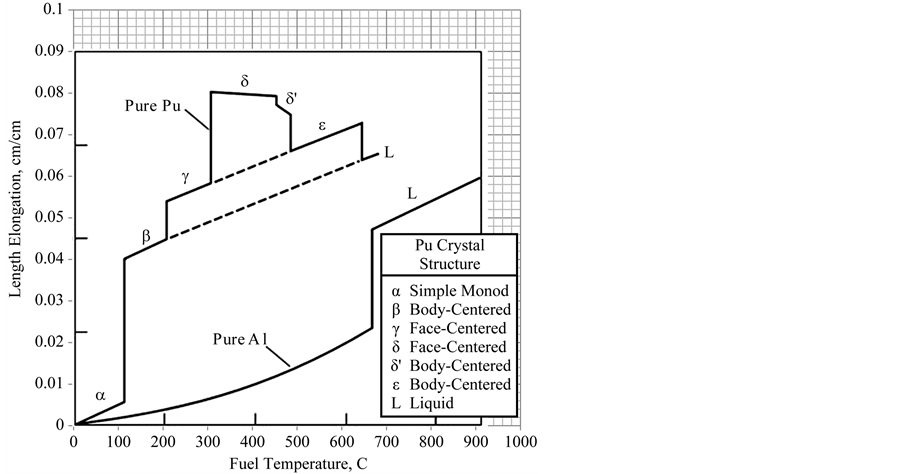
Figure 3. Length elongation for plutonium [9] .

Table 2. CTE for U-20 wt% Pu-2.5 wt% Mo SEFOR alloy casting.
Then the fuel plate is inserted into the cladding and the other end plate is pressed into the cladding and held with a force of at least 40 lbf against the fuel while the end plug is welded in. The welding is done in a helium-argon atmosphere with at least 20% helium in a subatmospheric chamber between 1/3 and 1/2 atmosphere.
The specifications for the fuel element are summarized in this paragraph: “The welds at the ends of the plug and one side weld may be made with the welding chamber filled with helium-argon at atmospheric pressure. Before the final weld is made, the welding chamber shall be evacuated to a pressure of less than 0.2 torrfor a period of five minutes or more. A helium-argon welding gas mixture containing not more than 10 ppm H2O and 30 ppm O2 and not less than 20% helium is then admitted to the chamber to a pressure of 1/3 to 1/2 of a standard atmosphere (5 psia to 7.5 psia), and the final weld is made at this pressure.”
After the fuel element closure was made and the fuel element was removed from the welding chamber and exposed to the atmosphere, the increase of pressure on the outside of the cladding to one atmosphere causes the cladding to collapse somewhat. As is shown in this section, this collapse will cause the pressure on the inside of the cladding to increase to atmospheric pressure. The volume of gas remaining in the cladding will be greater than the estimated minimum collapsed. The free volume between the fuel and cladding is referred to here as the plenum volume.
The calculations which demonstrate this for an 8-in.-long fuel element are described in this section. There is no pressure difference between the outside and inside of the cladding at the time the final welding is done, so the plenum volume at this time can be estimated by subtracting the volume of the fuel from the volume of the un-deformed cladding. Three different estimates of this uncollapsed plenum volume, the average, the maximum, and the minimum, are included in Table 4. The average value is obtained by using the average specification dimensions. The maximum is estimated by using the difference between the maximum cladding height specs and the minimum fuel height specs. The minimum is estimated by the difference between the minimum cladding height and the maximum fuel height. These dimensions and the volumes calculated from them are also included in Table 4. Note the cladding dimensions are inside dimensions, and all dimensions are at room temperature.
An estimate of the minimum volume remaining if the cladding were to completely collapse down onto the fuel, but not wrinkle, has been made and is also included in Table 4. This volume is termed the collapsed volume and is estimated by assuming that no volume exists between the cladding and the fuel at the end caps or between the cladding and the sides of the element which are about 8 in. long by 2 in. high but that the volume between the top of the fuel and cladding and between the bottom of the fuel element and cladding remain. With the 40 lbf applied at closure, the ends plugs press against the fuel and allow no space. The sides are pressed against the fuel by the outside pressure difference and allow no space on the sides. The top and bottom do not compress down on the fuel due to the stiffness of the metal cladding. This geometry is attested to from pictures of the fuel. If the top and bottom were pressed against the fuel, then wrinkles would have dented the cladding as evidence but none exist.
The collapsed volume that remains inside the cladding with the above model is estimated by the free volume on the top and bottom of the fuel which is estimated by the difference in the cladding height and the fuel height times the fuel thickness times the fuel length. This is included in Table 4 as the collapsed volume.
Table 4. The uncollapsed and collapsed fuel plenum volumes.
Using the perfect gas law, the volume remaining when the completed fuel elements are brought into the atmosphere at a pressure (13.4 psia) which is conservatively above the average local ZPPR pressure (12.3 psia) is shown in Table 5 for room temperature as well as the maximum temperature which has been determined that the ZPPR fuel could attain in storage. In all cases, these calculated volumes are greater than the minimum collapsed volumes. Thus, the cladding does not completely collapse onto the fuel, and the pressure inside the fuel elements is the same as the local atmospheric pressure. Note that Table 5 also shows the cladding does not completely collapse even at sea level (14.7 psia) but it almost collapses as is shown in Table 6. Note, the collapsed volumes in Table 4 are repeated in Table 5 for ease of comparison.
Table 6 shows the distance between the cladding and the fuel for different conditions. It is calculated by taking the volume in Table 5, subtracting the collapsed volume from it, dividing the remaining volume by the area of the fuel (15.3 in2) and then dividing by 2 to assume a space on each side of the fuel. The stainless steel roughness is listed in The Engineering Toolbox [12] as 0.60 mils. If the fuel and cladding both have a roughness of 6 mils, then Table 6 shows those loaded at 5 psia are touching at room temperature. Under most conditions listed in Table 6, the friction would not be significant. The differential expansion of low temperature fuel will be very small so friction at these temperatures will also be insignificant.
3. Metal Tensile Stress-Strain Failure Behavior
The failure of the 304 L stainless steel cladding subjected to tensile stress when the fuel element temperature increases determines if the fuel is exposed to air and humidity. Its stress-strain-failure properties are presented in this section. Many metals subject to tensile stress follow a linear relationship between stress and stain (Hooke’s Law) in the low stress strain region. This is termed the elastic region. After the limit of this region is reached, the material will distort in a non-linear manner by elongating more for a given increase in stress. The point at
Table 6. Distance between cladding and fuel plate (mils).
which straight line behavior ceases is called the limit of proportionality or elastic limit. Beyond this the material will not return to its original shape when the stress is released. This is called plastic behavior. Figure 4 as well as the next two paragraphs is from Hecker [4] . The elastic limit, the stress at which the material starts to exhibit permanent deformation, is also called the yield strength.
As Figure 4 shows, if the stress is increased beyond the yield point all the way to the ultimate tensile strength, the sample will neck down and then eventually fracture. The term ultimate tensile strength is used for the maximum value of tensile stress that a material can withstand without breaking and is calculated at the maximum tensile force divided by the original cross-sectional area.
Because the onset of deviation from a straight line in the elastic region is often very gradual, the “yield strength” of a metal is defined as the stress at 0.002 permanent (or plastic) strain. Continued plastic flow beyond the elastic limit produces increasing stress levels—a process called work hardening. During this stage, the sample deforms uniformly, elongating and thinning while the volume remains constant, until work hardening can no longer keep up with the continuing increase in stress caused by the reduction in the sample’s cross-sectional area. At this point, the stress goes through a maximum, called the ultimate tensile strength, and the sample begins to deform non-uniformly, or neck, before it fractures in a ductile manner. In soft, annealed fcc metals, the typical total plastic (or permanent) strain immediately prior to fracture is 0.20 to 0.50.
For most engineering purposes, metals are regarded as having failed once they have yielded and are normally loaded at well below the yield point. The calculations in this study show that the cladding probably will exceed the yield point but thermal expansion of the fuel produces very small elongations (strains) from 35˚C (95˚F) to 600˚C (1112˚F). So even though the yield point may be exceeded, it is likely that the plastic strain encountered in the cladding will be only a small percent of the failure strain at fuel temperatures below the 640˚C (1184˚F) fuel melting temperature so that cladding failure is not expected.
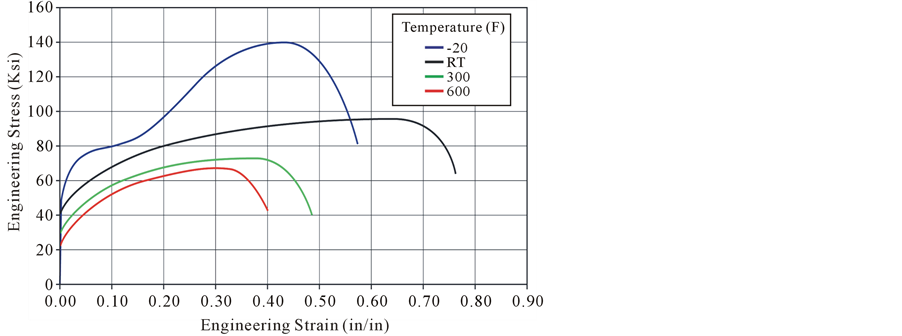
Blanford [13] measured the stress strain for 304 L stainless at four temperatures (see Figure 5, note 1 ksi = 1000 psi). At room temperature (RT), the yield strength of the test specimens varied from 37,800 to 44,300 psi. The ultimate strength varied from 95,700 to 97,300 psi for the 304 L. The engineering total strain, or engineering strain at fracture, varied from 71% to 82%. Measured reduction in area was quite high (ranging from 76% to 89%) showing good ductility qualities over the temperature range.
Although the stress at different temperatures will be evaluated, the stress strain curve from Figure 5(a) at room temperature will be used in the analysis for all temperatures. The model results indicate that the strain will be greater than the yield strain for stainless steel 304 L but is still very small. The ratio of the elongation/original length for unrestrained expansion of the fuel from room temperature to 600˚C (1112˚F) using a high value of the coefficient of thermal expansion is 0.0161 in/in. This is the maximum strain the clad could undergo for a fuel element at or less than 600˚C (1112˚F). This strain only corresponds to about 1/10th of the smallest division (0.1 in/in) in Figure 5(a).
As mentioned, the stress strain curve for 304 L stainless steel was approximated with the room temperature stress strain curve. Only the small strain region was considered since the strains are small. The data for the small strain region is shown in Figure 5(b).

Figure 4. Stress strain graph for a typical metal [4] .
 (a)
(a) (b)
(b)
Figure 5. (a) Stress strain measurements based on original cross-sectional area; (b) Data expanded for small strain region (black is room temperature).
4. Analytical Models
Two models are considered in this paper, the first assumes linear stress strain materials for both the fuel and the cladding, the second allows the cladding to have a non-linear stress strain relationship. The linear model produces very high stresses whereas the non-linear allows the cladding to plastically deform which relieves the high stress without leading to failure of the cladding. Both these models assume there is very little friction between the fuel and the cladding. Calculations show that this is a reasonable assumption for most of the fuel elements.
4.1. Stress Analysis Assuming the Stress Is Below the Yield Stress
This section presents equations used to calculate the compression in the fuel plate and the tension in the cladding for a fuel element raised to a given temperature assuming a linear stress strain material. The assumption is made that the stress is zero at room temperature. Also, due to the large conductivity of both the fuel and the cladding metals, both are probably at the same temperature but different temperatures are assumed just to keep the solution general. The linear model developed to determine this stress is presented in this section. It is realized that the fuel element is at a slightly higher temperature than room temperature when manufactured so that this calculation may be slightly conservative.
The length of the fuel and cladding when the fuel element is raised to a higher temperature is evaluated in a two step process. First, the length of both the fuel and cladding is evaluated at the new temperature as if each were unconstrained. The second step consists of finding the tensile stress in the cladding and the compressive stress in the fuel that will bring them both to the same length.
Step 1 The change in length each material undergoes if each were unconstrained to expand would be:
 (1)
(1)
 (2)
(2)
where T0 = Temperature at which the fuel element was made TF = Fuel temperature at new time, t = t1
TC = Clad temperature at new time, t = t1
αi = Coefficient of thermal expansion, CTE The new lengths at the new temperature are obtained by adding the change to the original length:
 (3)
(3)
 (4)
(4)
Step 2 The fuel will want to expand more than the cladding since . However, the cladding end caps will constrain the fuel to keep the clad and fuel the same length. This requires that the tensile force on the clad, FC, to be equal to and of opposite sign as the compressive force on the fuel, FF since equilibrium on the fuel element requires
 (5)
(5)
The length of the fuel and cladding, L, which satisfies this condition can be obtained by applying Hooke’s law to each metal to bring each metal to this unknown length. Then by substituting into Equation (5), the length L can be obtained.
Assuming that both materials are in the linear range, the tensile stress,  , required to lengthen the clad to the common length L using Hooke’s law is:
 (6)
(6)
where AC = Area of the clad EC = Young’s modulus for the clad
 = Poisson’s ratio, dimensionless
 = cladding strain,
 .
.
The compressive stress,  , needed to compress the fuel to the common length L is:
 (7)
(7)
where the same definitions apply to the fuel.
Substituting these two forces into Equation (34), which add up to zero, gives:

or rearranging to collect terms containing L yields

This equation may be solved for L:
 (8)
(8)
This value of L is substituted into Equations (6) and (7) to get the strains and stresses.
 (9)
(9)
4.2. Stress Analysis with the Stainless Steel Stressed Beyond the Yield Stress
In performing the stress calculations with the above equation, the stress in the clad for higher temperatures exceeds the yield stress for stainless steel. The above analysis was modified to take the non-linear stress strain curve into account.
The force must still be in equilibrium so that Equation (5) is still valid:
 (10)
(10)
The tensile stress,  , required to lengthen the clad to the common length L is:
 (11)
(11)
where , a function of the strain, has replaced the product of the Young’s Modulus and the cladding strainfor the cladding in Equation (6). The equation which is used to represent the room temperature data in Figure 5(b) is
 (12)
(12)
As before, the compressive stress,  , needed to compress the fuel to the common length is:
 (13)
(13)
Substituting the two forces from these stresses into Equation (10) gives:
 (14)
(14)
Now the value of L is solved for by iteration to make the above function G equal zero.
As before, this value of L is substituted into Equations (39) and (40) to get the strains and stresses.
 (15)
(15)
Using the more realistic values of CTEs requires taking into account that the fuel expansion includes step changes in the fuel CTE. This is included in the model by modifying Equation (2) for the fuel length thermal expansion as:
 (16)
(16)
where Ti is the temperature at which the CTE changes from  to
to .
.
5. Results
A conservative calculation was first performed using a constant CTE for both materials with  = 0.000028/˚C and
  = 0.000016/˚C. In reality, as pointed out in Section 1.2, the fuel CTE is about the same as the cladding CTE at low temperatures but increases at higher temperatures. A second more realistic calculation was performed with variable values later in this section.
The range of strain which corresponds to the amount of strain calculated for the ZPPR fuel cladding is a small fraction of the total range in Figure 5(a). This smaller range is shown in Figure 6 as well as the approximate fit (Equation (12)) used to represent the data. It is noted that once the cladding yield stress is exceeded, the cladding stress in the plastic region increases only a small amount for large increases in the strain.
5.1. Results with Constant CTE’s
The calculated increase in length of the 8-in.-long fuel for the complete range of temperatures of interest is shown in Figure 7. Results from both the elastic (linear) and elastic-plastic (non-linear) models are shown. The lower (red) line is the result obtained assuming a constant Young’s modulus (that is, the elastic model), and the upper (blue) is obtained with the non-linear stress strain curve of Figure 6 (that is, the elastic-plastic model). The temperature corresponding to the yield stress temperature is about 170˚C (338˚F) for this set of CTEs. It is noted that the total elongation is very small (0.05 in.) even for the highest temperature 600˚C.
The strain is shown in Figure 8. Note that the strain is less for the elastic model (lower line) than for the elastic-plastic model (upper line). Both models are the same until the yield stress temperature is reached and then they deviate.
The stress is shown in Figure 9. The stress is much higher when using the elastic model (upper line) than the elastic-plastic model (lower line). The elastic-plastic stress appears to be almost constant for fuel temperatures above the yield (even though it is increasing a small amount with increasing temperature). It is seen that a small amount of plastic strain resulting from the elastic-plastic model results in a significant stress relief.

Figure 7. Elongation for conservative thermal expansion coefficients.

Figure 8. Strain for conservative thermal expansion coefficients.

Figure 9. Stress for conservative thermal expansion coefficients.
5.2. Variable CTE Results
The stress and strain calculation was repeated assuming that consistent with Section 1.2.1 the CTE for the fuel increases at higher temperature. The clad remains constant at 0.000016/C. The fuel values are approximated by TF < 227 CTE = 0.000016/C, 227 < TF < 545 CTE = 0.000028/C, 545 < TF CTE = 0.000052/C.
The stress plot (lower line) is presented in Figure 10. The original constant CTE elastic model (upper line) is included for comparison.
The clad stress is zero when the CTEs of cladding and fuel are the same up to 227˚C. Then the clad stress increases at the same rate as the elastic model until the clad yield point is reached at 370˚C (698˚F). The maximum elastic-plastic stress reaches approximately the same value as in the previous constant CTE case but does not reach it until 370˚C (698˚F). The rate of stress increase is very small after this with a slight increase when the CTE of the fuel increases to 0.000052/C at 545˚C.
The strain (lower line) is shown in Figure 11. It remains zero until the fuel CTE increases to 0.000028/C. Then it starts to increase with the same slope as the elastic (upper line) model until the elastic limit is reached where the strain increases at a faster rate. At 545˚C, the fuel CTE increases and the strain rate increases again to accommodate it even though the stress does not increase much.
6. Comparison of the Calculated Stress to the Ultimate Stress
As previously mentioned, the ultimate stress is defined as the maximum stress at which a material will not rupture. So it is probable that no holes will develop in the cladding if the stress is below this value. The ultimate stress (as well as the yield stress) varies with temperature as is shown in Figure 5(a). The ultimate stresses for three temperatures for which he presents yield stress data (room temp, 149˚C [300˚F], and 316˚C [600˚F]) are
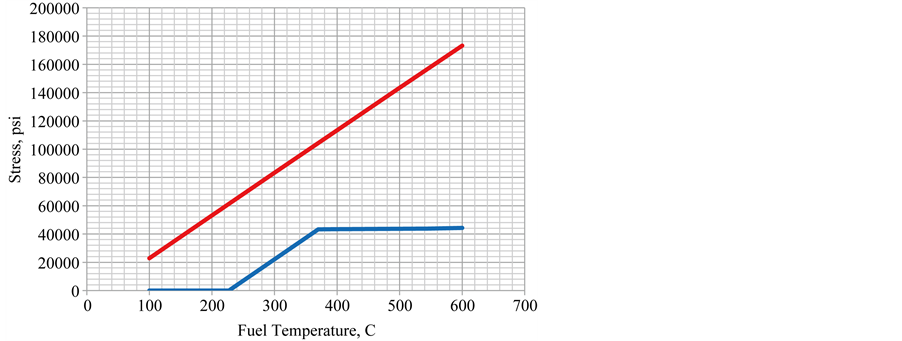
Figure 10. Stress best estimate thermal expansion.
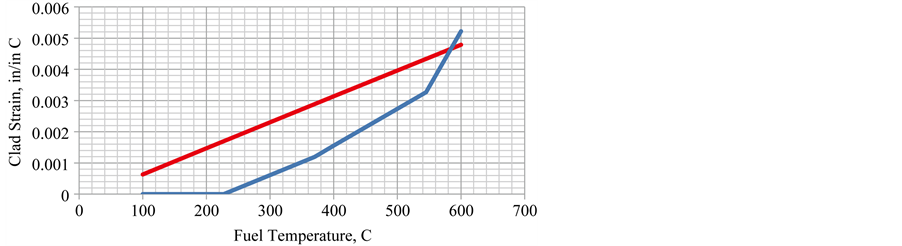
Figure 11. Strain best estimate thermal expansion.
plotted in Figure 12. The data are extrapolated to 600˚C (1112˚F) with a straight line which is probably conservative since the three data points indicate that the ultimate stress decreases at a decreasing rate with temperature.
A similar plot is included in Figure 13 for the strain. It has also been extrapolated by a straight line which is also probably conservative.
The highest temperature calculated in Ref. [2] is less than 290 (554˚F), which, according to Figure 12, has an ultimate stress of over 68,000 psi and, according to Figure 13, an ultimate strain of 0.325. Note, the data covers this maximum calculated temperature. The maximum stress calculated with the elastic plastic model is 42,000 psi at 600˚C. The maximum strain calculated is less than 0.005 for the maximum design temperature of 600˚C. In soft, annealed fcc metals, the typical total plastic (or permanent) strain immediately prior to fracture is 0.20 to 0.50 (according to Ref. [4] ). Therefore, it is concluded that since the calculated stresses are far below the ultimate stress and the maximum strain is far below the 0.20 strain lower limit damage criterion, no failures or holes in the cladding would be expected due to thermal expansion at the storage temperatures of the fuel.
Two additional items should be noted which reinforce this conclusion. The first is that the analysis was done using room temperature stress strain data. If higher temperature data were used, the calculated stress would be lower since the cladding would start to yield at a lower temperature and lower stress although the strain would be higher. The second point noted is that the stress reached with the realistic thermal expansion coefficient is less than 20,000 psi and the strain is only 0.0005 at 290˚C.
7. Conclusions
The conclusion reached based upon the previous data and analysis is that it is unlikely that the fuel element clad could be compromised at the storage temperatures calculated or in any reasonable temperature excursion in the storage room.
There are two items that could affect the ZPPR fuel integrity which are not accounted for in this paper. The

Figure 12. Extrapolated ultimate stresses from Blanford (Ref. Blanford, 2007).

Figure 13. Extrapolated ultimate strains from Blanford [13] .
first is the fact that the material yield behavior data is based on stretching metal bars and assuming the same stress strain behavior applies to a thin metal flat plate 15 mils thick.
The second concerns the differential pressure across the cladding. During initial fuel manufacture in an argon atmosphere, the fuel is evacuated to between one half and one third atmosphere prior to closure. After closure when the fuel is exposed to atmospheric pressure, the free volume between cladding and fuel decreases. Calculations indicate that the internal pressure of the fuel increases to atmospheric and that complete cladding collapse does not occur in most cases. This means there will be some cladding bending due to atmospheric pressure changes that occur over the years of storage so that some fatigue failure of fuel is possible.
Helium is generated in the fuel due to the alpha decay of Pu-241 to Am-241. If this helium diffuses out of the metal and is retained in the fuel plenum, it will increase the internal fuel pressure. The fuel with the high concentrations of Pu-241 has the highest decay heat (and consequently the highest temperatures) would generate the most helium. The higher temperature of this fuel will also increase the fuel pressure.
Acknowledgements
This project was supported by the US Department of Energy, Science and Technology, under contract W- 31-109-ENG-38. This manuscript has been authored by Battelle Energy Alliance, LLC under Contract No. DE-AC07-05ID14517 with the US Department of Energy. The United States Government retains and the publisher, by accepting the article for publication, acknowledges that the United States Government retains a nonexclusive, paid-up, irrevocable, world-wide license to publish or reproduce the published form of this manuscript, or allow others to do so, for United States Government purposes.