Study the Effect of Gamma Radiation on the Optical Energy Gap of Poly(Vinyl Alcohol) Based Ferrotitanium Alloy Film: Its Possible Use in Radiation Dosimetry ()
1. Introduction
Many dyed films had been developed and investigated for possibility of their being used to measure absorbed doses in nuclear reactors and doses of X-rays, gamma rays and electron beam [1] -[6] . All these dyed PVA systems are bleached by irradiation the extent being to which the color change is used for determining the absorbed dose. Radiation bleachable organic dyes were widely investigated [7] . For dose monitoring in radiation processing, the polymeric dyed flexible films are considered to be the most commonly used as dosimeters, indicators [8] . Based on the idea of mixing poly(vinyl alcohol) with two dyes having different sensitivities to radiation, a new label dosimetry system has been developed [9] . Dyed polymeric films containing organic dyes have been investigated to be a useful dosimeter in the high dose application [10] . Exposure of solid materials to ionizing radiation produces changes in the microstructural properties, which affects the optical, electrical and other physical properties of the solid materials [11] . The effect of gamma radiation on optical properties of thin film of tellurium dioxide has been studied. It was found that the optical band gap values were decreased as the radiation dose was increased [12] . The effect of gamma irradiation on the optical properties of polystyrene doped by methylene blue dye has been investigated; the optical band gap was determined and was found to decrease after irradiation [13] . The effect of γ-radiation on the optical and the electrical properties of manganese phthalocyanine thick film was investigated for dosimetry applications [14] . Optical properties of bismuth germinate (Bi4Ge3O12-BGO) thin films under the influence of gamma radiation have been investigated [15] .
In the current work, thin films of PVA colored with different concentrations of the ferrotitanium alloy were investigated to be used as dosimeters for radiation processing, the effect of gamma radiation on optical band gap is studied, and also the effects of relative humidity, preand post-irradiation stability of these films are investigated. The chemical composition of alloy was determined by EDX, and structure of alloy was determined by XRD.
2. Experimental
Preparation of Ferrotitanium Alloy
Ferrotitanium alloy is prepared by the reduction of rutile and ilmenite ores. One of the most used methods of extracting metals from their ores (usually oxides) is the chemical reduction of these oxides by means of a reducing agent, often carbon or another metal. Among these pyrometallurgical reductions, as they are known in chemical metallurgy, reductions with aluminum, referred to as aluminothermy, Ferrotitanium alloy prepared by the reaction of iron oxide and titanium oxide with aluminum powder during which liquid iron and liquid alumina (aluminum oxide) are formed.

The convenient fact that both reaction products are generated in the molten state is due to the fact that the reaction is accompanied by massive heat generation, sufficient to heat the reaction products to well above their respective melting points (3730 F for alumina and 2800 F for iron). In the case of aluminothermy, most usually a heat booster reaction is chosen that involves the oxidation of extra amounts of added aluminum powder with a powerful oxidizer. The worded reaction of the heat booster reaction is simply:

Oxidizers capable of oxidizing aluminum with great generation of heat are a plenty (in fact, all the metal oxides suitable for thermite reductions are great oxidizers, it just so happens that titanium dioxide isn’t very good on its own). Commercially used heat booster oxidizers include chlorates, perchlorates, nitrates and sulphates. By combining the main reduction reaction (titanium and iron dioxide + aluminum) with the booster reaction in the correct ratios, the required reaction temperature can be increased to almost any level, including that where all three reaction products (titanium metal, iron metal calcium sulphide and alumina) are produced above their melting points. From the post-reaction, hot, molten metal/slag mixture. After cooling, the metal (the densest component of the mix) is then found at the bottom of the crucible, nicely protected by the slag from oxidation by air during the cooling step. The ignition mix itself requires quite a bit of heat input to get going (which is why it’s safe to store indefinitely) and the best way of doing this, is by means of magnesium ribbon. Finally bulk sample of ferrotitanium alloy is formed by aluminothermy process, after that this bulk sample converted into powder by grinding process.
3. Instruments
3.1. Irradiation Sources
Irradiation was carried out with the 60Co Gamma chamber 4000A irradiation facility (product of, India). The absorbed dose rate in water was measured to be 3.75 kGy/h using reference alanine dosimeters. The temperature during gamma-ray irradiations was maintained at 37˚C ± 2˚C.
3.2. UV/VIS Spectrophotometer
The absorption spectra of the unirradiated and irradiated films were measured through the wavelength range 300 - 600 nm using a UVIKON 860 spectrophotometer. The film thickness was measured using a Digitrix-Mark II thickness gauge (precision ±1 µm).
3.3. X-Ray Diffraction Techniques (XRD)
X-Ray diffraction has been used to investigate and characterize the structure of the prepared samples. This has been carried out using, “Shimadzu XRD-6000”.
3.4. Energy Dispersive X-Ray (EDX)
The elemental analysis of the prepared samples in the bulk and thin film form were performed by a technique known as Energy Dispersive X-ray (EDX) analysis.
4. Materials
Ferro titanium alloy, Poly vinyl alcohol (PVA) (average mo.wt 25.000 fully hydrolyzed 99% 100% product of J.T baker chemical Co. USA).
5. Preparation of Stock Alloy Solution
Three different concentrations of alloy were prepared by dissolving 0.04, 0.08, 0.12 gm in 15 ml HCl and then complete the volume to 100 ml with double distilled water.
Preparation of Alloy Polymer Films
Films were prepared by dissolving 3.75 gm of PVA (Average mo.wt 25.000 fully hydrolyzed 99% - 100% product of J. T baker chemical/CO. USA), in 75 ml double distilled water. Complete dissolution was obtained by stirring 3 hours at 60˚C followed by continuous stirring for 24 hours at room temperature then left to cool. The polymer solution was divided into 3 parts each of 25 ml. Films were prepared by adding 12.5 ml of stock alloy solution to each part of polymer. The solutions were kept well stirred at room temperature for about 3 h in order to obtain uniformly mixed solution. Each solution was poured on to 15 × 15 cm horizontal glass plate and dried at room temperature for about 48 h. After stripping the films were cut into 1 × 1 cm pieces and were stored in the dark at (RH) of 33%, the film thickness was measured using digitrix-mark II thickness gauge. Three polymer films were obtained, containing 0.4, 0.8 and 1.2 phr (phr = part per hundred parts by weight of resin).
6. Results and Discussion
6.1. Physical Properties of Ferrotitanium Alloy
6.1.1. X-Ray Diffraction Techniques (XRD)
X-ray diffraction has been used to investigate and characterize the structure of the prepared samples. The X-ray diffraction technique indicates that Ferrotitanium alloy samples are amorphous, shown in figure 1.
6.1.2. Energy Dispersive X-Ray
This technique indicates the elemental analysis of ferrotitanium alloy it shows that the alloy contains Fe, Ti, Al and Si with 39%, 41%, 14% and 6% percent respectively, the representation clear in Figure 2.
6.2. Absorption Spectra
The absorption spectra of Ferrotitanium alloy/PVA Film containing 1.2 phr was recorded before and after irradiation to different doses and are shown in Figure 3. The absorption spectrum of the unirradiated film shows a main absorption band in the visible region characteristic to pale yellow color peaking at 352 nm. The intensity of this absorption band decreases gradually with the increase of absorbed dose.
The absorption spectrum of ferrotitanium alloy/PVA film with three different alloy concentrations (0.4, 0.8, and 1.2 phr) is shown in Figure 4. From the figure all concentrations have the same wavelength but differ in their peak height. The peak height depends upon the alloy concentration where it increases with the increase in concentration.
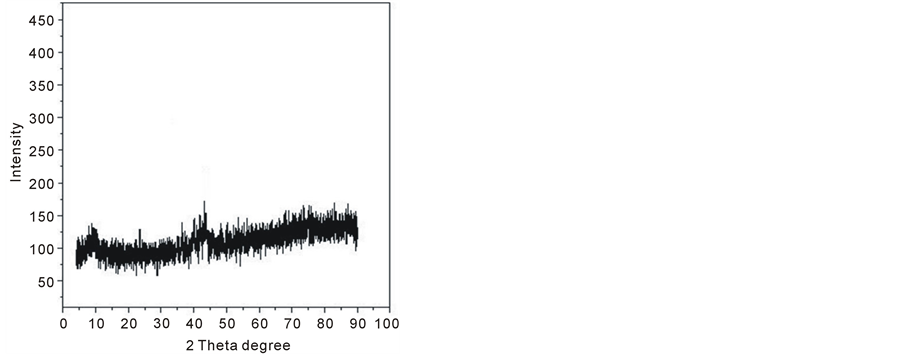
Figure 1. X-ray diffraction patterns of ferrotitanium alloy.
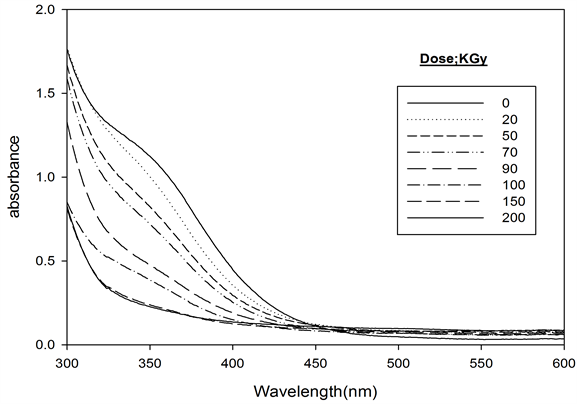
Figure 3. Absorption spectra of ferrotitanium alloy/PVA films unirradiated and irradiated to different absorbed doses [Alloy] = 1.2 phr at λmax = 352 nm.
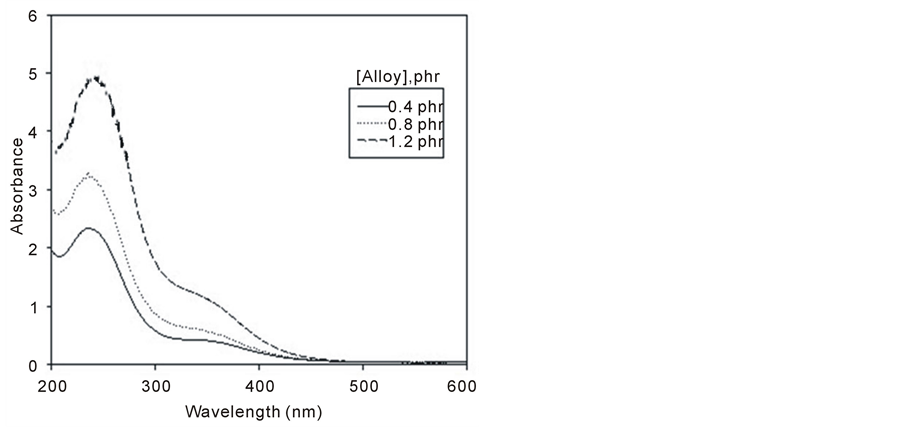
Figure 4. Absorption spectra of unirradiated ferrotitanium alloy/ PVA films unirradiated with different concentrations 0.4, 0.8 and 1.2 phr.
6.3. Response Curves
For dosimetric purposes, absorbance measured at 352 nm for ferrotitanium alloy/PVA films containing different alloy concentrations 0.4, 0.8 and 1.2 phr. Figure 5 shows the response curves in terms change in absorbance per unit thickness, ∆A·mm–1, versus the absorbed dose D, where ∆A = Ao – Ai, Ao and Ai are values of absorbance for the unirradiated and irradiated film respectively. The curves show that the maximum dose range extends up to 200 kGy for Alloy/PVA films, it can be seen that all curves have the same trend but differ in their slopes depending on Alloy concentration.
6.4. Optical Energy Gap
The optical energy gap in which, the minimum of the conduction band and the maximum of the valence band, The relation between the optical energy gap, absorption coefficient and energy hυ of the incident photon is given by [16] [17] :
 (1)
(1)
where Eg is the optical energy gap; α is the absorption coefficient; B is a constant; and r is an index which can be assumed to have values of 1/2, 3/2, 2 and 3, depending on the nature of the electronic transition responsible for the absorption. r = 1/2 for allowed direct transition, r = 3/2 for forbidden direct transition and r = 3 for forbidden indirect transition, and r = 2 refers to indirect allowed transitions. The absorption coefficient for direct transition takes the values from 104 to 105 cm−1, while the absorption coefficient for indirect transition takes the values from 10 to 103 cm−1 [18] . The absorption coefficient α can be calculated according to urbach rule [16] as follows:
 (2)
(2)
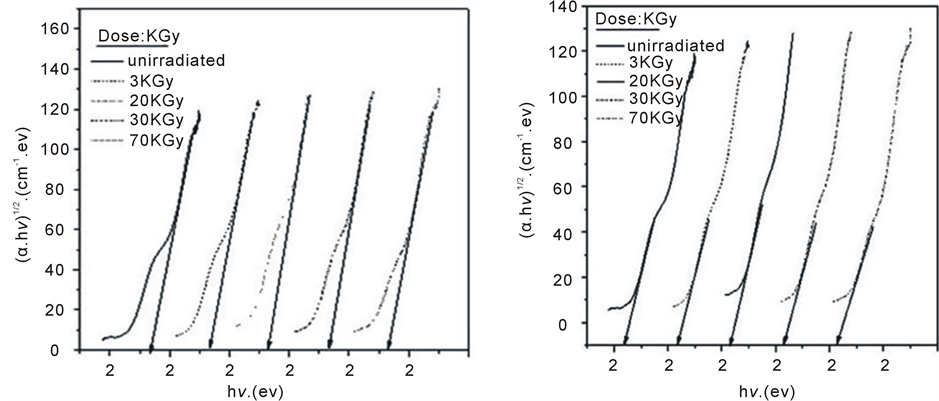
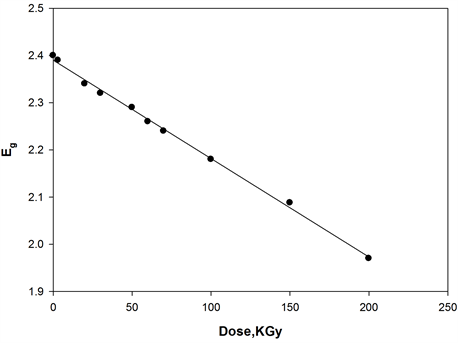
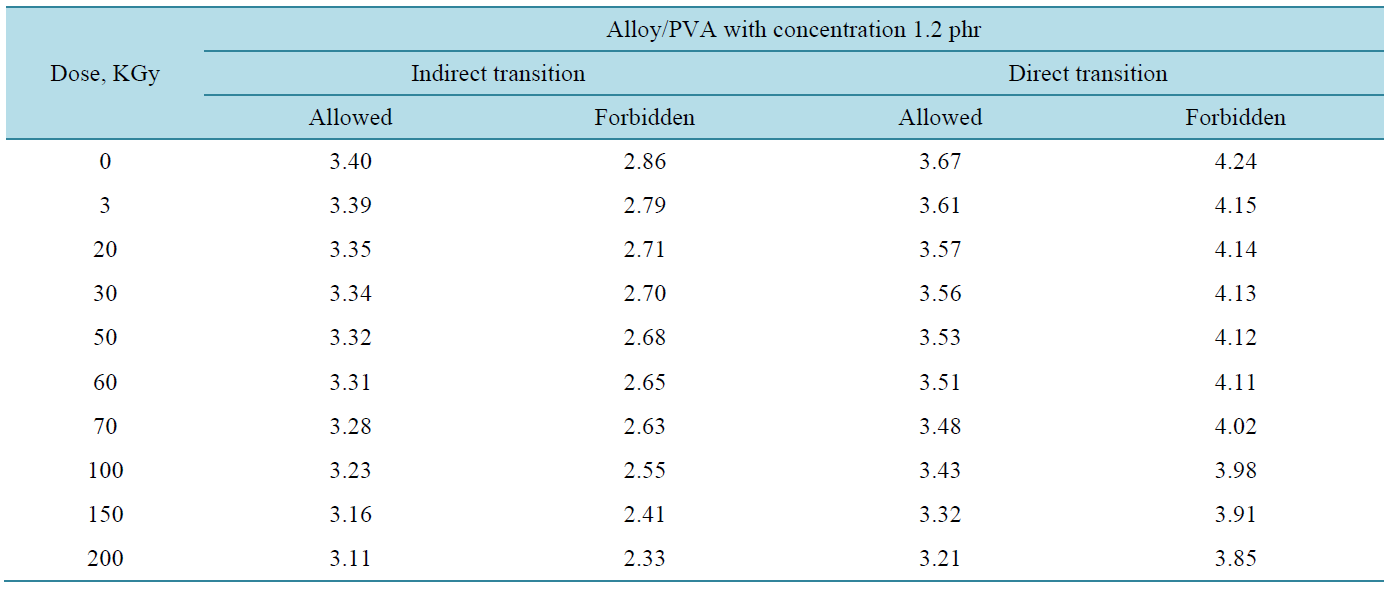
where, I0 and It are the intensities of the incident and transmitted light, respectively, L is the thickness of the sample (cm). The optical energy gap can be evaluated from the linear plots of (αhυ)n as a function of energy at different doses, as shown in figure 6(a), figure 6(b). Extrapolations of these plots to the point at which they cross the abscissa give the values of optical energy gap. The plots show Eg decreases with increasing absorbed dose indicated in figure 7(a), figure 7(b). table 1(a), table 1(b) represents the value of Eg for both direct and indirect transition (allowed and forbidden) for ferrotitanium alloy /PVA film with concentration 1.2 phr. From the
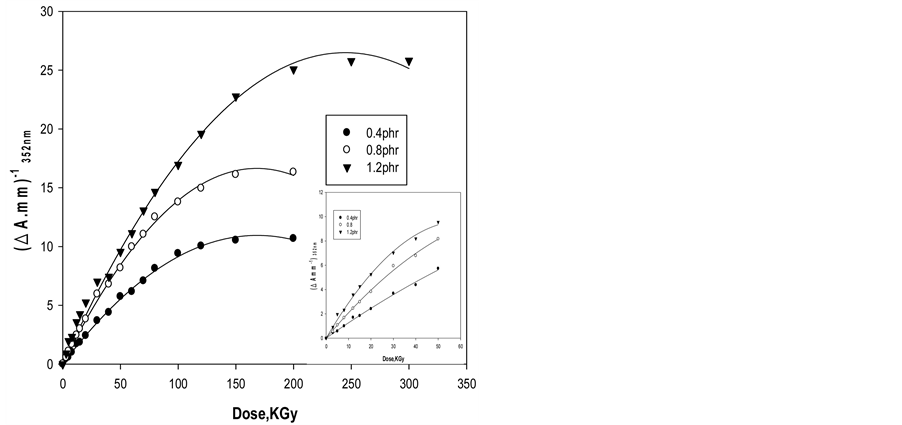
Figure 5. Change of ∆Amm−1 as function of absorbed dose of Ferrotitanium Alloy/PVA films containing different concentration of Ferrotitanium Alloy 0.4, 0.8, 1.2 phr.
 (a) (b)
Figure 6. The relation between (αhυ)1/2 and photon energy for ferrotitanium alloy/PVA films irradiated with different doses.
table it can be seen that Eg decreases with the increase of absorbed dose. Both calculated results from the table show that calculation of Egap can be detected from figure 6(a), figure 6(b) from two different areas. The optical energy gap for the ferrotitanium alloy has the possibility to have two different values; this is because this alloy containing iron and titanium elements both have atomic structure with many valence states. The present results were found to obey equation (1) with r = 2 for all films, which indicated indirect, allowed transitions.
The decrease in the energy gap with increasing absorbed dose may be attributed to an increase in structural disorder of the irradiated Ferrotitanium/PVA film. These contributed to the structural defects, which reduce the energy gap with increasing dose [18] [19] .
6.5. Stability
Stability measurements, before and after irradiation were examined by storing films in the dark and light, and
 (a)
(a)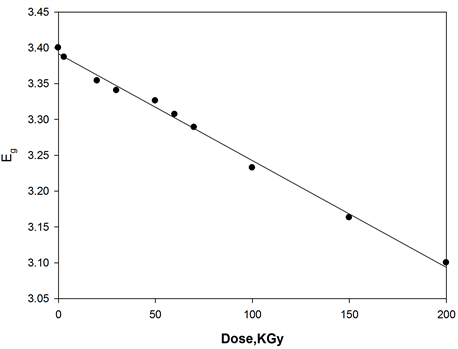 (b)
(b)
Figure 7. Change in the optical energy gap as function of irradiation dose of [ferrotitanium alloy/PVA] = 1.2 phr.
 (a)
(a)  (b)
(b)
Table 1. The values of Eg for direct and indirect transitions (allowed and forbidden).
measure the films spectrophotometrically at different times during the pre-irradiation storage period of 30 days.
6.5.1. Pre-Irradiation Stability
The color stability of ferrotitanium alloy/PVA films were tested before irradiation by storing the films at room temperature under laboratory fluorescent light. Figure 8 represents the change in Ai/Ao of the tested films, were measured at 352 nm for PVA films at different intervals time during the storage period of 30 days. It can be seen that, films exhibit excellent stability before irradiation.
6.5.2. Post-Irradiation Stability
Ferrotitanium alloy/PVA films containing 1.2 phr of alloy irradiated to a dose of 100 kGy, then stored at room temperature 25˚C ± 30˚C in the laboratory fluorescent light, the absorbance of these films were measured at 352 nm for PVA films at different intervals of time during the storage period of 30 days. The change in absorbance as a function of storage time relative to that at zero time immediately after irradiation is shown in Figure 9. From which it can seen that, ferrotitanium alloy/PVA films shows a good stability, until the end of storage period.
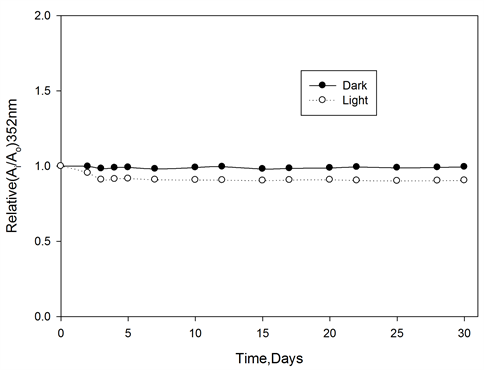
Figure 8. Pre-irradiation stability of ferrotitanium Alloy/PVA films stored in dark and light at room temperature, wavelength of analysis 352 nm.
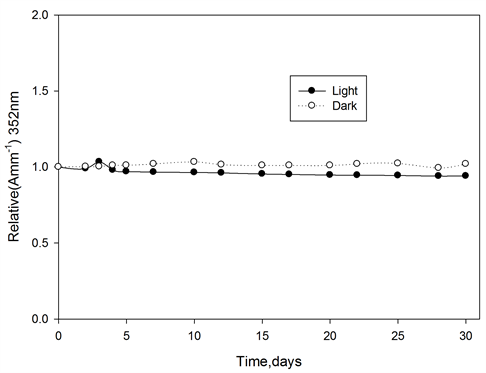
Figure 9. Post-irradiation stability of ferrotitanium Alloy/PVA films stored in dark and light at room temperature, wavelength of analysis 352 nm.
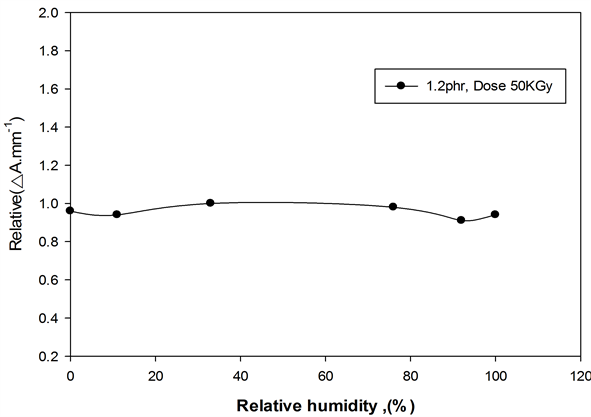
Figure 10. Variation of ∆Amm−1 as function of relative humidity during irradiation. Dose 50KGy, at λmax = 352 nm.
6.6. Humidity during Irradiation
The effect of relative humidity (RH) during irradiation on the response of ferrotitanium alloy polymer films was investigated by irradiating films to dose of (50 kGy) at the different relative humidities (0%, 11%, 33%, 76%, 92% and 100% RH). The different relative humidity was maintained by using different saturated salt solutions [20] . The films were stored before irradiation for a three-day period under the same relative humidity conditions as when irradiated, so that equilibrium moisture content in dosimeter is established during irradiation. Figure 10 represents the relative variation in ∆Amm−1 at 352 nm for ferrotitanium alloy/PVA as function of percentage relative humidity during irradiation, relative to that at 33%, the response of the films are almost flat in the range of relative from 0% - 100%.
7. Conclusion
Films made of PVA with ferrotitanium alloy containing different concentration of alloy are useful radiation dosimeters in the high dose range; dose range depends on the concentration of alloy. The color of these films changes from yellow to colorless. The chemical composition of alloy was determined by EDX, and structure of alloy was determined by XRD. The response of these films has negligible humidity effects on the range of relative humidity from 0% - 100% as well as good preand post-irradiation stability when stored in dark and light at room temperature. The optical energy gap was found to decrease with the increase of absorbed dose; the decrease in the energy gap with increasing absorbed dose may be attributed to an increase in structural disorder of the irradiated Ferrotitanium/PVA film.