Sub-Canopy Temperature Dynamics of a Native Tree Plantation from a Lowland Tropical Rainforest in Costa Rica ()
1. Introduction
Agroforestry trials, assorted species of trees and shrubs grown on farm lands are important sources of fodder which, in turn, are converted into valuable plant nutrients, mostly by livestock (Carson, 1992; Yadav, 1992). Agroforestry also is used to improve the productivity among small farms and ecologists are helping to sustain agricultural productivity for land in farm systems (Bowler et al., 2002). The forest ecosystem is an important factor to sustain production per unit of cultivated land (Neupane & Thapa, 2001). Within farming systems analysis it is being widely speculated that some forms of agricultural management are more sustainable than others (Dalsgaard et al., 1995). In particular, systems undertaking integrated resource management such as agroforestry and integrated agriculture-aquaculture, where nutrients are recycled between components within the system, are regarded as ecologically sustainable (Schroth et al., 1999). Conversely, intensive monoculture systems with low levels of diversity are viewed as having a fragile equilibrium, with control coming from external inputs rather than from internal feedback mechanisms (Ingram & Swift, 1989).
When rainforests are cleared for agricultural use, vegetation that can regrow with similar forest canopy temperatures has the highest chance of survival. Where the population density is too high for sustainable shifting agriculture, land use systems with perennial crops, such as plantation agriculture and agroforestry that provide a permanent soil cover and, to some extent, mimic the natural forest vegetation, are considered more suitable for these conditions than annual cropping systems (Ewel, 1986).
Haggar & Ewel (1997) found that the diversity of different plant life forms in tropical forests and its effects on increase productivity and resource exploitation may be due to complementary resource use. The study also looked at biodiversity in sustaining ecosystem processes in order to assess productivity, as influenced by complementary and competitive resource use. Haggar and Ewel’s (1997) objective was to see how temperature affects the sustainability aspects of agroforestry which resulted in tropical ecosystems, both natural and managed, that include a combination of plant life forms having the potential to be more biologically productive and more thorough in use of resources than most monoculture plots. The objective of our study was to evaluate the canopy temperature dynamics of 15-year-old polyculture and monoculture plots, to those in Secondary Forest stands. Our project will identify temperature zones in the lower canopy of monoculture, polyculture, and secondary forest stands as well as temperature differences between plot types. We hypothesized that the polyculture sites would have a similar temperature gradient in comparison to the surrounding secondary forest canopy temperatures.
2. Methods and Materials
This study was conducted during March 1-4, 2011 at La Selva Biological Station located in Puerto Viejo de Sarapiquí (Heredia Province), Costa Rica. La Selva Biological Station is located in a lowland tropical rainforest and is operated by the Organization for Tropical Studies (OTS). The station has areas of old-growth forest, secondary and selectively logged forest, pasture land, and swamp land. For our study, we used a 15-year-old agroforestry stand established by the OTS “Plagas” project located at the intersection of the “SenderoTres Rios” (STR) trail and the “Sendero el Atajo” (SAT) trail.
Three Pentaclethra macroloba monoculture plots (single-species stands) and three polyculture plots (mixedspecies stands of five native trees: P. macroloba, Virola koschnyi, Hieronyma alchorneoides, Stryphnodendron microstachyum, Vochysia ferruginea) were used in this study. In each of these six agroforestry plots, a single focal P. macroloba tree located at the center of the plot was selected for the evaluation of the sub-canopy temperature gradient. Additionally, three focal P. macroloba trees were selected from the secondary successional forest located adjacent to the OTS “Plagas” study plots. Both the agroforestry plots and the successional forests were of similar age and structure (Matlock & Hartshorn, 1999). On each of the nine focal trees, flagging tape was tied to the trunk and four thermochrons were tacked on to the North facing side using push pins.
The thermochrons were tacked on at four heights: 0 m (the base of the trunk), 1.25 m, 2.5 m, and 5 m. A ladder was used to reach the 2.5 m and 5 m heights. The thermochrons measured temperature (˚C) readings every hour and all of the thermochrons were set up by March 2, 2011. All thermochrons were removed on the morning of Friday March 4, and all data was immediately downloaded.
Distribution of the canopy temperature data was tested for normality using a Shapiro-Wilks test. Canopy temperature transformed using Equation (1):
 (1)
(1)
where “x” is canopy temperature. The transformed canopy temperature data was evaluated with respect to plot type, hour, and height using a 3-way ANOVA. A Post-hoc Fisher’s LSD test was used to identify significant differences due to hour, height and plot type.
3. Results
We detected canopy temperature differences with respect to the interaction of hour and height (Table 1). There were no significant differences in temperature between 0 m and 5 m from 0 hrs to 1000 hrs as well as from 1700 hrs to 2300 hrs. Canopy temperatures only differed between the heights of 0 m and 5 m from 1000 hrs to 1700 hrs (Figure 1). During this time frame there are two to four distinct thermal zones that form (Table 2, Figure 1 and Figure 2). There are two zones between 1000 hrs and 1300 hrs, three zones at 1300 hrs, four zones at 1400 hrs, three zones between 1400 hrs and 1700 hrs, and only two zones at 1700 hrs. At 5 m, the canopy had the biggest temperature fluctuations, with temperatures ranging from about 20˚C to about 27.5˚C, reaching its peak temperature at 1300 hrs. On the canopy floor (0 m) there was the least amount of temperature fluctuation with temperatures ranging from about 20.5˚C to about 25.5˚C, reaching its peak temperature also at 1300 hrs.
We also detected canopy temperature differences with respect to the interaction of hour and plot type (Table 1). There was no difference in temperature for the plots (monoculture, polyculture, and secondary forest) between 0 hr and 1000 hrs as well as between 1700 hrs and 2300 hrs. The temperatures differed for monoculture, polyculture, and secondary forest plots between 1000 hrs and 1700 hrs (Figure 3). The surrounding secondary forest had significantly warmer temperatures than both monoculture and polyculture plots between 1000 hrs and 1200 hrs. The monoculture plots had similar temperatures to the surrounding secondary forest between 1200 hrs and 1500 hrs and both plots (monoculture and secondary forest) had higher temperatures than the polyculture

Table 1. Differences in mean temperature with respect to plot type (P), hour of day (H), and canopy height (C).
Table 2. P-values for post-hoc differences in temperature with respect to the hour of day and canopy height (Fisher’s LSD). Asterisks (*) denote significant differences between stated canopy heights at an α-level of 0.05.
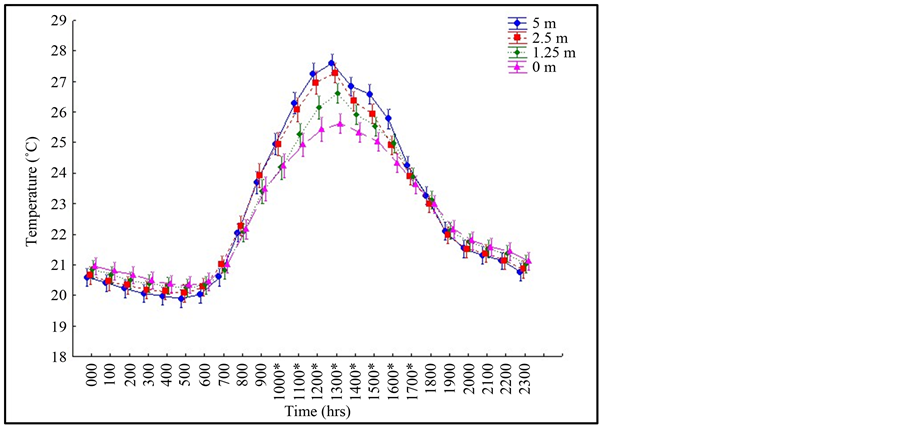
Figure 1. Canopy temperature fluctuations by hour of day and canopy height. Asterisk (*) denote significant temperature differences among canopy heights (Fisher’s LSD).
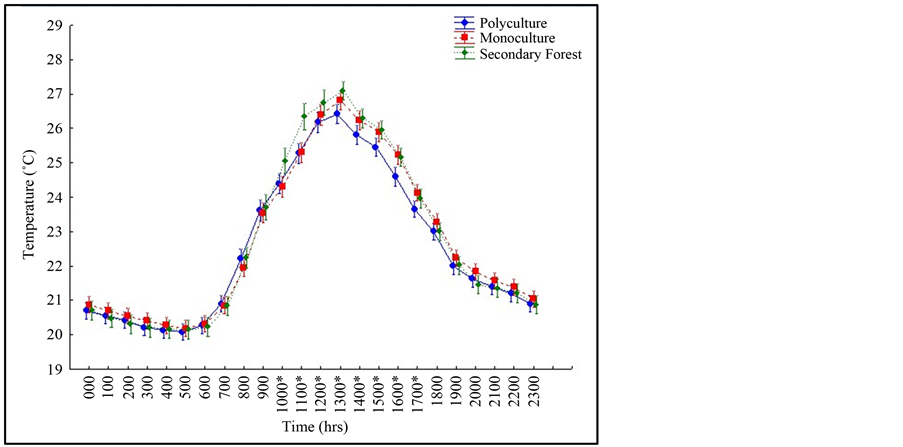
Figure 2. Canopy temperature fluctuations by hour of day and plot type. Asterisk (*) denote significant temperature differences among plot types (Fisher’s LSD).
plots (Table 3). At 1500 hrs polyculture temperatures are significantly lower than the surrounding secondary forest while the monoculture plot temperatures are intermediate to both polyculture and secondary plot temperatures. At 1600 hrs, monoculture temperatures are significantly higher than polyculture and secondary plot temperatures. At 1700 hrs, monoculture plot temperatures were significantly warmer than polyculture plot temperatures while secondary forest temperatures were intermediate to both monoculture and polyculture plot temperatures.
4. Discussion
A specific temperature gradient is formed in the canopy between 1000 hrs and 1700 hrs as the forest layers heat up at different rates. Thus, the canopy serves as a natural buffer controlling the speed at which the forest heats
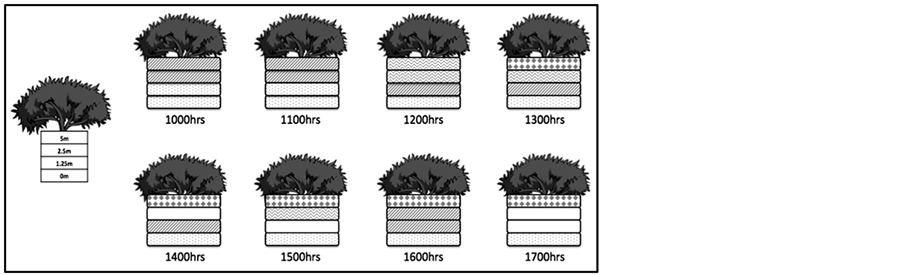
Figure 3. Diagram of the distinct thermal zones created in the sub-canopy of the agroforestry plots throughout the day. Boxes with patterns denote significantly unique microclimates (i.e. significantly different temperatures between agroforestry and secondary forest plots). Boxes without patterns (white) denote temperatures that are similar to neighboring thermal zones (i.e. boxes above and below).
Table 3. P-values for post-hoc differences in temperature with respect to the hour of day and plot type (Fisher’s LSD). Asterisks (*) denote significant differences between stated plot types at an α-level of 0.05.
up and cools down throughout the day. The temperature fluctuations at the different heights create microclimates throughout the different levels (between 0 m and 5 m). Organisms living in the different zones of the canopy will need to specialize in these temperature fluctuations or move to a different area. A study Dial & Roughgarden (1995) examined poikilotherms in a tropical rain forest canopy; they found that lizards in the genus Anolis had strong effects on the arthropod community. When lizards were removed, the arthropod population increased significantly. This suggests that if poikilotherms cannot handle the temperature fluctuations in the canopy, they may move to different areas of the forest affecting arthropod populations.
In addition to temperature zones, we also found that the P. macroloba monoculture plot temperatures loosely matched the average temperatures found in the surrounding secondary forest better than the five mixed-species polyculture plots. Results showed that the monoculture plot temperatures were similar to the surrounding secondary forest for all hours of the day except 1000 hrs and 1100 hrs. The polyculture plot temperatures on the other hand were significantly lower than the temperatures observed in the secondary forest between 1000 hrs and 1600 hrs, during the hottest part of the day.
Our microclimate data suggests that the temperature variation in the forest sub-canopy may be better explained by the density of P. macroloba, rather than the species richness of trees in a given plot (e.g polyculture vs. monoculture). This observation is especially important given that P. macroloba, a successional species, is the most abundant tree in the forests at La Selva Biological Station (Lieberman & Lieberman, 1994; Shebitz & Eaton, 2013). Additionally, while the monoculture and polyculture agroforestry plots differed significantly by a few degrees Celsius, the resulting microclimate divergence suggest that interspecific interactions in the sub-canopy (e.g. herbivory) can be expected to differ in these agroforestry systems (Dial & Roughgarden, 1995).
5. Conclusion
After 15 years of growth, the native tree sub-canopy of both the monoculture and polyculture agroforestry plantations at La Selva Biological Station still do not resemble the sub-canopy microclimates of the surrounding successional secondary forest. This suggests that simply re-planting native trees does not equate to full forest dynamics, and that successional process within tropical forest canopies differs from the process of above-ground growth that occurs in agroforestry plots. This field-study further shows that the successional changes in species composition and the interspecific interactions in tropical forest sub-canopies merit further attention. As Geographic Information System (GIS) tools better assess changes in tropical forest mosaics (Arroyo-Mora et al., 2005), the more important the characterization of processes in successional forest microclimates becomes for the sustainable management of agroforestry trials and the resilience of agroecology systems. As such, future studies should characterize the variation of interspecific interactions within the canopy dynamics of agroforestry, agroecological and urban forest landscapes.
NOTES
*Corresponding author.