1. Introduction
Fig (Ficus carica L., Moraceae), one of the most ancient cultivated fruit trees in the Mediterranean region which is the most important fig growing center worldwide, has recently drawn much attention because of its medicinal and nutritional values [1] [2] .
In Palestine, locally adapted fig landraces and their wild forms, can be found growing all over the country with high level of phenotypic diversity in fruit color, size, shape, and flavor [3] . The fig germplasm consists of numerous landraces mainly selected by farmers for their fruit qualities and maintained in orchards. They are widely spread through different eco-geographical areas of the country and are threatened by genetic erosion due to biotic and abiotic stresses. Local fig landraces are available with different local names which were mainly given based on skin ground color, internal color, and maturity date [4] . The most famous local names are Khdari, Hmadi, Biadi, Khurtmani, Inaqi, Swadi, Mwazi, and Kharoubi. The discrimination between these landraces is, therefore, important for purposes of crop improvement and plant genetic resources conservation [5] .
Prospecting and collecting actions have been initiated in Palestine and led to the identification of more than 50 ecotypes [3] . Initial classification of the Ficus carica landraces was carried out morphologically based on tree, leaf, and fruit characteristics. With support from The Global Environmental Facility (GEF) some of these are ex situ maintained in the Palestinian Fig Collection at the BERC-Til Botanic Gardens, Biodiversity and Environmental Research Center (BERC), Til, Nablus. This ex situ field genebank comprises the main local fig landraces (24 landraces, 2 trees per landrace) in the country. The trees are of similar age and growing under same environmental and cultivation conditions. The collection has been maintained and managed by researchers from BERC since its establishment in 2002.
Phenotypic and DNA-based markers have been used for the identification and characterization of fig genotypes [4] [6] -[10] . However, morphological characters are influenced by plant age, phenological stage, cultivation conditions, and environmental conditions and are therefore prone to phenotypic modifications, in addition to the high plasticity for many morphological traits [10] . Thus morphological characters can often yield unclear results [11] . On the other hand, the use of DNA-based markers (RFLP, AFLP, SSR, ISSR, and RAPD methods) [6] -[8] [12] -[19] has proved to be a powerful tool to assess genetic diversity and genotype identity in figs. In contrast to morphological markers, molecular markers, are stable and are not confounded by the environment effects [8] .
Compared with other molecular techniques, the random amplified polymorphic DNA (RAPD) has considerable advantages because it is a simple, fast, efficient, and inexpensive method. Further, RAPD does not require prior knowledge of the sequences of the markers and can produce abundant polymorphic fragments [19] [20] . Therefore, RAPD has become a powerful and accurate method for analyzing the genetic biodiversity and relatedness in figs [6] [7] [11] [12] [18] [21] .
In Palestine, assessments of biodiversity among nine fig genotypes growing in different parts of the northern West Bank, have been based on morpho-pomological and RAPD markers [11] . The molecular results in this study appeared contradictory to the phenotypic descriptors in several fig genotypes. This was attributed to phenotypic modifications caused by the prevailing weather conditions in the different areas where fig is grown. Other factors could have yielded such results including plant age, phenological stage, and cultivation conditions.
This paper aims to explore the diversity encountered in 24 fig genotypes (10-year-old) growing under the same environmental and edaphic conditions at the Palestinian Fig Collection in BERC-Til Botanic Gardens, Til, Nablus using pomological descriptors and RAPD markers.
2. Materials and Methods
2.1. Plant Material
A total of 24 fig accessions (22 common fig genotypes and 2 caprifigs) preserved in the Palestinian Fig Collection established in 2002 in the BERC-Til Botanic Gardens (altitude: 2008 Ft., latitude: 32˚1′43.42″ N; longitude: 35˚12′15.79″ E) Til, Nablus, Palestine, were sampled for this study (Table 1). The surveyed genotypes (10-year-old trees, 2 trees per cultivar) correspond to the main cultivated fig cultivars in Palestine. The climate is semi-arid Mediterranean climate with mild winter and hot summer. Annual average high temperature is around 21.5˚C (with hottest months being July and August being 28.9˚C), and annual average low temperature is around 10.87˚C (with coldest month is January with the average low temperature around 3.9˚C). Average annual rainfall is about 600 mm. All fig trees are cultivated under rain-fed conditions.
2.2. Molecular Analysis
2.2.1. DNA Extraction
Fresh young leaves were collected from fig accessions and directly ground under liquid nitrogen. Genomic DNA was extracted from the ground leaves of single adult trees using a modified Dellaporta method as described by Lin et al. [22] . After purification, the DNA concentration was estimated spectrophotometrically using Gene5 Take 3 Module (www.biotek.com). DNA integrity was performed by agarose gel electrophoresis [23] .
2.2.2. RAPD primers and PCR reactions
A total of 25 RAPD primers were used for the amplification of random DNA banding patterns (Table 2). PCR reactions were repeated twice and carried out in a 25 µl volume mixture containing: 30 ng of a genomic DNA, 0.25 mM dNTPs, 0.25 mM MgCl2, 2.5 µM primer (company, city), 0.5 U of Taq DNA Polymerase and 1 × enzyme buffer. Consequently, PCR reactions were performed in Gene Amp PCR System 9700 Thermal Cycler (Applied Biosystems). The amplification program was as follows: an initial denaturing step at 94˚C for 5 min, followed by 45 cycles of 94˚C for 0.5 min, 35˚C for 1 min and 72˚C for 1 min, and a final extension at 72˚C for

Table 1. Palestinian Ficus carica L. ecotypes (preserved in a collection established in the BERC Botanic Gardens in Til, Nablus) with their localities of origin.
Table 2. List of selected RAPD primers, resolving power, Polymorphic information content and the degree of the polymorphism obtained among 24 local Palestinian fig varieties.
5 min. Amplified PCR products were resolved on 1% agarose gel stained with ethidium bromide (0.5 mg⁄ml), and the generated bands were visualized with UV transilluminator (Tl-2000 Ultraviolet Translinker, UVP, USA) and digitally photographed (Nikon).
2.2.3. Data Analysis of RAPD Markers
Only bands that were bright and reproducible were scored for analysis. Amplification products were scored as either present (1) or absent (0) for each sample. Besides, RAPD bands were transformed into a binary matrix. A genetic distance matrix was then estimated based on Jaccard’s similarity coefficient using the multilocus fingerprinting data sets containing missing data FAMD software version 1.108. Similarity coefficient is defined as: [Similarity coefficient = (number of bands in common)/number of bands not in common + number of bands in common)] [7] . Consequently, cluster analysis was made using the un-weighted pair group method with arithmetic averages (UPGMA) [24] .
To compare the efficiency of RAPD primers in identifying different fig genotypes the total number of bands and the polymorphic bands were calculated for each primer and the discriminatory power of RAPD marker was evaluated by 2 parameters. The polymorphic information content (PIC) and resolving power (RP) for each RAPD marker. PIC has been known to provide an estimate of the discriminatory power of a locus or loci. It was calculated by taking into account not only the number of alleles that are expressed but also relative frequencies of those alleles. Calculations were made using the following formula as proposed by Roldan-Ruiz et al. [25] : PIC = 1 − ∑fi ², where fi is the frequency of the marker bands present. The ability of the most informative primers to differentiate between cultivars was assessed by the estimation of their resolving power (Rp) [26] . The Rp of the 25 primers was calculated as Rp = ∑Ib where, Ib (band informativeness) takes the value of 1 − (2 × |0.5 − p|) where p is the proportion of genotypes containing the band.
2.3. Pomological Traits Analysis
2.3.1. Plant Material and Descriptors
A total of 21 quantitative and qualitative pomological traits were determined for the 22 common fig genotypes according to the fig descriptors prepared by IPGRI & CIHEAM [27] , and Ajlane & Ferchichi [28] , with some modifications (Table 3 and Table 4).
2.3.2. Data Analysis of Pomological Traits
Each descriptor was scored as 1 for presence and 0 for absence. Accordingly, the relatedness among genotypes was estimated based on Jaccard’s similarity coefficient using SPSS version 16.0. Consequently, cluster analysis was made using the (UPGMA) method [24] .
2.4. Mantel’s Test
Matrices (pomological and RAPD) correspondence test was performed and the significance of the correlation was performed using Mantel's t test to measure the degree of relationship between similarity index matrices produced by the two-marker systems [29] based on 1000 random permutations. These computations were performed using XLSTAT 2008, Version 7.03 (http://www.xlstat.com).
2.5. Data Analysis of Combined RAPD Markers and Pomological Descriptors
A binary matrix was obtained for the combined RAPD bands and pomological descriptors data, as outlined above. A genetic distance matrix was then estimated based on similarity coefficient. Clustering dendrogram was constructed by the UPGMA) method.
3. Results and Discussion
3.1. Molecular Results
3.1.1. Genetic Polymorphism and RAPD Patterns
Twenty five primers were investigated for their potential to evaluate 24 fig genotypes (Table 2). All primers revealed various banding patterns; two primers generated no polymorphic bands. A total of 152 DNA fragments (loci), separated by electrophoresis on agarose gel, were detected (Table 2), ranging in size from 300 to 2000 bp. Of these fragments, 123 (80.921%) were polymorphic and 29 (19.079%) were monomorphic. Compared to those results cited in the literature, our result is one of the highest percentage of polymorphisms ratio among cultivars grown in the Mediterranean countries which ranged between 39% - 81% using RAPD markers [7] [11] [12] [16] [21] [30] [31] . The high degree of polymorphism (about 81%) obtained among Palestinian fig cultivars suggests high genetic diversity in Palestinian fig population at the DNA level, and indicates a promising potential for selection and availability as a genetic source [32] .
Our results also revealed an average of 6.08 loci per primer. However, this low number was according to Khadari et al. [6] and Galderisi et al. [14] adequate to generate useful fingerprints for fig cultivars and clone discrimination and therefore can help with varietal identification in Palestine.
A minimum of one and a maximum of 12 DNA fragments were obtained using (OPH16) and (OPH 12) primers, respectively. The maximum percentage of polymorphic markers was 100.0% in seven primers and the minimum was 0.00% in (OPA03, OPH16) primers.
3.1.2. Resolving Power (Rp) and Polymorphic Information Content (PIC)
The 25 primers exhibited variation with regard to their PIC and Rp values (Table 2). The PIC value of the primers ranged from 0.00 (OPH16) to 0.865 (OPH12) with an average of 0.615 per primer. The collective Rp value of the examined primers showed relatively high value of 27 in which the RAPD primers OPH08, OPA11, OPT20, OPA04 and OPA09 possess high Rp values of 3.5, 3.08, 2.41, 1.833 and 1.833 respectively, and
Table 3. Pomological descriptors determined in some fig (Ficus carica L.) genotypes grown in the Palestinian Fig Collection, West BankPalestine.
therefore were able to distinguish more number of genotypes. Primers having high Rp along with high PIC values are more suitable for analysis of genetic diversity [33] . In the present study the primers OPH08 and OPA11 had high Rp and high PIC values. Hence these two primers seemed to be the most useful primers to assess the genetic diversity in fig cultivars.
Table 4. Pomological descriptors of some fig genotypes grown in the Palestinian Fig Collection, BERC-Til BGs, Nablus, Palestine.
*Landrace abbreviations as in Table 1; Pomological descriptors abbreviations as in Table 3.
3.1.3. Dendrogram of Genetic Relationship (Similarity Matrix and Cluster Analysis)
The data matrix size analyzed was 2701 entries, 901 (33.3%) of which were for present loci (1) and 1800 (66.6%) for absent loci (0). Accordingly, the Jaccard’s coefficient was calculated and presented in (Table 5). The genetic similarity matrix showed an average similarity mean of 0.375. In an earlier RAPD study, Basheer-salimia et al. [11] observed genetic diversity values ranging from 0.238 - 0.477 with a mean of 0.358 among 9 different local Palestinian fig genotypes. The selected RAPD markers in this study revealed a wider range of genetic diversity than that observed by Basheer-salimia et al. [11] . The maximum similarity values of 0.750, and 0.679 were registered between the two wild type accessions and between Ghzali and Zraqi respectively; suggesting low dissimilarities and close relatedness. Whereas, the lowest similarity value of 0.00 (the highest dissimilarity of 1.0) was exhibited between Ajloni and Adloni varieties, and Biadi variety. Among all tested cultivars, Biadi tends to show the lowest genetic similarity values from others. However, the remaining cultivars exhibited somewhat intermediate levels of genetic similarity.
The genetic relationships among the genotypes are illustrated by a dendrogram, generated by UPGMA clustering method (Figure 1). The dendrogram was divided into two main clusters (I, II), and four single branches (Khdari, Kharobi, Slati and Biadi) as supported by their low similarities with other cultivars. The first cluster (I) was divided into four groups (Ia, Ib, Ic, Id). The first group (Ia) was composed of two sister groups (wild type accessions, and Zraqi and Ghzali), and four one-member subgroups (Qraee, Qrawi, Barqawi and Khurtmani). The two wild type accessions clustered together and exhibited the highest similarity value (0.750), followed by Zraqi and Ghzali (0.679) which share many pomological traits such as fruit size, flesh thickness, neck width and others. The second group (Ib) was composed of the two green-yellow fruit skin colored Blati, and Neami cultivars, and the Qaisi cultivar which branched separately. The third group (Ic) was composed of Sfari and Swadi cultivars which although have different fruit skin color of yellow and black-violet, respectively, they share the presence of open ostiole, pulp texture, flesh thickness, and fruit and neck width. The fourth group (Id)
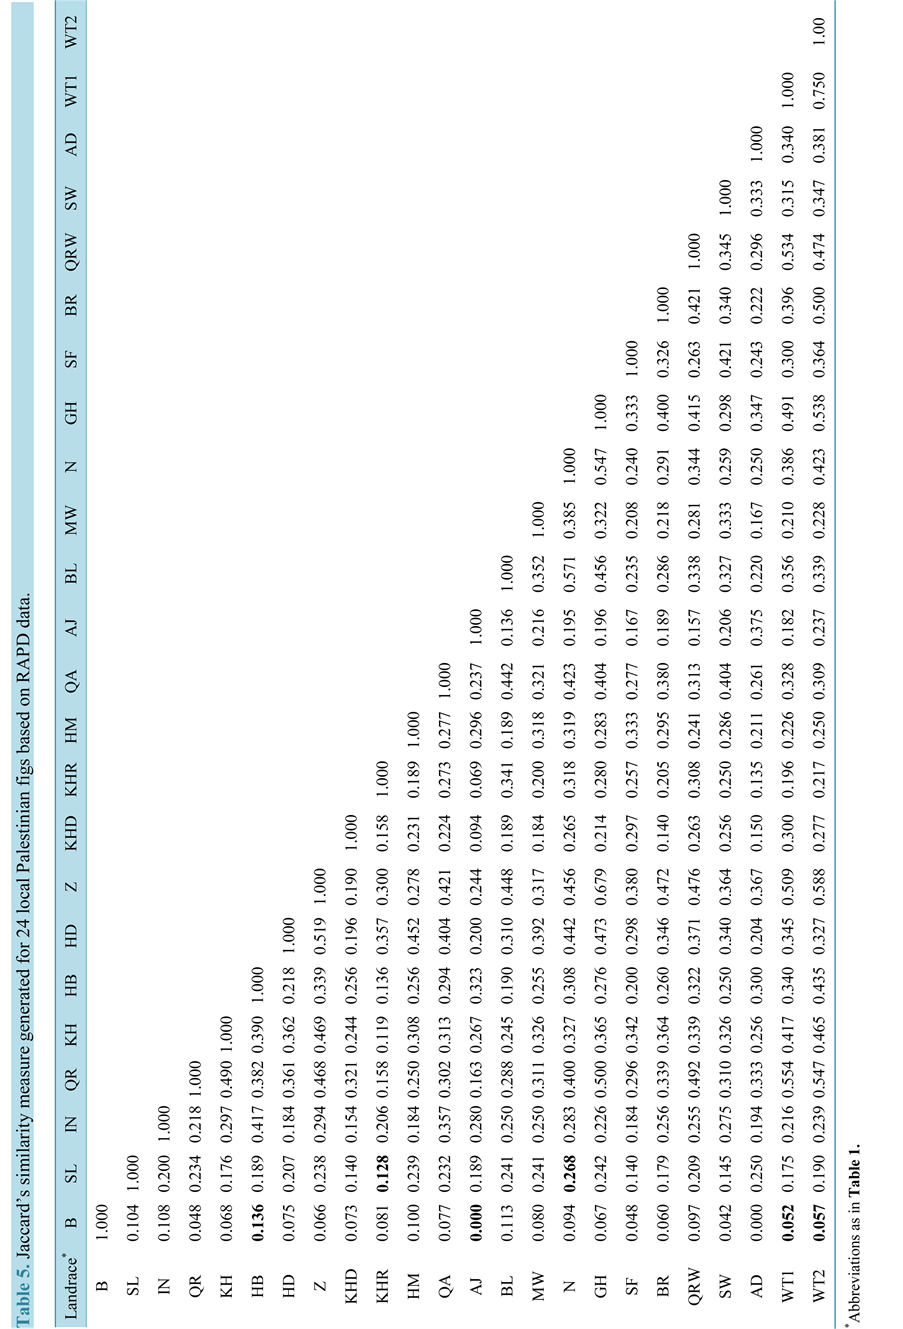
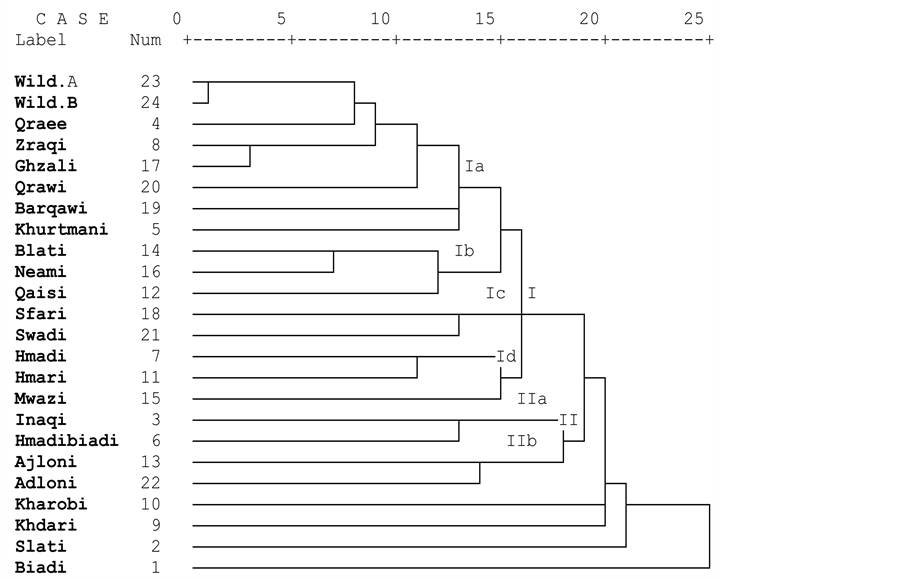
Figure 1. Dendrogram of 24 local Palestinian figs constructed by UPGMA based on RAPD binding patterns..
comprised a sister group of two cultivars with short fruit neck, green-purple external fruit color Hmadi and Hmari, and a separate branch containing Mwazi cultivar (with green-yellow skin color). The second cluster (II) was divided into two sister groups: the first is Hmadibiadi and Inaqi, and the second Ajloni and Adloni which also share all pomological traits.
Based on the genetic relationships among genotypes as illustrated by the dendrogram, the following genotypes Biadi, Kharobi, Khdari, Mwazi, Qaisi, Qraee, Qrawi, Slati, Barqawi and Khurtmani may be considered as distinct landraces. It is noteworthy that all these cultivars are suitable for drying. The remaining genotypes, including the two wild form accessions which clustered together are closely related accessions.
3.2. Pomological Descriptors
3.2.1. Dendrogram of Pomological Relationship (Similarity Matrix and Cluster Analysis)
The data matrix size analyzed was 1782 entries, 457 (25.65%) of which were for present character (1) and 1325 (74.35%) for absent character (0). Accordingly, the Jaccard’s coefficient was calculated and presented in Table 6. The genetic similarity matrix showed an average similarity range from 0.105 to 1.000 with a mean of 0.552. Thus, the cultivars tested in this study are characterized by large divergence at the morphological characteristics level. The maximum similarity values of 1.00 and 0.91 were registered between Ajloni and Adloni and between Hmadi and Hmari landraces, respectively, suggesting their close relatedness. Whereas, the lowest similarity value of 0.0105 (the highest dissimilarity of 0.895) was exhibited between Swadi and Khurtmani varieties. Among all tested cultivars, Swadi tends to show the lowest similarity values from the majority of the others.
Pomological analysis based on different characters showed high polymorphism with 22 fig cultivars. The dendrogram based on Jaccard’s similarity index clustered cultivars into three major clusters (I, II, III) (Figure 2). The first cluster (I) was divided into two groups (Ia,Ib) the first group (Ia) contains three cultivars: Adloni, Ajloni with Qrawi in a separate branch. Ajloni and Adloni shared similar pomological traits, e.g., fruit internal color, oblong pyriform shape, small weight, medium length, short width, closed ostiole, and others. They also exhibited 1.00 similarity values which indicate that they should be considered synonyms. The second group (Ib) consisted of three cultivars: Biadi, and Ghzali in a sister group, and Mwazi branching separately. The second


Figure 2. Dendrogram of 22 local Palestinian figs constructed by Jaccard’s based on pomological traits.
cluster (II) was also divided into two groups. The first group (IIa) was made up of four cultivars: Qraee, and Slati in a sister group, and Blati and Khurtmani branching separately. The second group (IIb) was composed of seven cultivars: three sister groups Hmari and Hmadi; Neami and Barqawi; and Hmadibiadi and Khdari; and Sfari branching separately. The third cluster (III) was composed of five cultivars: two sister groups (Inaqi and Qaisi, and Zraqi, and Swadi) with Kharobi branching separately.
3.3. Correlation between Genetic Matrices
The Mantel test (two-tailed test), comparing RAPD matrix with phenotypic parameters did not indicate a significant correlation within the diversity of local fig landraces. Positive, although not significant correlation, was found between the two kinds of matrices [r(AB) = 0.039, p (two-tailed) = 0.542, alpha = 0.05; the p-value has been calculated using the distribution of r(AB) estimated from 10000 permutations] (Figure 3). As the computed p-value is greater than the significance level alpha = 0.05, one cannot reject the null hypothesis H0 (The matrices are not correlated). The risk to reject the null hypothesis H0 while it is true is 54.17%. In fact, the clustering pattern obtained by phenotypic traits and RAPD markers showed somewhat close clustering in some fig landraces, but on the other hand also showed some disparity (in some fig landraces) [16] (Table 7).
3.4. Combined Pomological Traits and RAPD
The present study is the first attempt to characterize and detect similarities among fig accessions preserved in the Palestinian fig ex situ field genebank, using combined (pomological and RAPD) markers. The data matrix size analyzed was 4483 entries, 1358 (30.29%) of which were for present loci (1) and 3125 (69.70%) for absent loci (0). Accordingly, the Jaccard’s coefficient was calculated and presented in (Table 8). The genetic similarity matrix showed an average similarity range from 0.091 to 0.625 with a mean of 0.358. Thus, the maximum similarity values of 0.625 and 0.609 were registered between Hmari and Hmadi and between Ajloni and Adloni cultivars, respectively; suggesting low dissimilarities and their close relatedness. Whereas, the lowest similarity value of 0.091 (the highest dissimilarity of 0.909) was exhibited between Slati and Swadi. Among all tested cultivars, Slati tends to show the lowest similarity values from others.
The dendrogram based on Jaccard’s similarity index clustered cultivars into two major clusters (I, II) in addition to another six genotypes (Hmadibiadi, Sfari, Kharrobi, Khdari, Biadi, and Slati) that did not cluster and branched separately (Figure 4).

Figure 3. Product moment correlations (r) from the normalized Mantel statistics for comparisons of different proximity matrices using random amplified polymorphic DNA (RAPD) bands, and pomological traits from 22 fig genotypes
Table 7. Clustering patterns in the dendrograms of 22 local Palestinian figs constructed by UPGMA based on RAPD, pomological, and combined (RAPD and pomological) markers.
*Abbreviations as in Table 1.
The first cluster (I) was divided into two groups (Ia, Ib). Subgroup (Ia) was composed of nine genotypes (Hmadi, Hmari, Zraqi and Ghzali, Neami, Blat, Qaisi, Mwazi, Barqawi) of which Barqawi and Mwazi branched separately. Mwazi was the most divergent from the other cultivars in this group. Subgroup (Ib) was composed of three genotypes (Khurtmani, Qraee, Inaqi) of which Inaqi branched separately. The second cluster (II) was composed of four genotypes: Adloni, Ajloni, Qrawi, with Swadi branching separately.


Figure 4. Dendrogram of 22 local Palestinian figs constructed by UPGMA based on combined (RAPD and pomological) markers.
Based on the genetic relationships among genotypes as illustrated by the dendrogram, generated from pomological and RAPD data by UPGMA clustering method, the following 12 genotypes: Qaisi, Mwazi, Barqawi, Inaqi, Swadi, Kharobi, Hmadibiadi, Sfari, Khdari, Biadi, Qrawi, and Slati, may be considered as distinct cultivars. The remaining genotypes may be considered as synonymous (4 landraces) (Hmadi and Hmari, and Ajloni and Adloni), or closely related landraces (6 accessions) Zraqi and Ghzali, Blati and Neami, and Qraee and Khurtmani).
It is interesting to note that clustering patterns obtained from the combined (pomological and RAPD) data had higher discriminatory power to discriminate fig landraces (16/22, 72.7%) than using either pomological (7/22, 31.8%) or RAPD (8/22, 36.4%) markers alone. Fig landraces are common in Palestine and their denomination is complicated because of morphological similarity. The main problem comes from denominating landraces based on common phenotypic traits. Discriminating of homonymous and synonymous cases in fig has also been reported by Khadari et al. [12] , Papadopoulou et al. [16] and Basheer-salimia et al. [11] using RAPD markers or phenotypic markers [11] . In the current study, positive correlation was evidenced between morphological descriptors and RAPD markers. Thus, the combined analysis of (pomological and molecular markers) has shown to be a valuable tool for assessing the genetic diversity in figs.
4. Conclusion
Both pomological and RAPD markers are useful for elucidating in part denomination problems and relationships among fig cultivars. The limitations of the use of phenotypic-based genetic markers for assessing genetic variations in fig landraces can be minimized by the use of ex situ field fig genebanks where the trees are grown under the same environmental and edaphic conditions. However, the combined (pomological and RAPD) markers yield higher discriminatory power to discriminate fig landraces than using either pomological or RAPD markers alone. Wide phenotypic and molecular diversity found in the fig germplasm indicates a considerable potential for improving this crop.
Acknowledgements
This research was supported by a grant from the Biodiversity and Environmental Research Center, BERC.
NOTES
*Corresponding author.