Altitudinal Distribution of Papilionidae Butterflies along with Their Larval Food Plants in the East Himalayan Landscape of West Bengal, India ()
1. Introduction
Bacterial adaptations to environmental changes are, in part, dependent on inter-cell and inter-kingdom communication [1] [2] . Human hormones, e.g. insulin and dehydroepiandrosterone and neurotransmitters, e.g. norepinephrine have been reported to function as interkingdom communication signals [1] [3] -[7] . These chemical signals trigger alterations in population phenotype, including virulence-associated factors [8] . Identification of novel signaling compounds can lead to identification of new target pathways for antimicrobial development.
Various classes of compounds, including peptides and steroids have been identified as signaling compounds for Staphylococcus aureus [5] [9] -[11] . S. aureus is an important community-acquired and nosocomial pathogen that produces endogenous (vitamin K2) for respiration [12] -[16] . However, the role that extracellular menaquinone plays in bacterial physiology is not known. The potential effects of exogenous menaquinone on S. aureus is an important question since in vivo staphylococci are exposed to menaquinone, an essential factor for hemostasis in humans [14] [17] [18] .
The focus of this study is to determine if exogenous menaquinone, a vitamin, affects S. aureus virulenceassociated phenotypes, i.e., capsule production, biofilm formation and carotenoid production [19] .
2. Materials and Methods
2.1. Chemicals and Reagents
Menaquinone (K2; Sigma-Aldrich), was stored at −20˚C until use. Prior to use it was dissolved in dimethyl sulfoxide (DMSO) then diluted in medium. Because of its photo-reactivity, all experiments were done solely under yellow light (570 - 580 nm) to avoid photo-oxidation.
2.2. Bacterial Strains & Growth Kinetics
S. aureus strains used are indicated in Table 1. S. aureus parent strain 8325-4, and agr−, sarA− and agr−sarA− strains, which are highly characterized, were a generous gift from S. Foster. Bacterial growth rate and maximal growth were determined using a semi-automated system as previously described [20] . Briefly, overnight cultures of S. aureus strains in Mueller Hinton (MH) broth were added to fresh MH (104 and 106 CFU/ml final concentration). The bacterial suspension (100 µl) was added to serially diluted (two-fold) menaquinone in MH (100 µl/well; 0.001 - 12 μg/ml; flat-bottom honey-comb plates; Bioscreen C; Growth Curves USA). The plates were incubated in the Bioscreen C for 24 hrs (37˚C, continuous shaking). Generation times were calculated per formula (Bioscreen C). Controls consisted of organisms grown in medium alone and organisms grown in medium with the highest concentration of DMSO used (1 ml DMSO/dl MH). Experiments were done in quadruplicate and repeated at least twice for a total of three independent measures (n = 12).
2.3. Biofilm Assay & Capsule Production
Organisms (Table 1) grown overnight in MH were used to inoculate fresh homologous medium to 2 × 10⁴ and 2 × 10⁶ CFU/ml final concentration. Bacteria were added to microtiter plates (100 µl/well; 96 well untreated flat-bottom) containing two-fold serially diluted in MH of menaquinone (100 µl/well; 0.001 - 12 μg/ml). After incubation (24 hr, 37˚C, static, humid chamber) the plates were emptied, washed, and air dried. After drying, the plates were stained with 300 µl of commercially prepared Gram’s crystal violet (biofilm formation; Troy Biologicals), or with 300 µl of Alcian blue (1% w/v DDW) which stains acidic polysaccharide, e.g., capsule [20] -[22] . After the plates were thoroughly rinsed and dried, the stain was dissolved in absolute alcohol (300 µl).

Table 1. Staphylococcus aureus strains used in this study.
Absorbance was determined by spectrophotometer reading (Abs595 nm and Abs490 nm, respectively). Controls consisted of organisms grown in medium alone and organisms grown in medium with the highest concentration of DMSO used (1 ml DMSO/dl MH). For all strains tested, DMSO, at the highest concentration tested (1 ml DMSO/dl MH), had no measurable effect on biofilm levels as compared to the medium alone control. Experiments were done in quadruplicate and repeated at least twice (n = 12).
2.4. Biofilm Formation on Fibronectin
Biofilm formation on human fibronectin-coated 96-well microplates (1 μg fibronectin/well; R & D Systems) was done essentially as described above for plastic with the exception that in addition to the serially diluted menaquinone (0.05 - 12 μg/ml MH) menaquinone at 0.5 and 0.005 ng/ml MH were tested. For all strains tested, DMSO, at the highest concentration tested (1 ml DMSO/dl MH), had no measurable effect on biofilm formation on fibronectin as compared to the medium alone control. Experiments were done in triplicate and repeated at least twice (n = 9).
2.5. Carotenoid Formation
Measurement of carotenoid levels was done essentially as described by Morikawa, et al. [23] . Organisms were grown in MH as described above in the absence and presence of menaquinone (4 μg/ml, 0.5 μg/ml, 0.05 μg/ml). After 24 hrs, the cells were harvested from 850 μl of culture and washed (H2O, 25˚C, 3578 xg, 3 min.). The cell pellets were suspended in methanol (200 μl; Sigma-Aldrich), heated, (55˚C, 3 min.) and centrifuged (3578 xg, 3 min.). The supernatant was removed, the cell pellet re-extracted (200 µl methanol, 55˚C, 3 min) and centrifuged (3578 xg, 3 min.). This supernatant was added to the previous supernatant and the cell pellet discarded. To the 400 μl of cell extract, 600 µl of methanol was added to a total of 1 ml with absorbance read at 465 nm. Controls consisted of organisms grown in medium alone and organisms grown in medium with the highest concentration of DMSO used (1 ml DMSO/ dl MH). Methanol was used as the blank for spectrophotometry. In addition, the effect of various concentrations of menaquinone on colony appearance was assessed by visual inspection using the standard spread plate method (MH agar with menaquinone). Experiments were done in triplicate and repeated at least twice (n = 9).
2.6. Statistical Analysis
Data were evaluated by analysis of variance (ANOVA; GraphPad InStat 3.06 for Windows, GraphPad Software Inc.). Mean values were considered significantly different at p < 0.05.
3. Results
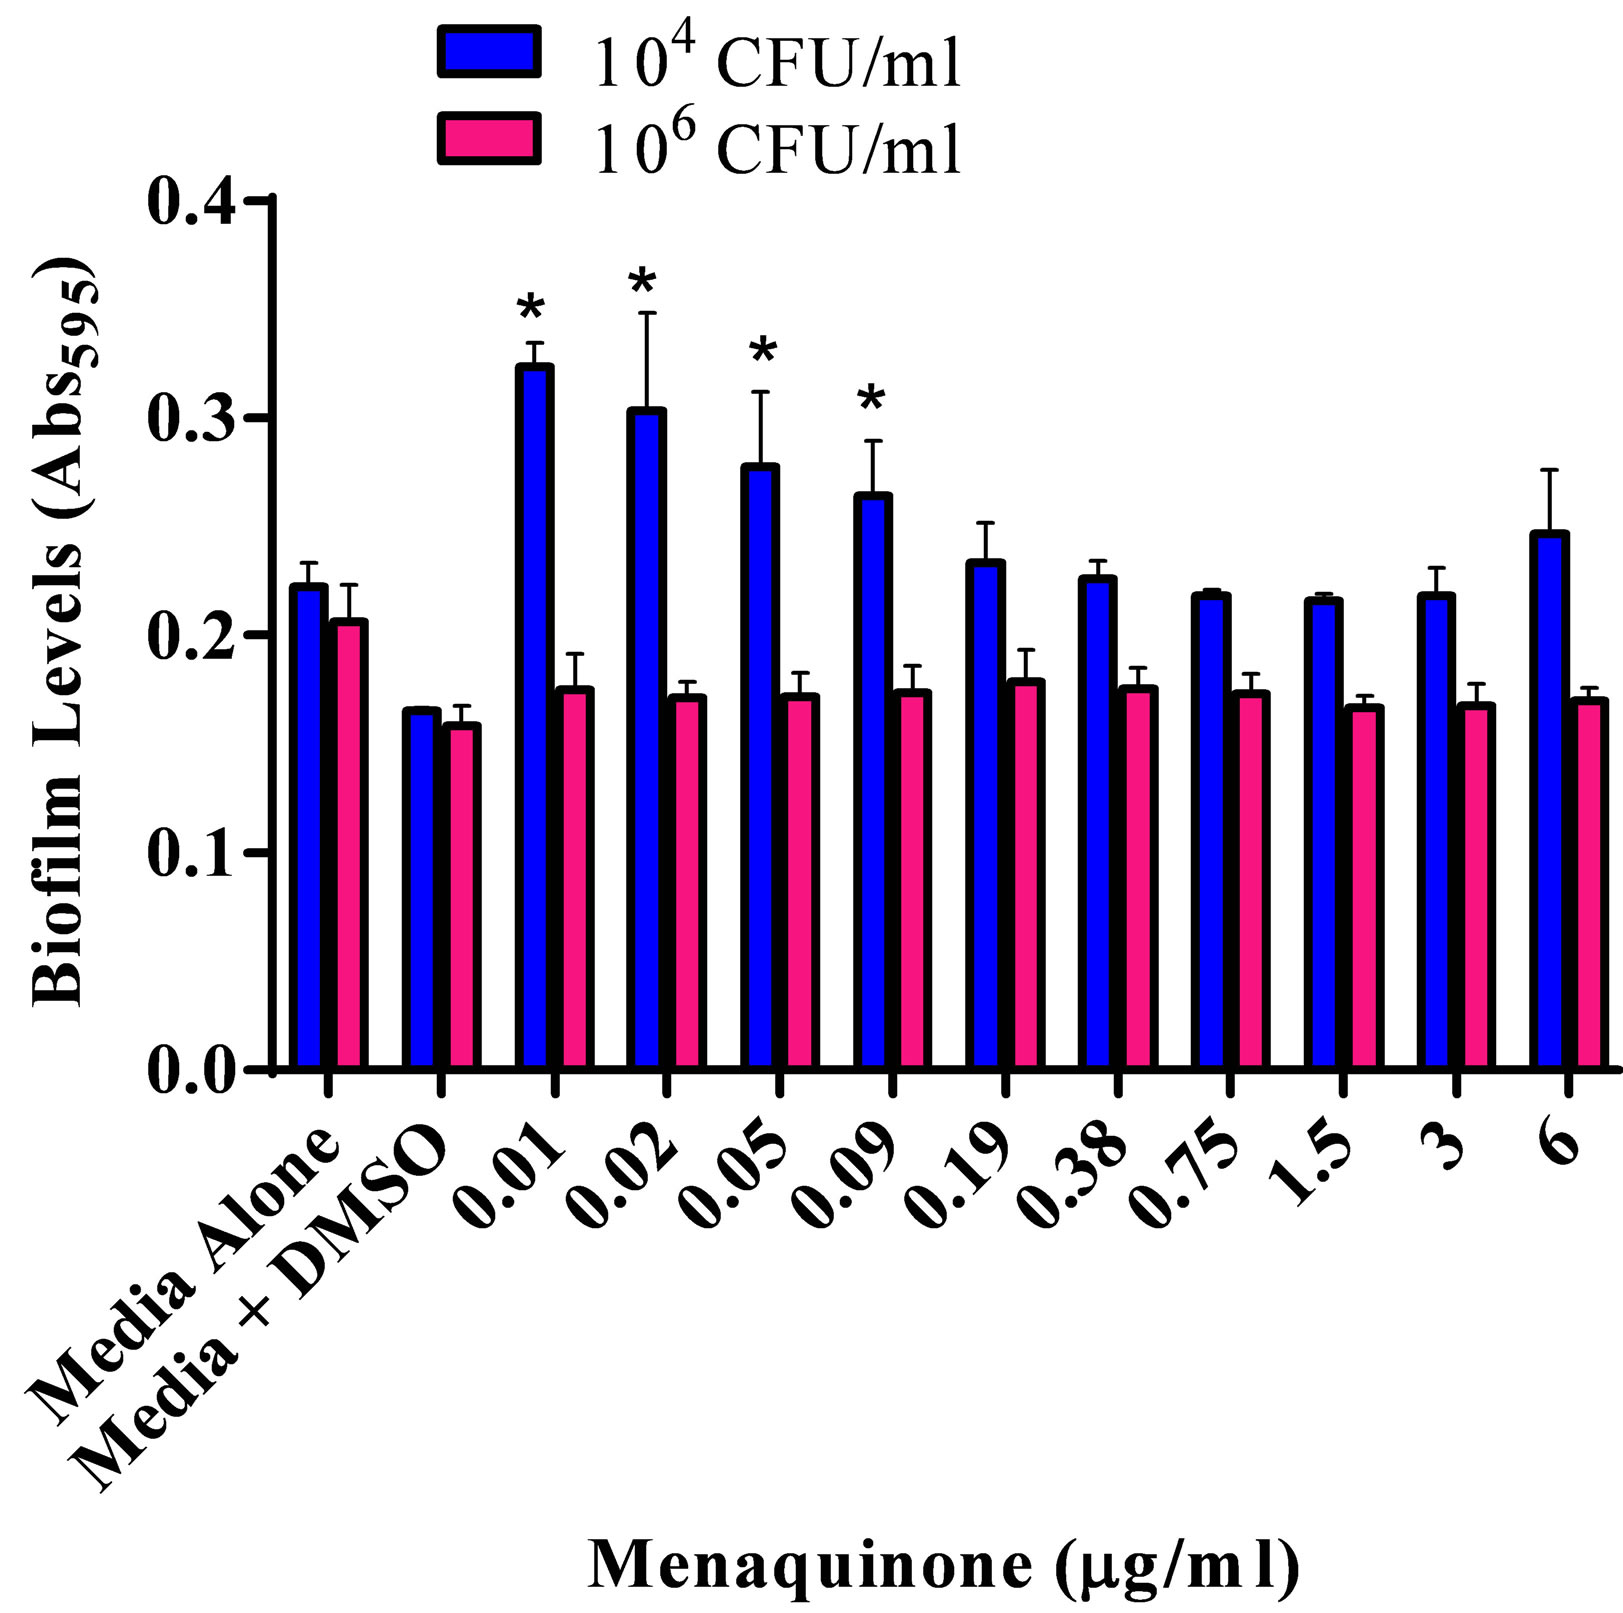
The effect of various menaquinone concentrations on S. aureus ATCC 25923 biofilm formation and production of capsular polysaccharide was assessed (Figures 1(a) and (b)). Menaquinone (0.01 - 0.09 µg/ml) caused a significant (p < 0.05) concentration specific increase in the level of S. aureus biofilm formation on plastic, which was also dependent upon bacterial density (Figure 1(a)). Biofilm formation on plastic was significantly increased at the lowest bacterial density tested (104 CFU/ml). As had been previously reported for S. aureus ATCC 25923, menaquinone, regardless of concentration, had no significant effect on doubling time and maximum absorbance for any of the strains tested (Table 1; data not shown) [20] . Thus, the effect menaquinone had on biofilm formation was independent of growth rate or final bacterial density. In addition, menaquinone had no significant effect on capsule production regardless of strain or initial concentration tested (Figure 1(b)).
The effective response range for menaquinone was 0.05 - 4 µg/ml (Figure 2), with biofilm formation on fibronectin significantly increased (p < 0.05) for wild type and clinical isolates (MSSA and MRSA), as compared to parent and agr− mutant strains. In contrast, biofilm formation on fibronectin of S. aureus agr−-sarA− and sarA− strains was similar to controls, regardless of the menaquinone concentration tested. No response was seen at menaquinone concentrations of 5 ng/ml or 12 µg/ml (data not shown). Menaquinone concentrations yielding the highest levels of fibronectin-associated biofilm formation as compared to control are shown in Table 2. The highest levels of biofilm formation were measured for the clinical MSSA (M48155) and MRSA (S38506) isolates, whose biofilm levels were 4.3 and 6.1 fold higher than vitamin K-free control, respectively.
The effect of menaquinone (0.005, 0.05, 0.5 and 4 μg/ml) on carotenoid production by each of the strains
 (a)
(a) (b)
(b)
Figure 1. Effect of menaquinone (0.01 - 6 μg/ml) on S. aureus ATCC 25923 populations. (a) Biofilm formation on plastic. Biofilm formation on plastic by two populations (104 CFU/ml; 106 CFU/ml) of S. aureus. Organism biofilm formation after growth (24 hrs. 37˚C, static) in Mueller Hinton medium (pH 7) at various levels of menaquinone was evaluated spectrophotometrically (Abs595 nm). (b) Capsule formation. Production of acidic polysaccharide by two populations (104 CFU/ml; 106 CFU/ml) of S. aureus. Capsule production after growth (24 hrs. 37˚C) in Mueller Hinton medium (pH 7) at various levels of menaquinone was evaluated spectrophotometrically (Abs490 nm). Each bar (mean ± SEM) represents three independent measures performed in quadruplicate (n = 12). *Indicates significant difference (p < 0.05) between biofilm levels in the presence of menaquinone and medium control.

Figure 2. Effect of menaquinone (0.05 - 4.0 µg/ml) on formation of biofilm by S. aureus strains on fibronectin. Menaquinone was evaluated for its ability to affect S. aureus biofilm formation on fibronectin (1 μg/well) as determined spectrophotometrically (Abs595 nm). Each bar (mean ± SEM) represents three independent measures performed in triplicate (n = 9). *Indicates significant difference (p < 0.05) from medium control.
Table 2. Effect of menaquinone on S. aureus biofilm formation on fibronectin.
aMenaquinone concentration at peak biofilm levels; bMean ± SEM; three independent measures (n = 9); cMaximum Abs595 of S. aureus in the presence of menaquinone/Abs595 of S. aureus medium control; dSignificantly different (p < 0.05) from medium control.
(Table 1) was assessed both visually (colony color) and through direct cell extraction methodology. Regardless of the method used, menaquinone did not appear to affect the level of carotenoid formation (Abs465nm 0.03 ± 0.006).
4. Discussion
The present study is the first report of a vitamin affecting phenotype expression. Menaquinone’s effect on S. aureus was concentration specific in a manner analogous to what has been described for other inter-kingdom quorum signaling compounds [7] [9] . The ability to recognize the host environment and alter phenotype expression so as to establish an infectious process is controlled through recognition of a variety of environmental conditions, including the presence of chemical signaling compounds [1] [8] . Similar to other host-derived exogenous chemical signaling molecules, menaquinone’s effects on biofilm formation on plastic (measure of surface hydrophobicity; alteration in S. aureus cell surface architecture) were population size dependent [2] [20] . Since there was no significant difference in total growth, regardless of menaquinone concentration, the differences in biofilm levels were the result of menaquinone-induced cell surface changes, and not differences in total growth levels. Similar to previous reports on biofilm formation in S. aureus, menaquinone-mediated biofilm formation on plastic appears to be independent of either the presence of capsule, or changes in carotenoid production. The menaquinone concentrations affecting S. aureus biofilm formation on fibronectin spanned a broad range with the break-point for S. aureus response determined to be between 0.5 ng/ml and 0.005 ng/ml (data not shown). In normal human plasma the levels of exogenous vitamin K range from 0.1 - 2.2 ng/ml plasma, with plasma levels ≤0.5 ng/ml corresponding to impaired blood coagulation [23] [24] . Thus, the effects of menaquinone on biofilm formation may have clinical relevancy since in individuals with normal clotting function S. aureus would be exposed to levels of vitamin K that are sufficient to enhance biofilm formation in vitro. We hypothesize that plasma vitamin K levels would promote in vivo biofilm formation on fibronectin-coated surfaces, e.g. prosthetic joints. In addition, the staphylococcal response to such a broad vitamin concentration range may play a role in staphylococcal survival during abscess formation and persistence, since concentrated menaquinone levels would be expected in the encapsulated environment of an abscess [12] [15] .
As anticipated, the global gene regulator sarA regulates biofilm formation in response to menaquinone [25] . Of interest is the observation that the level of S. aureus agr− cells binding to fibronectin was significantly increased as compared to its parent strain. This suggests that agr plays a negative regulatory role in S. aureus response to menaquinone.
5. Conclusion
The vitamin menaquinone, at human plasma levels, exhibits characteristics analogous to interkingdom quorum-like signaling compounds. Vitamin K enhances capsule-independent biofilm formation on both plastic surfaces and fibronectin. The response to exogenous vitamin K signaling appears to be under sarA regulation. This vitamin K-mediated pathway in biofilm formation may provide an additional target for development of targeted antimicrobials [22] .
Acknowledgements
This project was supported by Midwestern University Office of Research and Sponsored Programs, Midwestern University Biomedical Sciences Program and the American Osteopathic Association (D. Kirby).