Quantitative trait loci associated to agronomic traits and yield components in a Sorghum bicolor L. Moench RIL population cultivated under pre-flowering drought and well-watered conditions ()
1. INTRODUCTION
Drought stress is a condition of precipitation scarcity over an extended period of time that leads to a water shortage for plants. It is the most important reason for yield reduction in crops [1]. Sorghum is classified as one of the most important food and feed crops in arid and semi-arid regions of the world because of its unique response to drought [2]. It is also an excellent model species for evaluating drought response mechanisms [3]. Although sorghum is relatively tolerant to pre-flowering and post-flowering drought, both stages may lead to significant yield losses or crop failure. Pre-flowering drought is most harmful at panicle differentiation since panicle size may be directly affected, which later reduces grain number and grain yield [4]. However, plants are most sensitive to drought at flowering for the same reasons. Post-flowering drought is expressed when moisture stress occurs during grain development. During this period, there is a fast premature leaf death that often leads to charcoal rot, stalk lodging and yield losses [5].
Research for improving sorghum drought tolerance mainly focuses on post-flowering traits. In the USA, most of the commercial sorghum hybrids grown under non-irrigated conditions were considered to have considerable pre-flowering drought resistance but no significant post-flowering drought resistance [6]. Premature senescence leads to substantial yield losses under drought stress and stay-green, the ability to maintain green leaf area in conditions of limited soil water availability, contributes largely to post-flowering drought resistance in sorghum [7]. Breeding for drought resistance generally depends on the intensity of drought. Under a steady harsh environment, there may be a need to lower yield potential for maximizing drought tolerance which can ensure the survival of the crop. However, if the drought is mild and lasts for a short duration it could be more beneficial to select genotypes that are potentially high yielding and carry the basic properties of drought resistance [8]. Identification of genetic factors responsible for drought tolerance in plants will help to breed crops with improved drought tolerance [9].
DNA markers have been used for identifying genomic regions influencing quantitative traits in crop plants. QTL associated with post-flowering drought resistance have been identified in sorghum using restricted fragment length polymorphism (RFLP) markers [3,6,10-14] and random amplified polymorphic DNA (RAPD) markers [10,13]. EST-derived microsatellite markers, which may improve marker-assisted selection possibilities, were developed [15] and drought stress EST-derived microsatellite loci were mapped by [16]. DArT markers, which were used in the present study, are array based and analyses can be carried out on a minimal DNA sample requirement without prior DNA sequence information. DArTs have been successfully employed in genome mapping and diversity analysis of rice [17], barley [18] and sorghum [19]. DArT provides high-quality markers that can be used in diversity analysis and in the construction of medium density genetic linkage maps [19]. Genetic linkage maps are essential for the detection of quantitative trait loci (QTLs) underlying complex quantitative traits like yield or abiotic stress response mechanisms. The introduction of DNA markers as a useful tool to identify genomic loci, which are responsible for drought and other abiotic stress resistances in plants, increase the efforts of plant breeding programs.
Due to the fact that sorghum, in comparison to other crops, is less susceptible to drought per se and a single trait like stay-green could largely improve yields under unfavorable conditions, relevant improvement of traits influencing growth prior to anthesis has been widely neglected in the last decades. However, the first QTL studies on pre-flowering drought tolerance were done by [4]. Kebede et al. (2001) [3] identified four major QTL for pre-flowering drought on linkage groups C, E, F and G in a mapping population derived from a cross between the lines SC56 × Tx7000. The present study was carried out with the aim of gaining more information about preflowering drought resistance in sorghum. The study focuses on the identification of QTL regions for traits related to the response of agronomic performance and yield formation.
2. MATERIALS AND METHODS
2.1. Plant Material
The plant material consists of 100 RILs and was developed at the Grain Crops Institute, Potchefstroom, South Africa, from a cross between a high-yielding parental line (IS2449) and a breeding line described to be pre-flowering drought tolerant (IS1488). IS1488 shows less wilting and leaf rolling under drought stress. Both parental lines are single stemmed, have short internodes, are approximately 120 cm tall, early flowering and highly tolerant to pests and diseases. RILs used in the present study were advanced to F5.
2.2. Experimental Design and Phenotypic Evaluation
The experiment was carried out using 100 RILs and the two parental lines. The experimental design was a split plot design with two replications. Each replication had two treatments, including well-watered and drought stress conditions. The experimental units were one-row plots with a length of 5 m and 20 cm sowing distances within rows. Distances between rows were 75 cm (66,666 plants∙ha−1). Initially, two seeds were sown per hole at 2 cm depth. Thinning to single plants was done one week after emergence. Plants were irrigated twice a week during the early growth stage to promote good growth and development. Irrigation was withheld from the drought stress treatment four weeks after sowing, when most plants were in the eight-leaf stage. Plants were irrigated again when 50% of the RILs showed severe stress symptoms like strong leaf rolling. The wellwatered samples were irrigated until harvest. Measurements were carried out on six plants from the middle of each row.
The experiment was conducted from November 2011 to February 2012 (dry season) at a field research station of Nong Lam University, Ho Chi Minh City, Vietnam (10˚51'N, 106˚45'E, and 6 m above sea level, soil type: sandy, soil pH = 5.4), under standard cultivation practices. Basal fertilizers were applied at the rate of 80 kg N ha−1, 40 kg P2O5 ha−1, 40 kg K2O ha−1. Herbicides (Atrazine and Alachlor) were applied before emergence using a mixture of 1.5 kg Atrazine and 1.0 kg Alachlor per ha. Stem borers and leaf feeding insects were controlled by applying Vibasu 10 H at the six-leaf stage and Regent 5SC at a later development stage.
Ten traits were measured in the present study: leaf area of leaf 3 (LA3, cm2) counted from the flag leaf (LA3 was estimated as leaf length × leaf width × 0.70); plant height (PHE, cm) measured from the ground to the panicle tip two weeks after flowering; stem diameter (SDI, cm) measured 20 cm above ground two weeks after flowering; panicle initiation was counted as the number of days from sowing to heading (PIN); panicle length (PLE, cm) measured from the base of the panicle to the tip; days to anthesis (DAN), defined as the number of days from sowing until 50% of plants in the plot were shedding pollen; days to maturity (DMA); number of seeds per panicle (NSE), estimated by multiplying the number of spikelets per panicle with the number of kernels per spikelet (the number of seeds per spikelet was counted on three spikelets from the top, middle and bottom of a panicle); hundred-kernel weight (KHW, g), defined as the weight of 100 seeds at moisture content of 12%; and grain yield (GYL, kg∙ha−1), at a standard moisture content of 12%.
2.3. Data Analysis
Analysis of variance was carried out using the software package SAS 9.2 [20]. Proc GLM was used to evaluate the differences among treatments, the lines in each treatment and line x treatment interactions. Correlation coefficients were estimated among all traits in all treatments using Proc CORR.
Variance components were estimated for each trait using Proc VARCAMP. Each treatment (well-watered and drought stress) was considered as an environment. Broadsense heritability (h2) of each trait was calculated according to [21]:
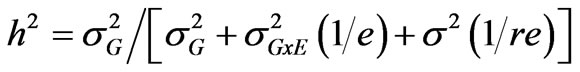 where
where  is the genotypic variance,
  is the genotype x environment interaction variance, σ2 is the error variance, e is the number of environments and r is the number of replications.
2.4. Genotyping
DNA of parental lines and F5 RILs from seedling leaf tissues were extracted at the Institute of Plant Genetics, Leibniz Universtät, Hannover, using the cetyltrimethylammonium bromide (CTAB) method [22]. Genotyping was carried out at Diversity Arrays Technology Pty. Ltd. (DArT), Yarralumla, Australia. 117 polymorphic DArT markers covering the genome were selected for fingerprinting. In addition to that, eight EST-SSR markers were used. EST-SSR marker analysis was conducted at the Institute of Plant Genetics, Leibniz. The map was constructed using the maximum likelihood method of JoinMap 4 [23]. The map consists of seventeen linkage groups in which chromosomes SBI-01, SBI-02, SBI-03, SBI-04 and SBI-09 were split into two parts and chromosome SBI-05 was split into three parts. The map length is 1183.3 centiMorgans (cM) (Figure 1) with an average marker distance of 9.5 cM. Approximately 82% of the intervals between adjacent markers were smaller than 20 cM and 18% were in the range from 20 to 32.3 cM. One large gap (>25 cM) each was found on chromosomes SBI-01, SBI-03, SBI-05a, SBI-07 and SBI- 09a.
2.5. QTL Analysis
Based on genotypic and phenotypic data, QTL analysis was carried out with PLABQTL 1.2 [24] using the composite interval mapping (CIM) method [25] by multiple regression with cofactors [26]. A liberal threshold LOD score of 2.5 was used for claiming the presence of a QTL in order to minimize the number of undetected QTL.
3. RESULTS
3.1. Phenotypic Traits
The phenotypic performance of RILs and their parents is presented in Table 1. In the RIL population, there was a wide range of variation for all traits. Averages across RILs were almost always between parental line values. ANOVA revealed highly significant differences between RILs for every trait. Differences between treatments were statistically significant for most of the analyzed traits, except LA3 and SDI. Frequency distribution of some phenotypic values of the RIL population is presented in Figure 2. Broad-sense heritability values ranged from 0.37 to 0.96. LA3 showed the lowest and PHE had the highest heritability (Table 1).
Correlation coefficients(r) between traits are presented in Table 2. All the traits had positive correlations between well-watered and drought stress conditions at p < 0.01. The strongest correlation was found for PHE (r = 0.93). Significant positive correlations were observed among SDI, PIN, DAN, NSE, DMA and GYL. The strongest correlation was observed between PIN and DAN with r = 0.98 under drought stress (cd) and r = 0.97 under well-watered (ww) conditions. Correlation coefficients between DAN and DMA were 0.89 (cd) and 0.83 (ww). Grain yield is the most important trait for farmers. Grain yield was positively correlated to most of the traits, but PHE was negatively correlated to GYL (ww). Correlations between grain yield and HKW were surprisingly not significant. In both environments GYL had the strongest correlation with NSE. Correlation coefficients were 0.70 (cd) and 0.72 (ww). The high correlations suggest that grain yield of these RILs was due to the number of seeds produced per panicle rather than to seed weight.
3.2. QTL Detection
The results of QTL detection are shown in Table 3 and Figure 1. A total of 50 putative QTL were detected on ten traits on all chromosomes except SBI-09. Six promising genome regions with seven QTL for yield and agronomic traits detected especially in the pre-flowering drought stress treatment were identified on chromosomes SBI-01, SBI-03, SBI-04, SBI-05 and SBI-07. QTL for DMA (cd), DAN (cd), DAN (ww), PIN (cd), PIN (ww),
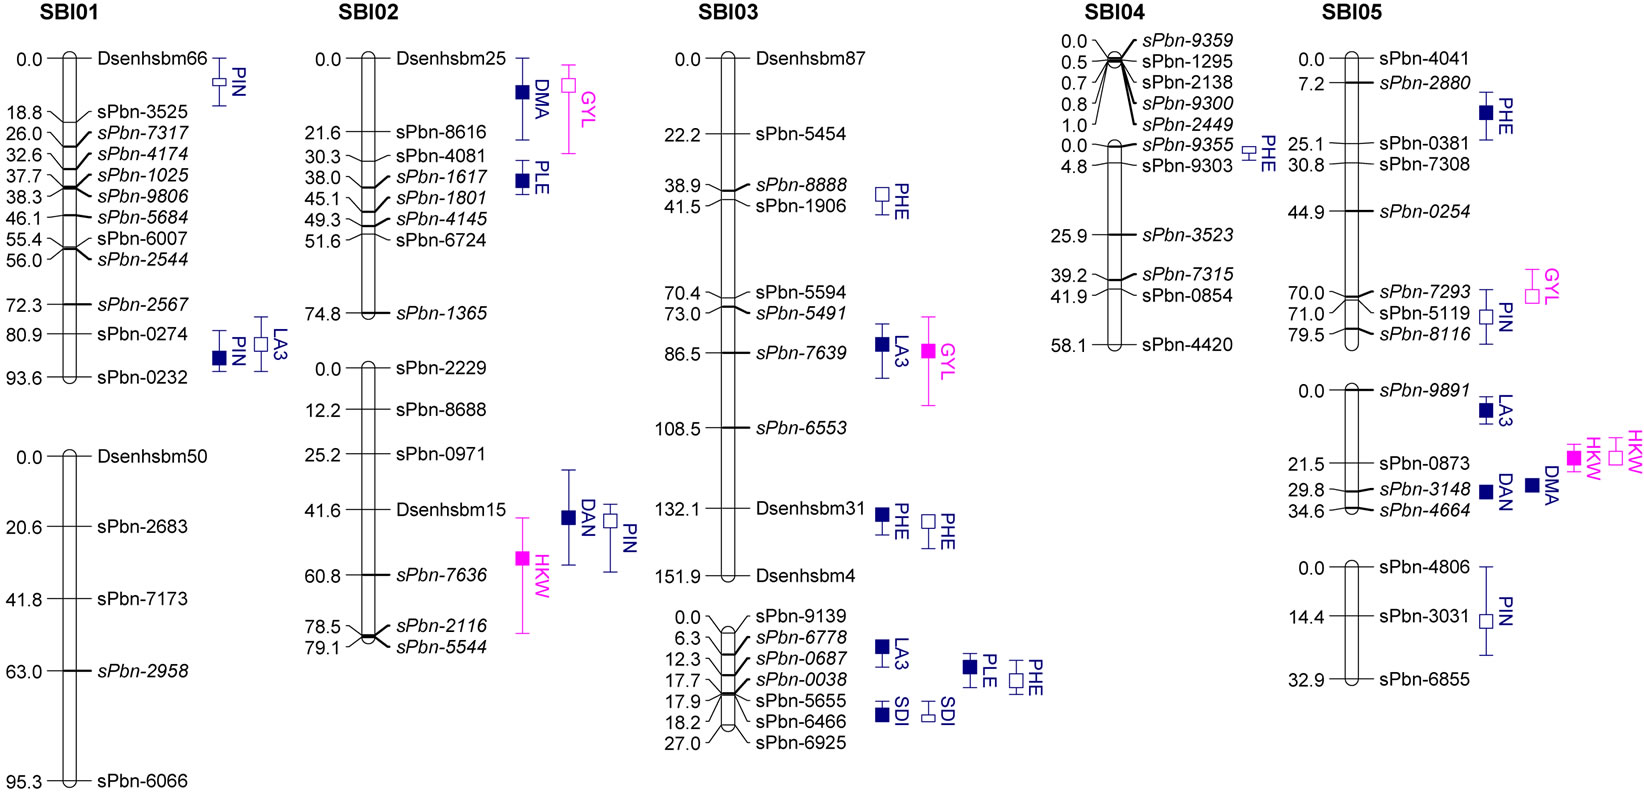
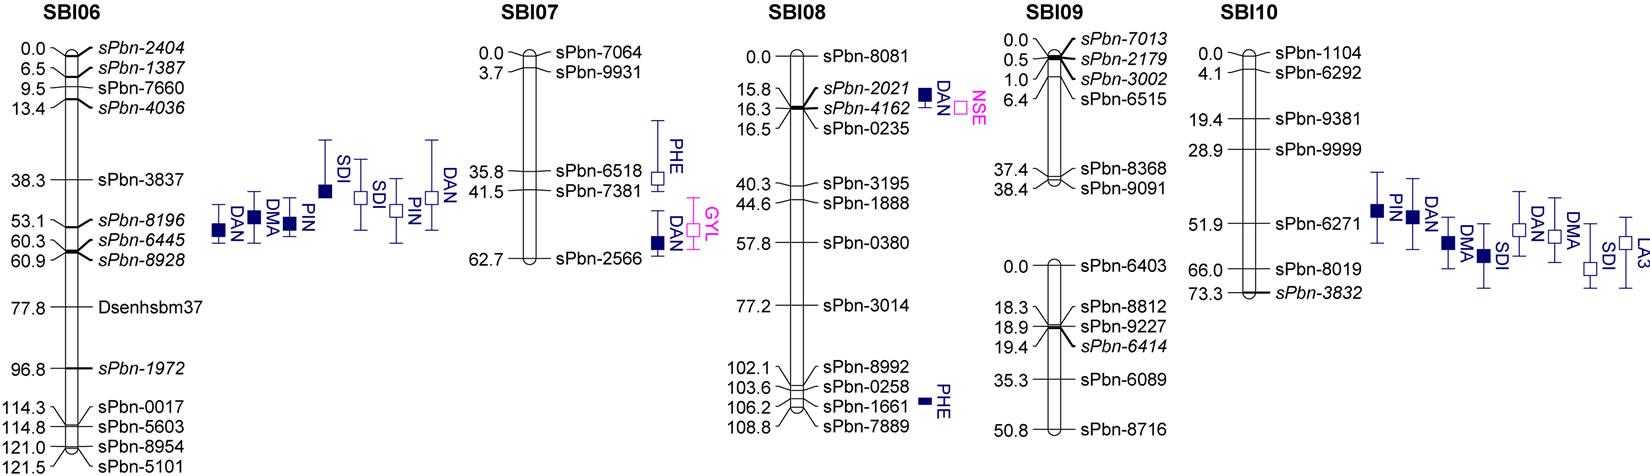
Figure 1. Genetic linkage map and significant additive QTL for agronomic traits and yield components of 100 RILs and their parents grown in the field.
Trait under ww conditions (filled boxes) and cd condition (open boxes). QTL are claimed to be significant at LOD > 2.5. Boxes show LOD peaks ± 2 cM.
SDI (cd) and SDI (ww) were clustering on SBI-06 between the markers sPbn-4036 and sPbn-6445. QTL for DMA (cd), DMA (ww), DAN (cd), DAN (ww), PIN (ww), SDI (cd), SDI (ww) and LA3 (cd) were clustering on SBI-10 between the markers sPbn-9999 and sPbn- 3832.
3.2.1. Leaf Area Leaf Third from the Top
Five QTL were detected for LA3. Two of them were for LA3 (ww) on SBI-03, one for LA3 (ww) on SBI-05 and one each for LA3 (cd) on SBI-01 and SBI-10. The phenotypic variation explained by each QTL ranged from 11.8% to 33.6%. The additive effect of the detected QTL showed that both parents contributed positive alleles for the development of LA3 in well-watered conditions, but only the alleles from IS1488 positively affected LA3 under drought stress conditions.
3.2.2. Plant Height
Eight QTL were identified for PHE in the RIL population (LOD score ≥ 2.76). There were three QTL detected for PHE (ww) and four QTL detected for PHE (cd). The QTL were distributed on five linkage groups with four QTL on SBI-03 and one each on SBI-04, SBI-05, SBI-07 and SBI-08. The phenotypic variation explained by each QTL ranged from 12.8% to 36.5%. The additive effect ranged from −6.9 to −4.9 cM for IS1488 and from 5.3 to 12.0 for IS2449 parent.
3.2.3. Stem Diameter
Six QTL were distributed over three linkage groups. There were three QTL for SDI (ww) and another three QTL for SDI (cd). The QTL were detected on SBI-03, SBI-06 and SBI-10 and appeared at identical positions under well-watered and drought stress conditions. The phenotypic variation explained by each QTL ranged from 11.9% to 36.9% and LOD score ranged from 2.55 to 9.41. The IS1488 allele had the effect on SDI for all QTL in both environments.
3.2.4. Heading Date
A total of eight QTL were detected for PIN, including
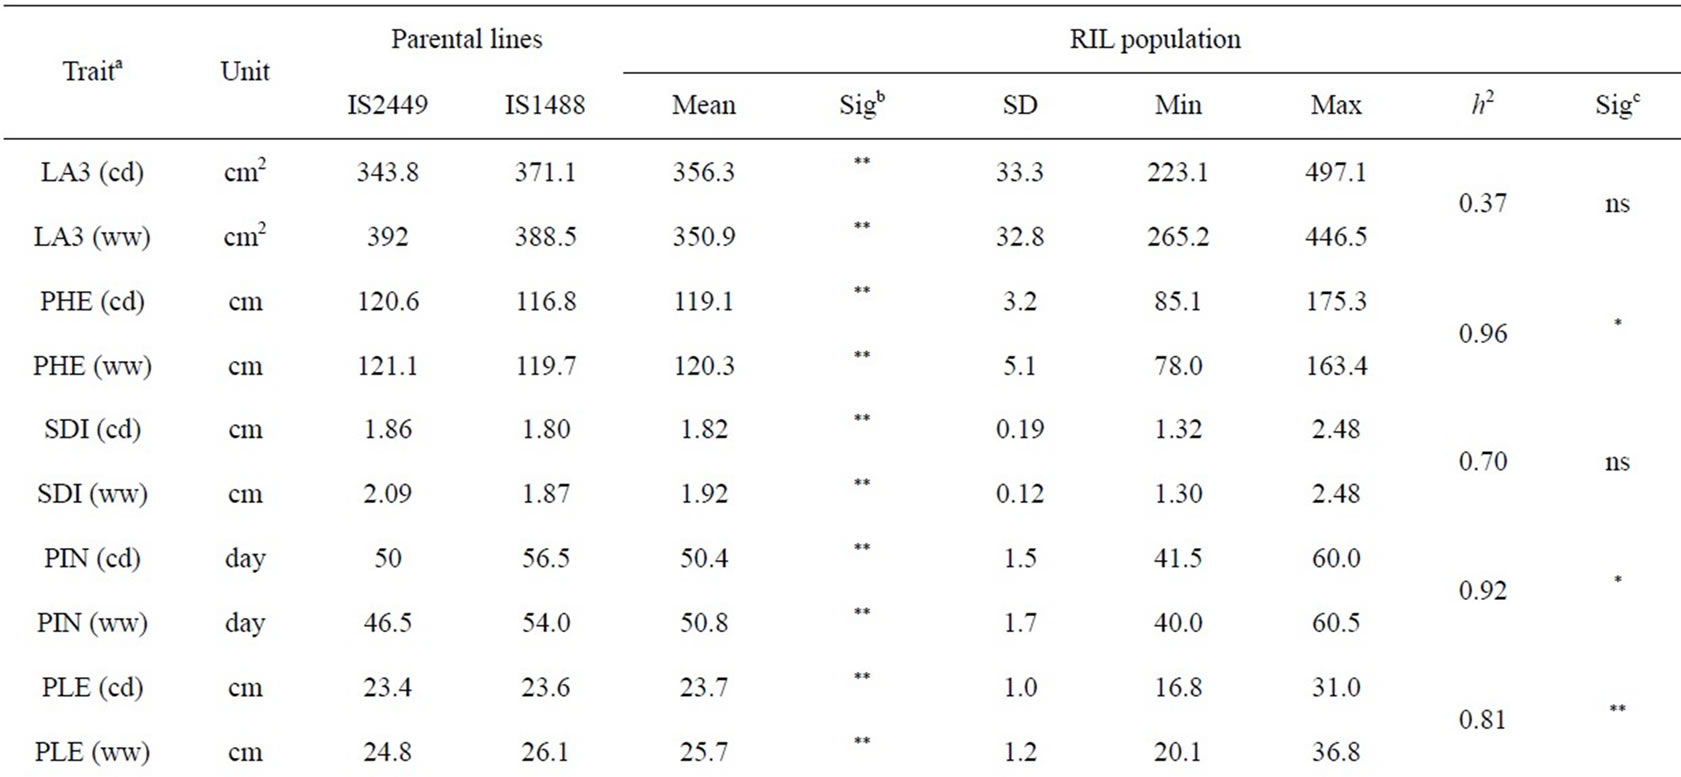
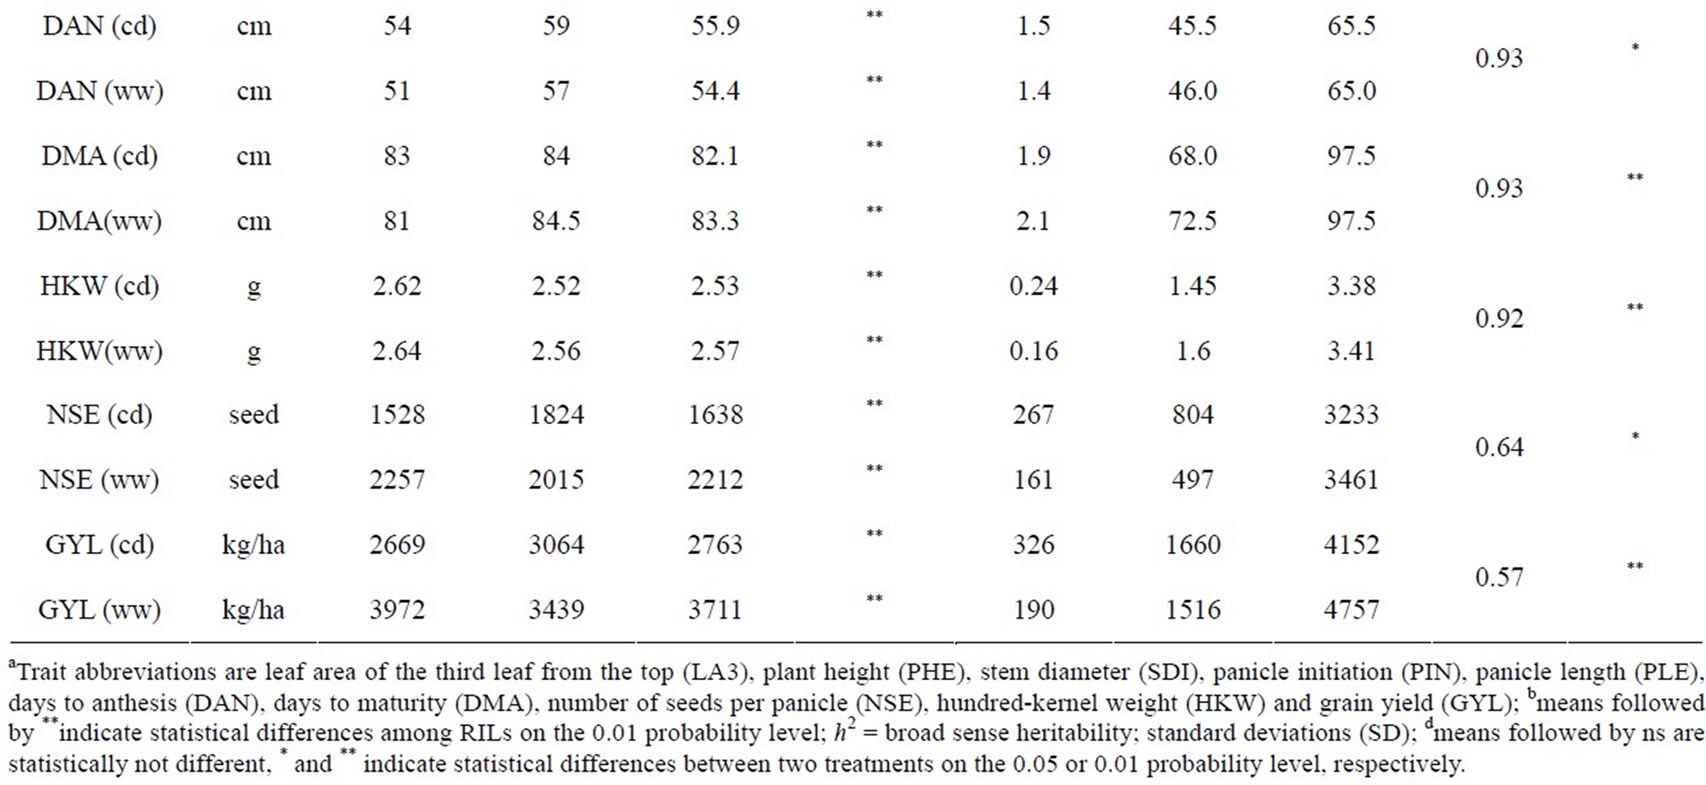
Table 1. Descriptive statistics and analysis of variance for 10 traits under well-watered (ww) conditions and continuously drying soil (cd) in the field.
three QTL for PIN (ww) and five QTL for PIN (cd). There were two QTL on SBI-01, one QTL on SBI-02, two QTL on SBI-05, two QTL on SBI-06 and one QTL on SBI-10. The phenotypic variation explained by each QTL ranged from 13.0% to 27.3% and the LOD score ranged from 2.75 to 6.08. Positive additive effects came from alleles of both parental lines.
3.2.5. Panicle Length
Two QTL for PLE (ww) were identified on the two chromosomes SBI-02 and SBI-03. The phenotypic variation explained by QTL on SBI-02 and SBI-03 was 22.5% and 13.6%, respectively. There was no QTL for PLE (cd). The IS2449 allele contributed positively to PLE at the QTL on SBI-02, whereas the IS1488 allele contributed positively to the trait at the QTL on SBI-03.
3.2.6. Days to Anthesis
Eight QTL were detected for DAN in the RIL population and were distributed on six chromosomes with two QTL each on SBI-06 and SBI-10 and one QTL each on SBI-02, SBI-05, SBI-07 and SBI-08. Only two QTL were detected for DAN (cd); all other QTL were detected for DAN (ww). The phenotypic variation explained by each QTL ranged from 12.2% to 29.3% and the LOD score ranged from 3.12 to 7.15. The positive alleles for DAN were mainly inherited from IS1488 in both cultivated conditions. The IS2449 allele had a positive effect
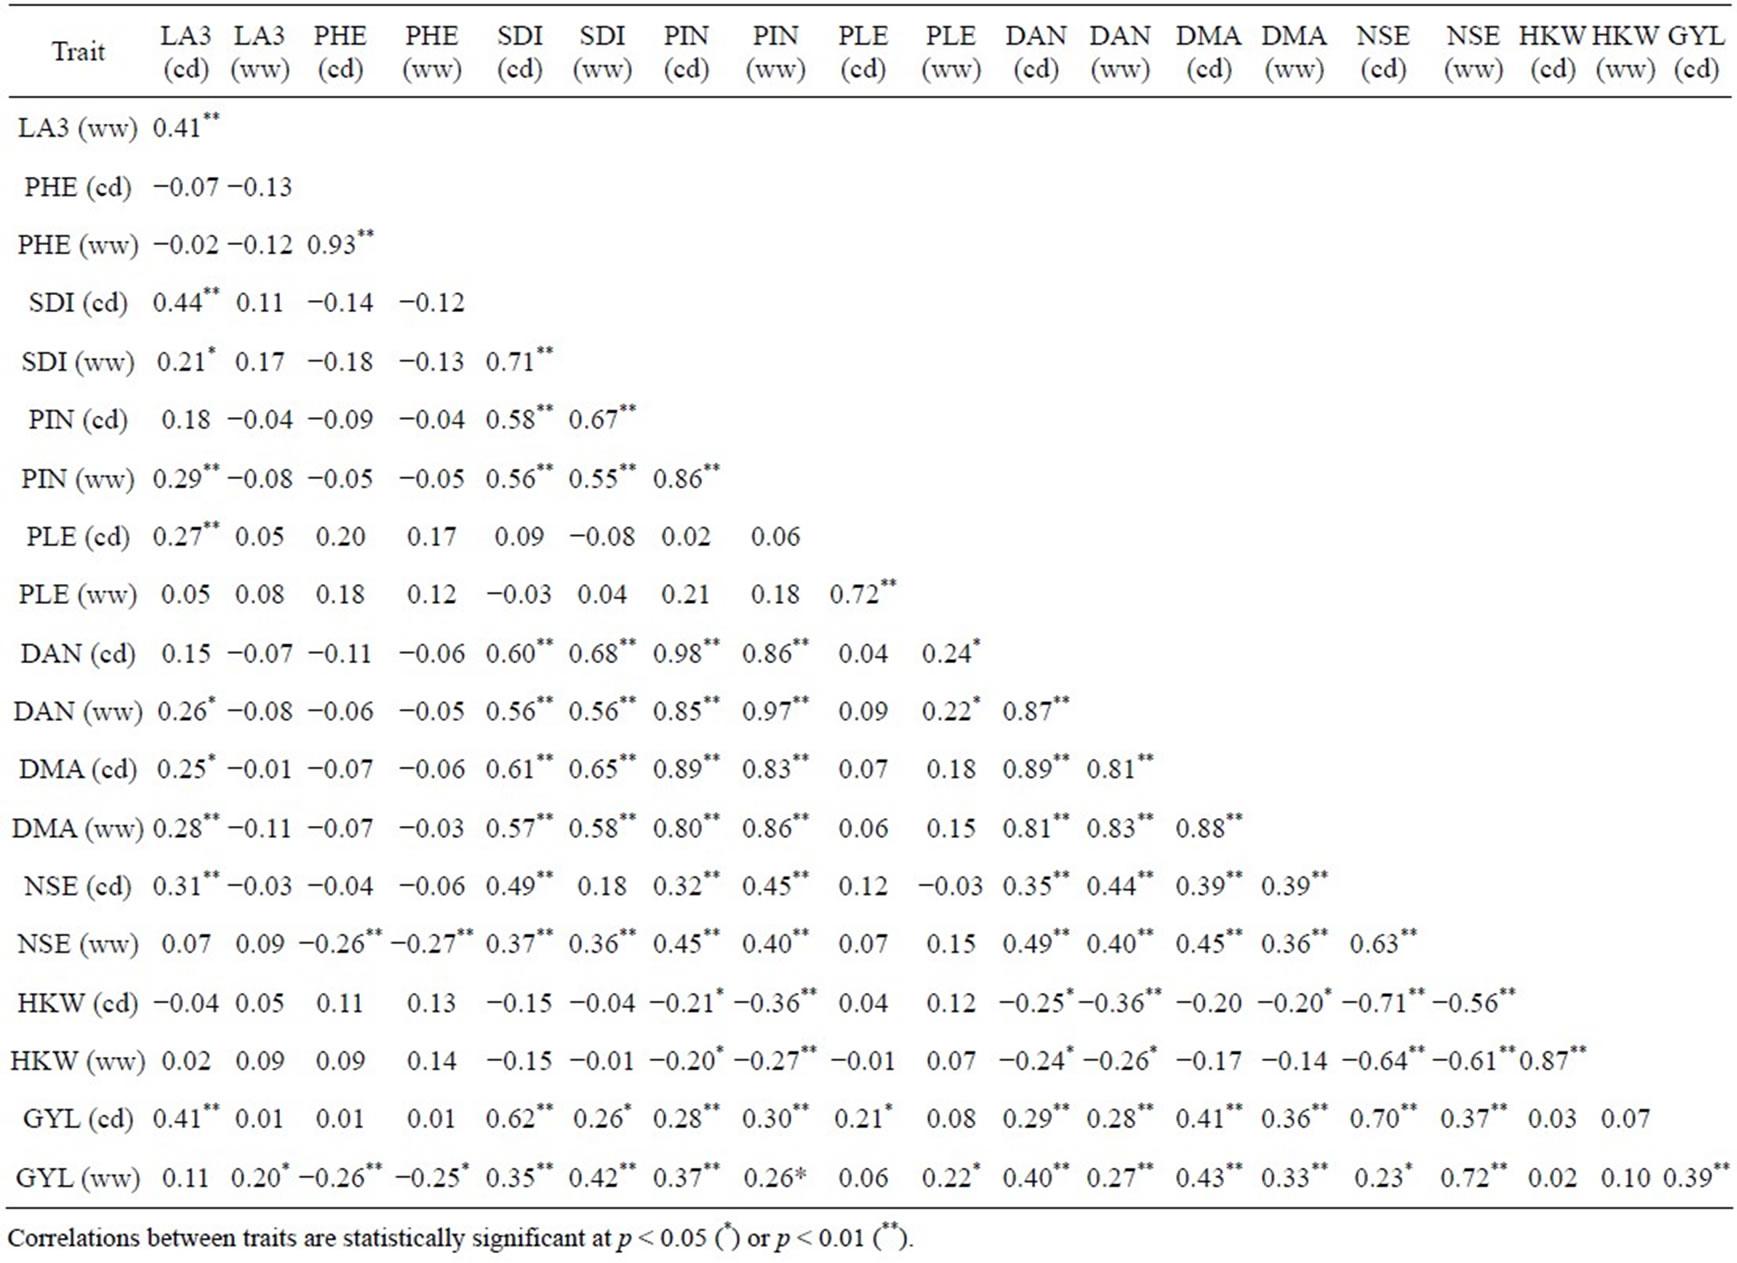
Table 2. Pearson’s correlation among 10 traits analyzed under well-watered (ww) conditions and continuously drying soil (cd) in the field.
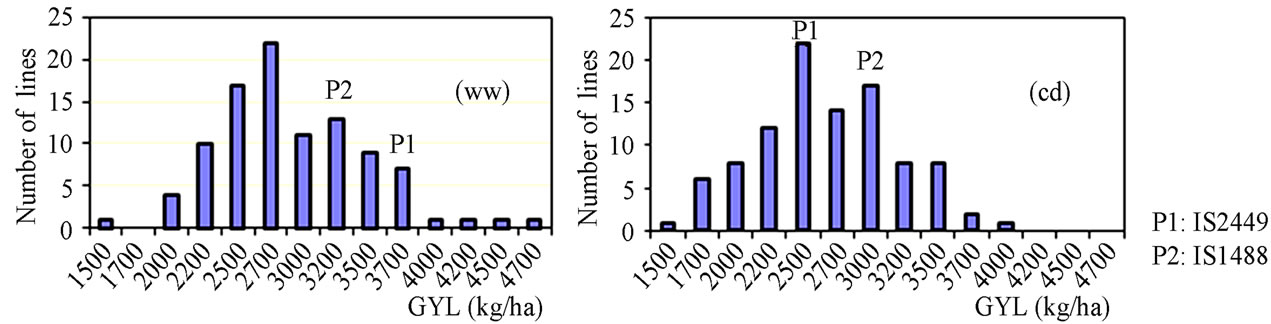
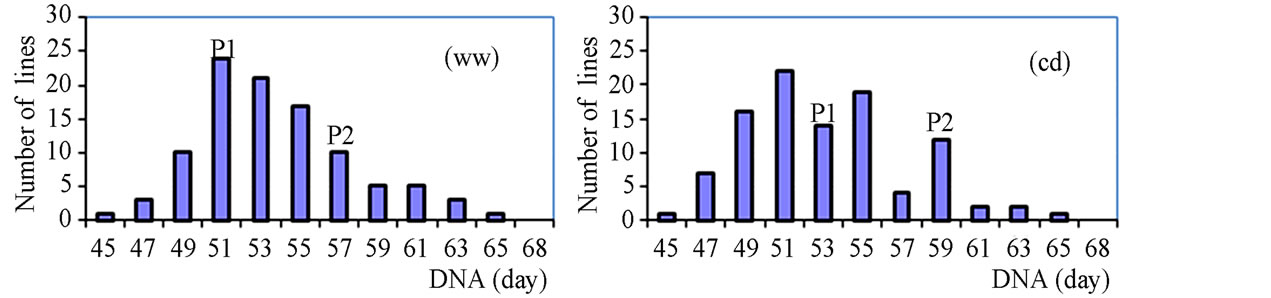
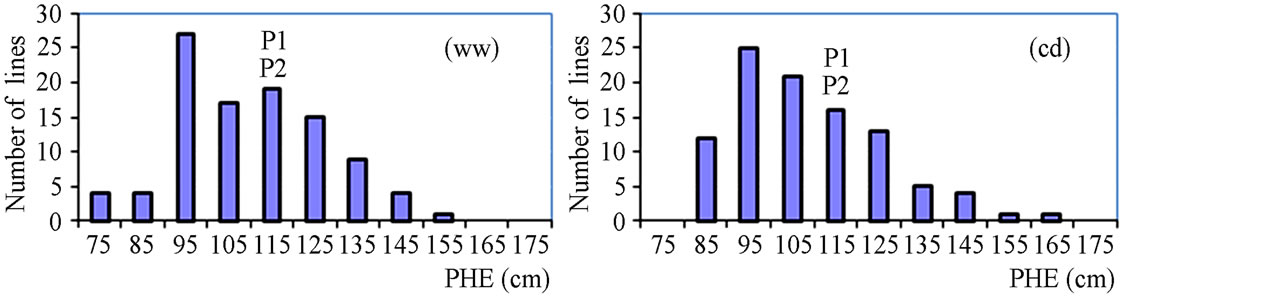
Figure 2. Frequency distribution of agronomic traits and yield.
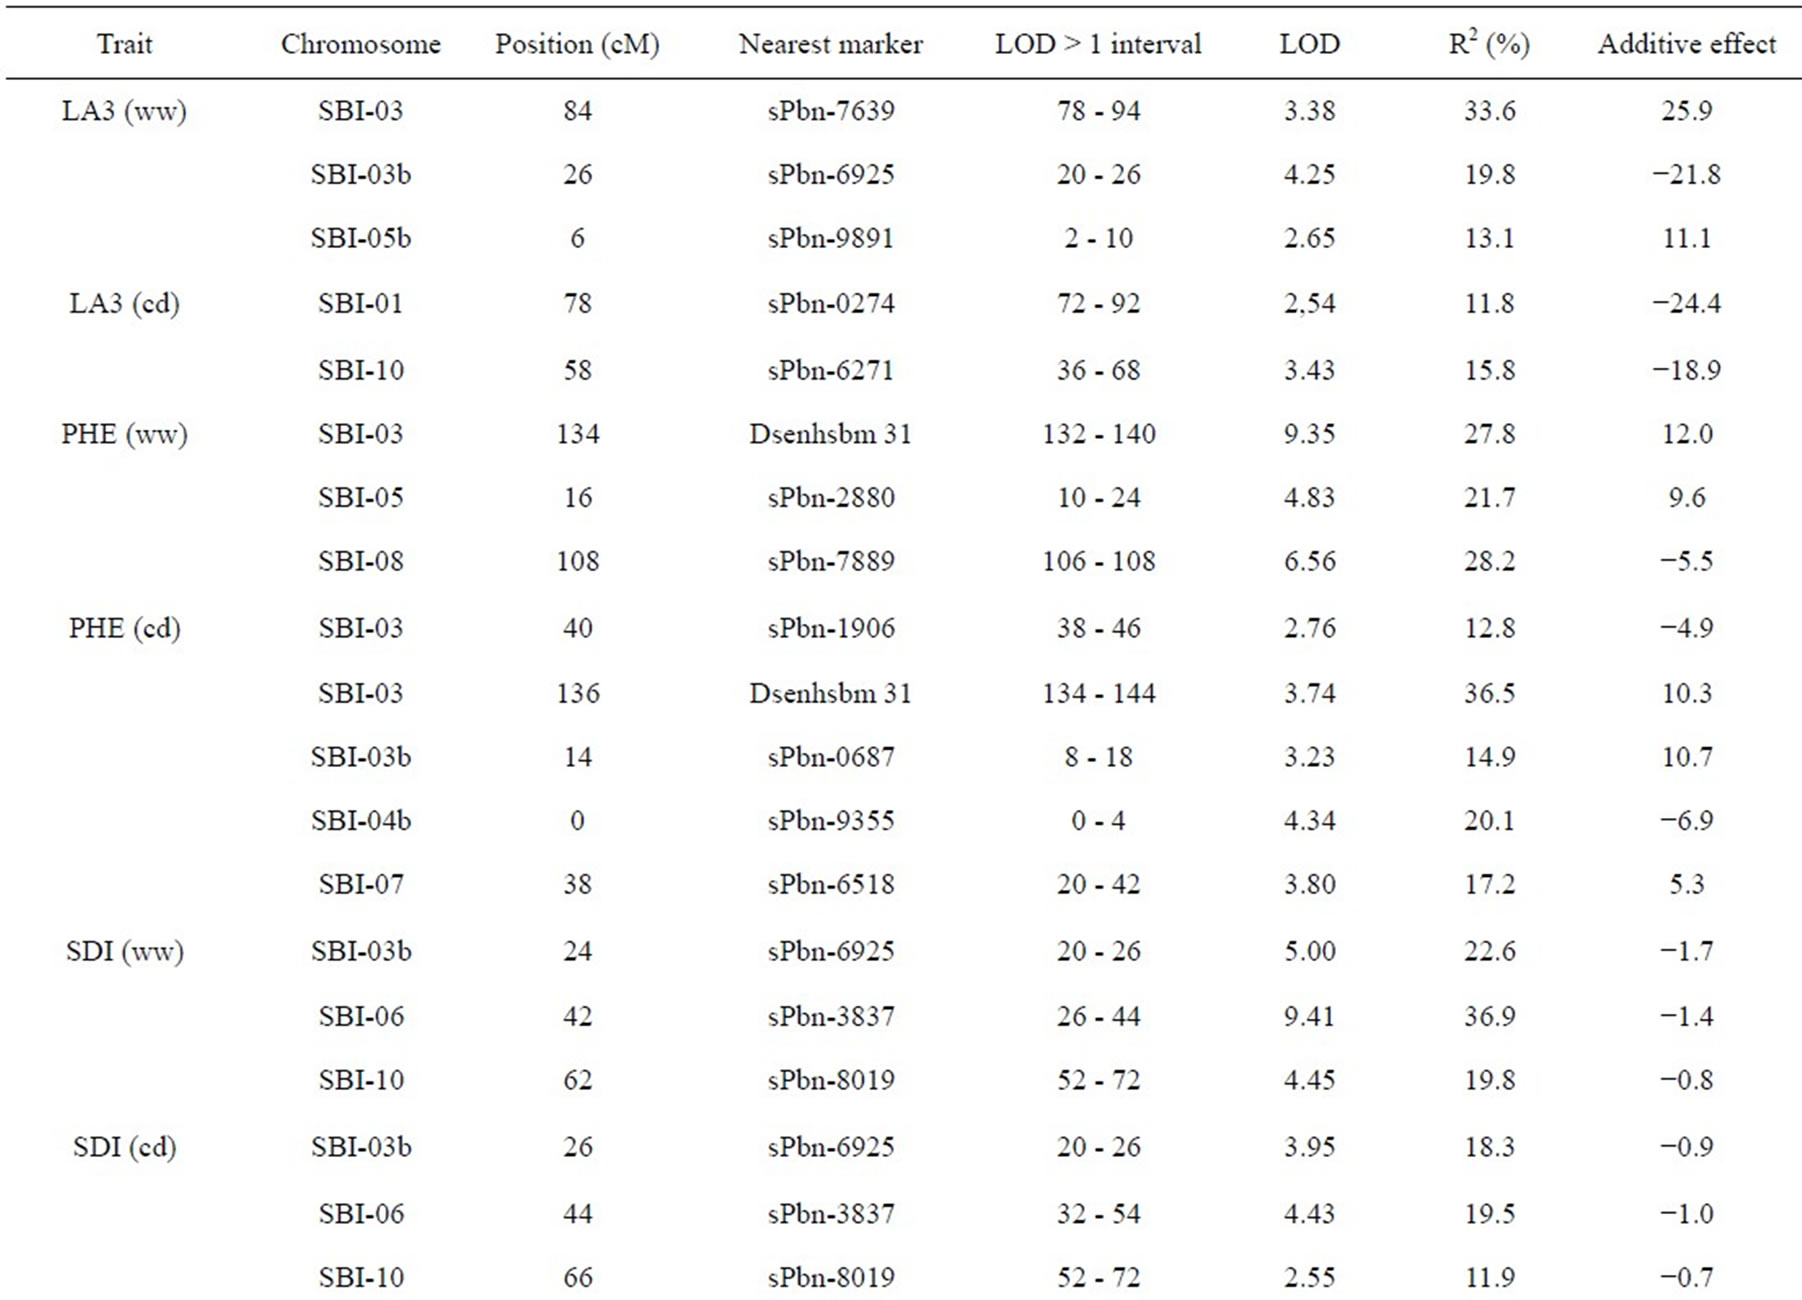
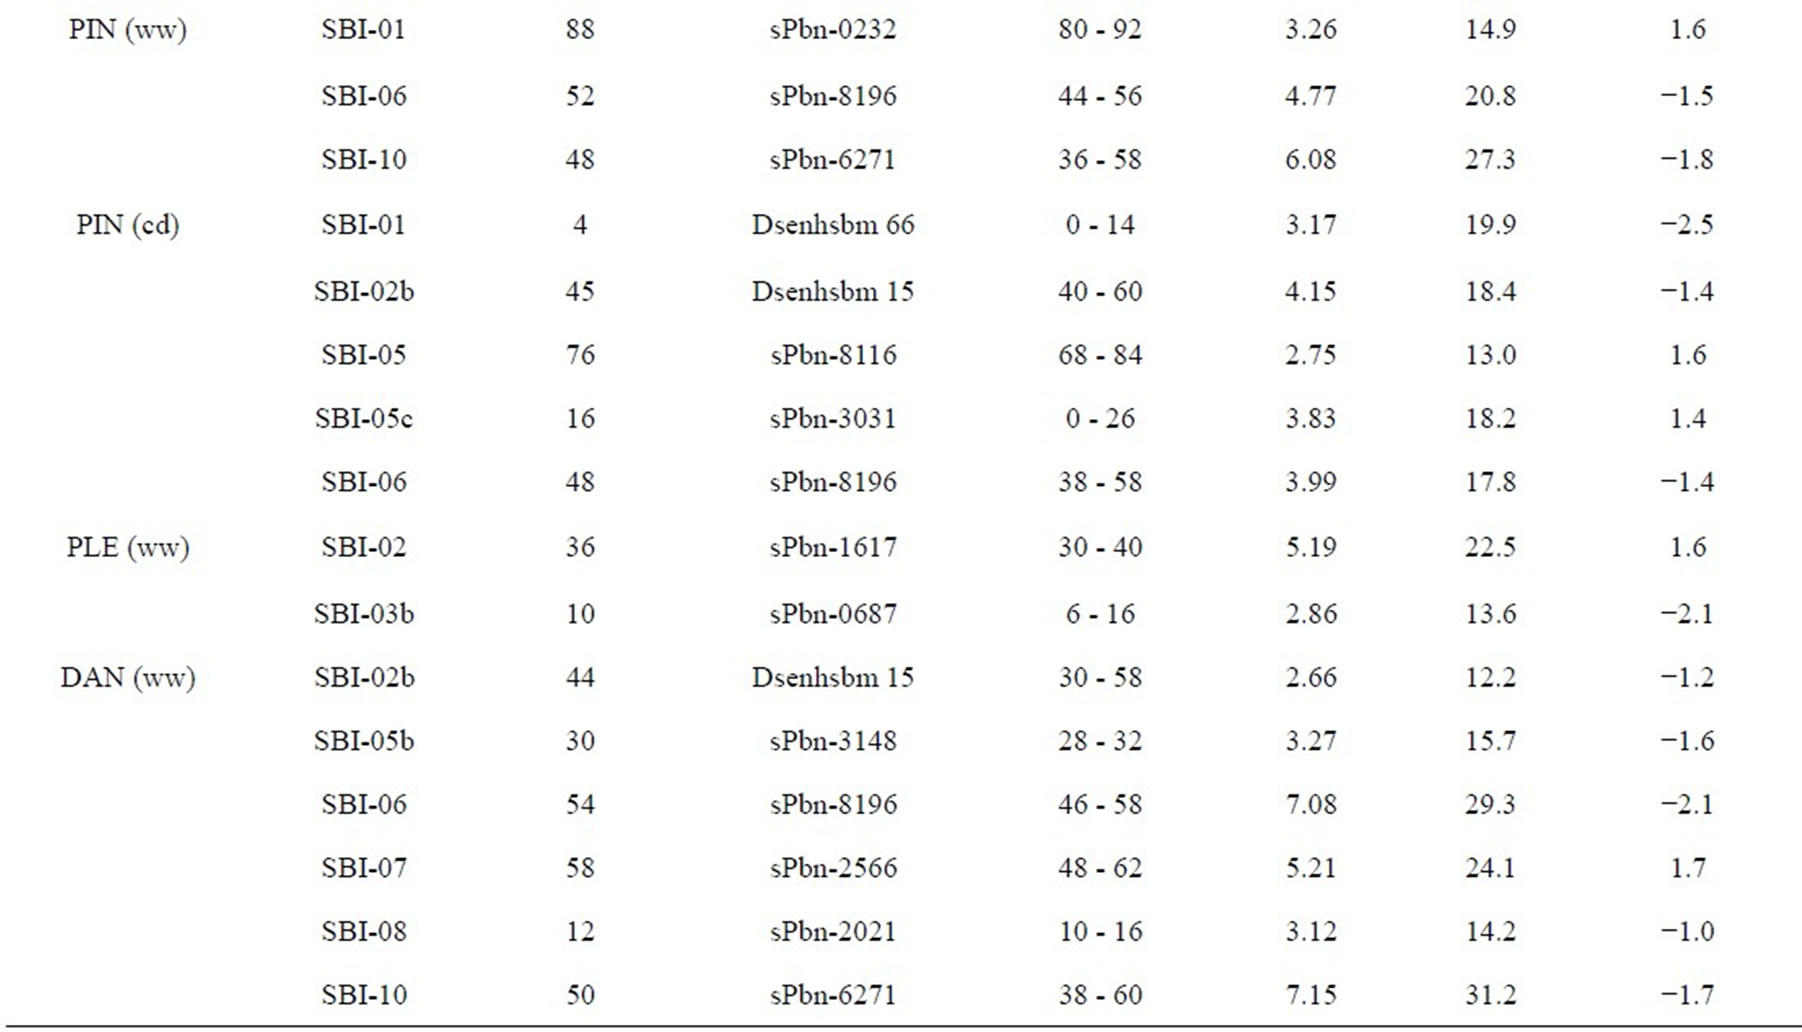
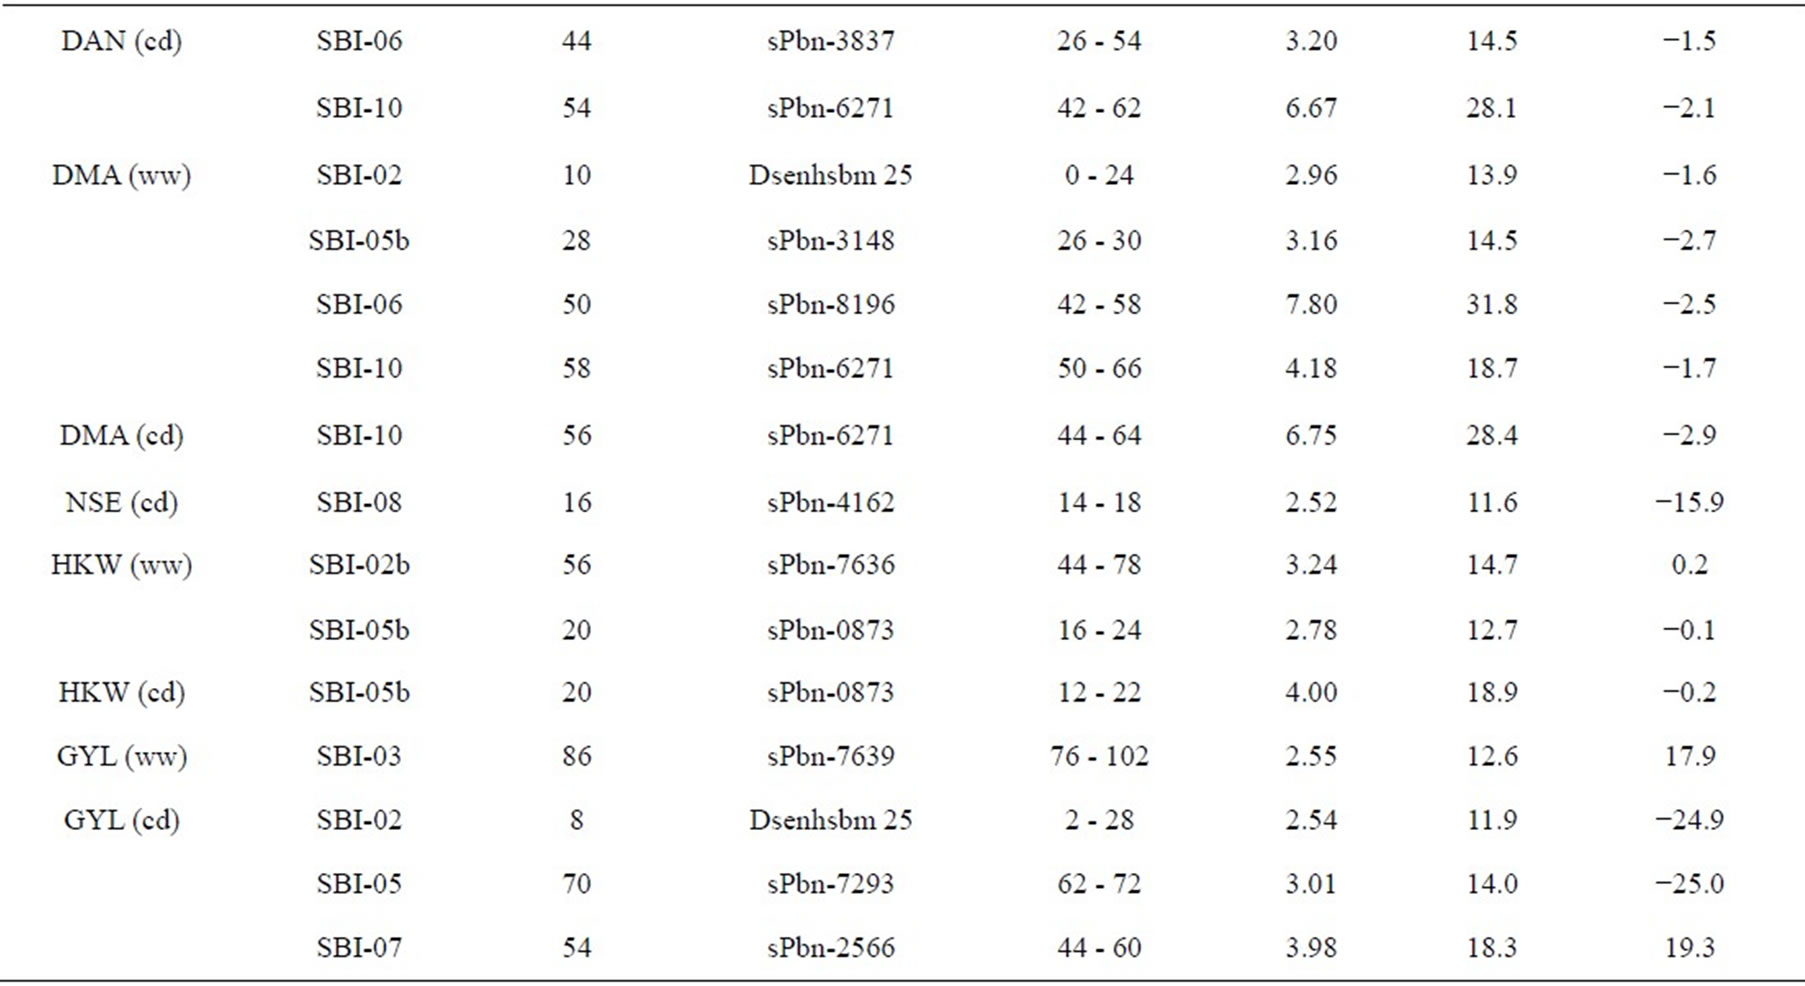
Table 3. Quantitative trait loci (QTLs) detected for 10 traits analyzed under well-watered conditions (ww) and in a drought stress condition (cd) in the field.
only on one QTL region on SBI−07 in the well-watered condition.
3.2.7. Days to Maturity
Five QTL were detected for DMA in the RIL population and were distributed on four chromosomes. Two QTL were identified on SBI-10, one each on SBI-02, SBI-05 and SBI-06. Only one QTL was identified for DMA (cd) on SBI-10. The QTL coincided with the corresponding QTL of DAN (cd). From the other QTL detected for DMA (ww), the two on SBI-05 and SBI-06 coincided with the corresponding QTL for DAN (ww). The phenotypic variation explained by each QTL ranged from 13.9% to 31.8%. The LOD score ranged from 2.96 to 7.80. The positive effect of QTL alleles influencing DMA was inherited by IS1488 and that is in agreement with the corresponding DAN QTL.
3.2.8. Number of Seeds per Plant
There was only one NSE (cd) QTL detected on SBI-08, which explained a phenotypic variation of 11.6% with a LOD value of 2.52. The IS1488 allele contributed positively to NSE at this locus.
3.2.9. Hundred Kernel Weight
Three QTL were found for HKW, two QTL for HKW (ww) and one QTL for HKW (cd). The QTL were detected on SBI-02 and SBI-10. The phenotypic variation explained by each QTL ranged from 12.7% to 18.9% and the LOD value ranged from 2.78 to 4.00. QTL had an identical position under well-watered and drought stress conditions on SBI-10. The additive effect of the detected QTL showed that the IS1488 allele contributed positively to HKW in the drought stress conditions. Under wellwatered conditions, alleles of both parental lines affected HKW positively.
3.2.10. Grain Yield
In this research, grain yield was influenced by the four QTL on SBI-02, SBI-03, SBI-05 and SBI-07. Among these, only one QTL was identified for GYL (ww), while the other QTL were detected for GYL (cd). The phenotypic variation explained by each QTL ranged from 11.9% to 18.3% and the LOD score ranged from 2.54 to 3.98. Alleles from both parents contributed positively to GYL.
4. DISCUSSION
In plants, drought tolerance is one of the most complex quantitative traits to study since it is controlled by many genes and the phenotype depends on the severity and timing of stress [27]. A long-term solution for improving and stabilizing crop productivity is the development and the utilization of crop cultivars that are well adapted to drought conditions. Only small progress has been documented on the utilization of specific physiological traits to enhance drought tolerance, maybe because of the poor understanding of physiological mechanism and its inheritance [28].
DNA markers allow breeders to detect genetic locicontrolling drought tolerance even in non-target environments. This molecular breeding technique significantly cuts the cost for field evaluation while increasing breeding efficiency and allows simultaneous selection for drought tolerance and other agronomic characters. Genetic mapping and identification of genomic regions associated with drought tolerance and yield would become the basis for the launch of marker-assisted transfer of some relevant genomic regions into elite genotypes. The DArT marker system was used in the present study. It turned out to be an affordable high-throughput marker system since DArT markers are powerful tools for QTL detection in crops like sorghum where SNP arrays are not publicly available. However, the non-random patterns of marker distribution [29] resulted in large gaps on most of the chromosomes. Thus, the use of additional marker systems, like microsatellites, is essential to fill the gaps and provide the equal genome coverage. The little usage of the DArT markers system for QTL detection in sorghum makes comparisons and analysis to previously published QTL for drought tolerance somewhat difficult.
As mentioned above, the first QTL studies on preflowering drought tolerance were done by [4], using 98 RILs derived from a cross of TX7078 × B35. Kebede et al. (2001) [3] used 125 RILs derived from a cross of SC56 × Tx7000. QTL for pre-flowering drought stress in grain sorghum based on leaf rolling, uncharacteristic leaf erectness, leaf bleaching, leaf tip and margin burn, delayed flowering, “saddle effects”, in which only end plants next to alleyways produce panicles, poor panicle exertion, panicle blasting, floret abortion and reduced panicle size were detected in sorghum, the RIL population by [3] on LGs C, E, F and G. In the present study, we detected QTL related to drought stress for NSE (cd) on SBI-08, QTL for GYL (cd) on SBI-07, QTL for SDI (cd), PIN (cd) and DAN (cd) on SBI-06 and QTL for PIN (cd) and LA3 (cd) on SBI-01, respectively. But the loci are not coincided with QTL detected by [3]. On the contrary, QTL detected for plant height and lodging tolerance on LG F in sorghum RILs by [3] correspond to the cluster QTL on SBI-06 for SDI, PIN, DAN and DMA (ww) of this study.
In comparison with the QTL analysis for pre-flowering drought tolerance in sorghum that was conducted by [4], this study dissected pre-flowering drought tolerance into yield per se, seed set stability, yield stability and height stability. The previous study detected eighteen QTL associated with pre-flowering drought tolerance in which six QTL were not associated with yield and other agronomic traits measured under fully irrigated conditions. The position of QTL on LG D for yield per se corresponds to the position of a QTL for PHE (cd) and GYL (cd) on SBI-07, the position of QTL on LG E for seed set stability near to the position of cluster QTL for SDIDAN, DMA PIN (ww) and LA3 (cd) on SBI-10 of our study. In several cases, the marker linked with traits under well-watered conditions was also linked with trait performance under drought. In this experiment, we identified major QTL groups on SBI-06 between marker sPbn-4036 and sPbn-6445 and on SBI-10 between the marker sPbn-9999 and sPbn-3832. Clustering of QTL for agronomic traits on a particular marker locus was reported by [16] on SBI-01 and SBI-06. Overlapping of QTL for multiple traits on the same chromosome region could be as a result of influence by the same set of genes (pleiotropy), genetic trade-offs among multiple traits or the effect of certain physiological or developmental measures on complex traits [30].
5. CONCLUSION
The main QTL regions for agronomic performance were detected in clusters of chromosomes SBI-06 and SBI-10. The genome regions that showed special association with pre-flowering drought tolerance are located on chromosomes SBI-01, SBI-03, SBI-04, SBI-05 and SBI-07. Interestingly, even though this study used different markers and a different RIL population, some detected QTL seem to coincide with some previously known QTL [3,4] on the same chromosomes. This may indicate the constancy of those loci controlling pre-flowering drought tolerance in sorghum. Results also support the hypothesis that genotypes considered to be drought tolerant may not outperform genotypes selected under non-stress conditions in most environmental scenarios, including stress situations (cf. [8,31]). Although the majority of the detected QTL influencing traits in the study are highly reliable, repeat experiments in other environments are needed to verify QTL regions.
6. ACKNOWLEDGEMENTS
The authors would like to thank SiekeSchaepe for DNA extraction. We gratefully acknowledge the Ministry for Education and Training, Vietnam, for financial support.