Estimation of Wheat Area in Córdoba, Argentina, with Multitemporal NDVI Data of SPOT-Vegetation ()
1. Introduction
In a large part of Córdoba Province, dryland wheat production is marginal, characterized by low average yields and high harvesting uncertainty [1]. While wheat production faces poor agroclimatic conditions in Cordoba, particularly because of lack of water availability and also frost damage [2,3], the great increase of the soybean area in recent years has become the main threat to the sustainability of farming systems because of a negative carbon balance (organic matter) and lower soil water availability. Thus, the inclusion of wheat in crop rotations has been proved to be a necessary and advantageous practice for agriculture in the region.
In order to estimate agricultural production in a region, it is necessary, on the one hand, to establish the area occupied by each crop and, on the other hand, to know the productivity achieved. Classical surveying methods are very expensive and time-consuming [4]. Using of radiometric data produced by remote sensing of the Earth has been developed as a promising solution to overcome these limitations [5].
At a crop canopy level, reflectance changes during the growing season are greater in near infrared (NIR) wavelengths due to the increase of biomass causing its dispersion, while the visible fraction (V) spectrum shows a minor but significant variation during the season, related to light absorption by the photosynthetic and photoprotection pigments [6,7]. The sharp contrast of reflectivity between the V and NIR of a surface covered by active vegetation is not present in bare soil or when vegetation is not active. This signal is used to differentiate the two basic components of an agricultural scene, soil or crop, by a vegetation index (VI), such as the Normalized Difference Vegetation Index (NDVI), which integrates both V and NIR data.
Classification methods discriminate various items of interest exploiting the territorial variability of a scene, i.e., emphasizing the spatial or geographical dimension of the radiometric data, but also can take advantage of differences in radiometric behavior throughout the cycle according to the phenological development of each crop, giving particular importance in this case to the temporal dimension of the records and their phenology particularly [8].
The spatial resolution of the radiometric data is another important factor to consider in discriminating the different cover of a scene. Traditionally, Landsat TM data have been used to classify and map crops because of its higher spatial resolution (30 m), but its use is limited due to low revisit frequency and the high volume of data, which makes it difficult to implement a crop monitoring system [9]. For this reason, crop classification using Landsat data has been restricted to solving problems at local or sub-scene level [10]. These difficulties have encouraged the use of high temporal resolution images, despite their lower spatial resolution, to characterize and identify crops. There is extensive literature using Advanced Very High Resolution Radiometer (AVHRR) time series, with a resolution greater than 1000 m, for this purpose [11,12].
In recent years, from the availability of Moderate Resolution Imaging Spectroradiometer (MODIS) images opened up the possibility of using this information that made a balance between spatial (250 m) and temporal (16-day composite images) resolution of the data [13]. Reference [14] used this to determine corn and soybeans areas in the USA, and validated their results using 2002 data from the United States Department of Agriculture-National Agricultural Statistics Service (USDA-NASS) at national, state and county scale. While they obtained results that highly matched the information used as reference, by restricting the analysis to a single production season, the predictive behavior that may occur under different climate scenarios remained an open question, to be overcome by the use of more extended time series. Also, [15] used MODIS Enhanced Vegetation Index (EVI) images to estimate the area occupied by wheat in Santa Fe Province, Argentina, and validated their results using Landsat data. In this case, the analysis is restricted to a single year, too.
Reference [16] used time series consisting of 10-day MVC-NDVI images from SPOT VGT between 1998 and 2008, covering large parts of South America at 1 km spatial resolution. Filtered time series of vegetation indices were used for studying vegetation dynamics at a continental scale. Reference [17] used 10 days of temporal resolution SPOT-Vegetation NDVI data to develop a method for identifying and describing areas with different vegetation cover types and agricultural areas that followed different crop calendars in India. Reference [18] generated NDVI profiles from nine scenes of SPOT/ HRV to characterize seasonal trends in six cropping systems in Japan. Reference [19] used four LANDSAT TM NDVI images acquired in spring, early summer, late summer and early fall in 1996-1997 to classify land cover types in the south-western Argentine Pampas.
The aim of this work is to develop a methodological and operational framework for estimating wheat area in Cordoba Province, Argentina, using NDVI time series of coarser spatial resolution (1 km). The development and evaluation of two generic classification procedures are presented, with different variants of calculation in each case, to estimate the crop area. This provides an alternative to the routine procedure implemented by the Agriculture Ministry of Córdoba Province to estimate the production of major crops by using field surveys. In this sense, the development of an agricultural forecasting system from satellite data would serve, first in an exploratory stage and then in an operational context, as an independent control element to verify the data that emerge from field survey.
2. Materials and Methods
2.1. Site Description
As shown in Wheat Regions of Argentina (Figure 1), Northern Regions II and V, and to a lesser extent Southern Regions I and V, converge in Córdoba Province, and have different environmental conditions in both climate and soil. While atmospheric water demand for wheat is reduced during the winter season, there is a water balance deficit due to the low rainfall in the region, aggravated to a greater or lesser extent by the different waterholding capacity of soils. This limitation becomes gradually more pronounced from the more favorable climate in the East (Region II North), to the more restricted conditions in the centre of the Province (Region V North). The risk is reduced in the eastern sector of Córdoba Province (Marcos Juárez Department), which is more likely to receive a significant amount of rain during the wheat season, so that the initial water reserve is less crucial to reach the minimum consumption required to produce yield [20]. The opposite occurs in the central region of the province, where the risk increases because seasonal rainfall in terms of its total amount or its distribution

Figure 1. Wheat production regions in Argentina.
is generally inadequate and, consequently, the initial reserve of water becomes critical to obtaining a reasonable yield [1].
The previous stochastic analysis is also supported by experimental evidence that shows the influence of water availability in different parts of the Province, both at planting and during the cycle, on wheat productivity [21], particularly at the reproductive stage [3].
2.2. NDVI Data
The determination of the area occupied with wheat was conducted using data of the Normalized Difference Vegetation Index (NDVI) from the SPOT-VEGETATION satellite, provided by the Vegetation image processing centre (CTIV) of the Flemish Institute for Technological Research (VITO). The NDVI is a dimensionless index that expresses the presence and density of vegetation, and is calculated according to the following equation:
 (1)
(1)
Here ρr and ρnir are reflectance values corresponding to red and near-infrared wavelengths, respectively.
The S10 NDVI SPOT-VEGETATION was used in this work. This product is composed over 10 days using the Maximum Composite Value (MCV) algorithm. The data contains only NDVI values, i.e. it does not have the original spectral bands, or the viewing and solar angles. The spatial resolution is 1 km and the images are radiometric and geometrically corrected, and are available for the entire series of 10-day images from April 1998 until December 2009, for the geographical territory of Argentina.
Through VGTExtract software [22], original images were converted to Integrated Land and Water Information System (ILWIS Open 3.8) format, which was the software used for processing. The analysis was made at political boundary level, taking the delimitation of the department administrative units from a vector map of Córdoba Province, to define areas of interest (Figure 1).
2.3. Crop Cycle
In tests conducted at the Agricultural Experimental Station INTA Marcos Juarez, which coordinates wheat Sub regions I, II North, III and V North, and assists in the Sub region II North, wheat cultivars are classified according to the crop cycle length as long, intermediate and short, with the dates of sowing, heading and physiological maturity, as shown in Table 1 [23-25].
Table 1 shows that the most common sowing date of cultivars in the region ranges from the second half of May to first fortnight of July, depending on the cycle length, so that the period between May and June includes almost all sowing dates in the Province. Meanwhile, due to the photoperiodism behavior of this long-day species, heading tends to occur from late September through October, with some independence of the planting date [3]. Similarly, all varieties reach physiological maturity in November, as seen in Table 1.
In summer there is a greater diversity of crops in the region, but wheat is the dominant crop during winter, so that the growth dynamics of the NDVI curve are assumed to represent only this crop. Figure 2 shows the variation in wheat area and that of other alternate winter crops (oats, malting barley and rye) harvested in Cordoba Province in recent years. The annual oscillation of the area under wheat production is very noticeable, as well as the marked decrease in wheat area in 2009 as a result of an intense and prolonged drought in the region. Alternative

Table 1. Phenological stages observed in different years for wheat cultivars grouped according to the cycle length, when tested in Marcos Juarez INTA [23-25].
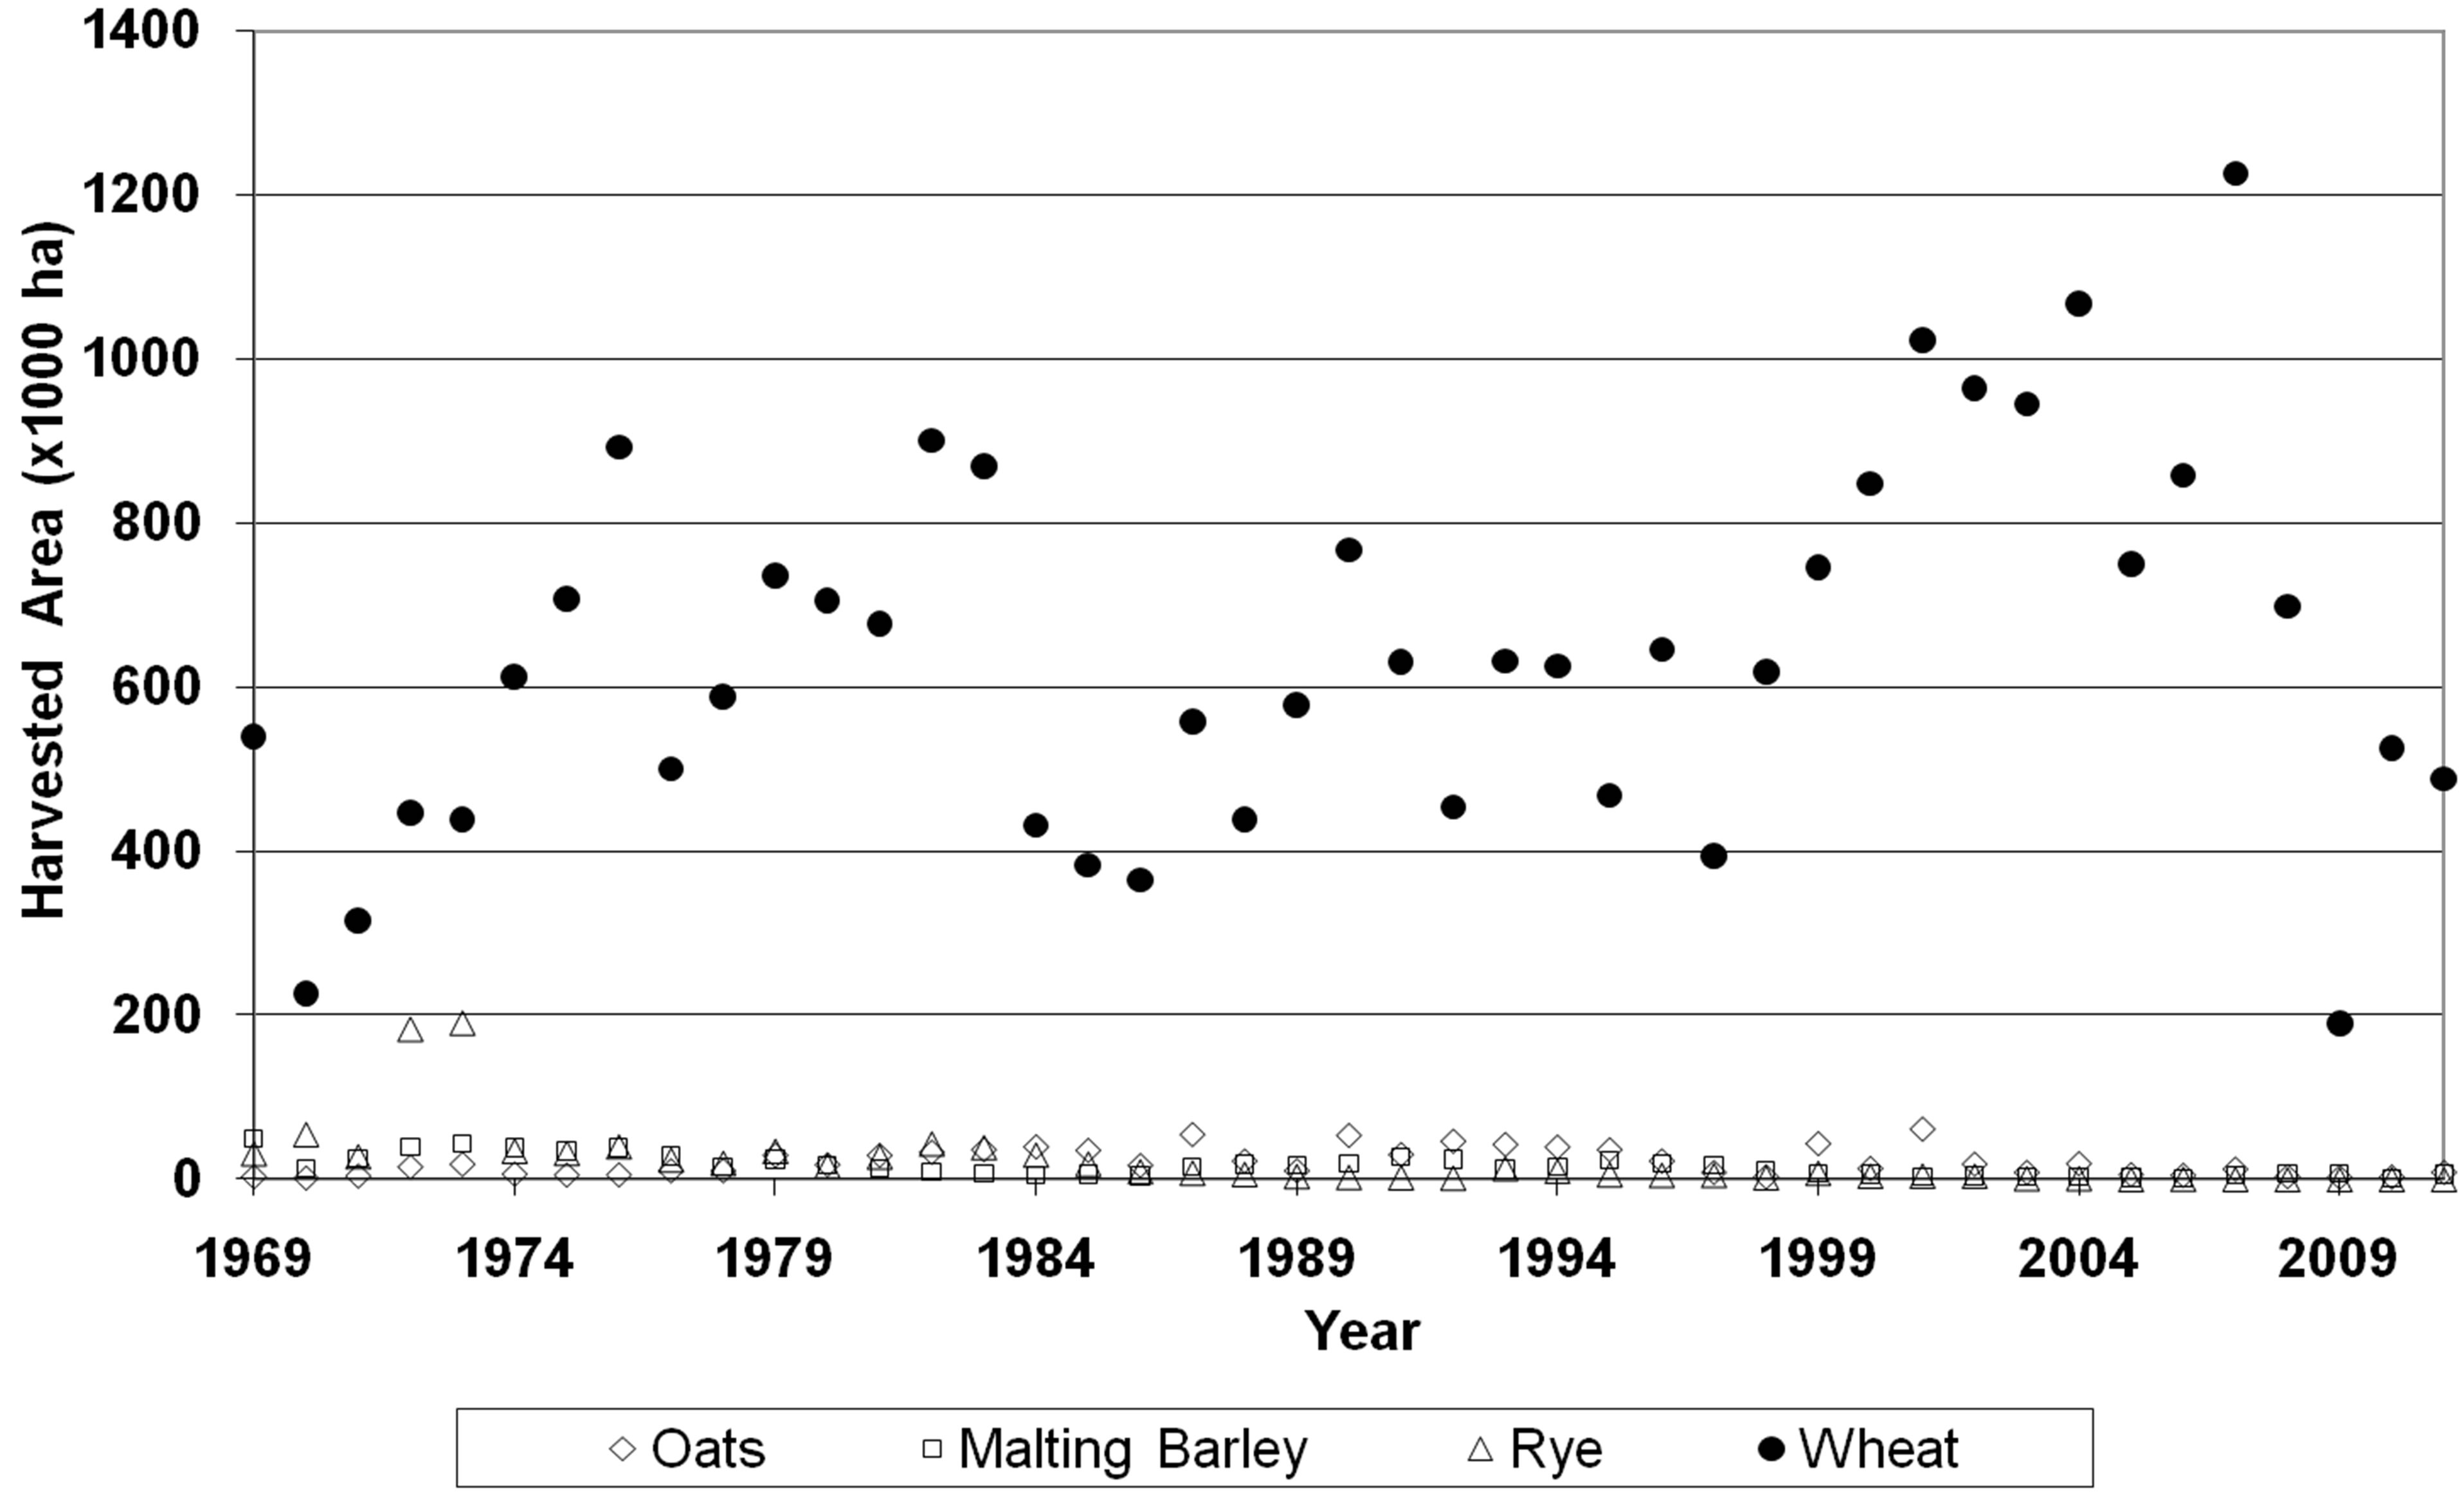
Figure 2. Harvested area with different winter crops in Cordoba Province, Argentina, between 1969 and 2011.
winter grain production is relatively very small in this region during the period studied. Official data [26] shows that the ratio of harvested area of other winter cereals with respect to wheat was below 5% for all years between 2005 and 2011. Thus the proposed procedures predominantly classified areas occupied with wheat
2.4. Methods for Estimating Wheat Area
To estimate yearly wheat area, the NDVI temporal profile of each pixel was compared with the relevant phenological changes during the wheat growing cycle. The classification was made with two unsupervised procedures. In both cases, the main stages of wheat development were adopted following to the information in Table 1, assuming that this adequately represents the diversity of wheat genotypes growing in the region.
2.4.1. Characteristic Phenology Behavior Method (CPBM)
Following a decision tree approach, this procedure considers that wheat can be identified by exploiting the contrast between typical values of NDVI variation throughout the cycle with respect to the area not occupied by active vegetation. The model rules consist of if-then conditional statements that specific input data are passed through to arrive at a pixel wheat prediction [27]. The sowing period necessarily represents a minimum in the NDVI curve (mins), and following Table 1, a probable window for the temporal location was established of two months from May to June. Then, as the wheat cycle progresses, a maximum value of NDVI (maxh) should appear during the full coverage period corresponding to the heading stage of this crop. This was considered more likely to occur during September-October. Subsequently, the variation of the NDVI curve should show a decrease related to the senescence and physiological maturity process, reaching a new minimum at the end of the cycle. November was set as a window for determining the minimum end-of-cycle NDVI value (minpm). Finally, the amplitude (ampsh) was also considered, determined by the difference between the maximum (heading stage) and minimum (sowing), typical of a normal plant growth process. After obtaining the mean values of mins (m_mins), maxh (m_maxh), minpm (m_minpm) and ampsh (m_ampsh) for all pixels of interest, the area (pixels) occupied by wheat was determined from a multiplicative scheme, with three different models of evaluation, as seen in Figure 3.
2.4.2. Reference Curve Method (RCM)
This procedure analyze the correspondence at each pixel between the observed sequence of NDVI data from planting to physiological maturity, compared to a continuous curve that was set with m_mins, m_maxh and m_minpm values. Four reference curves (designated in ascending order) where evaluated, which to simplify calculations, were formed by integrating 4 sections, as shown in Figure 4. The first, common to all curves, includes a 50-day period from May 1st, and is a constant value for each year and territory, obtained from minimum NDVI values. The constant value was calculated subtracting a standard deviation (sd_mins) from the territorial minimum average value (m_mins). The third section of the curve also had constant values (plateau) for 40 days, and was obtained from maximum NDVI values from September 1st. The constant value was calculated

Figure 3. Flow diagram of Characteristic Phenology Behavior Methods (CPBM).

Figure 4. NDVI profiles used by the Reference Curve Method (RCM) for identify the pixels with wheat in 2010. NDVI profiles observed in irrigated wheat plots (P) in different years are overlapping, as well as the average value of the set (the bar indicates the standard deviation) and also a polynomial curve fitting.
adding a standard deviation (sd_maxh) to the territorial maximum average value (m_maxh).
Between the first and third sections, the method considers a linear growth rate that, depending on the curve selected, determines an earlier or later plateau stage. Finally, the 4th section considers a decreasing linear rate between the value of the 3rd section and a regional average of the minimum values for the month of November (m_minpm) subtracting a standard deviation (sd_minpm), and may be a little longer depending on the reference curve considered. Figure 4 shows the 4 curves obtained from RCM in 2010.
The first section of the NDVI curve corresponds to a background NDVI value for fallow (field crops). In Figure 4 this value is 0.25, similar to the 0.20 proposed by [28] for most field crops and nut trees. Also shown in Figure 4, the NDVI profiles observed were obtained in irrigated wheat plots for different years during the study period, which explains the slightly higher values compared to the 2010 theoretical NDVI profile. Based on average values of all plots for each 10-day period a polynomial function was fitted to give continuity to the records. The observed curve has a temporal development, beyond its absolute value, that validates the phenological information used to develop classification models, such as the initial establishment period and the plateau stage, which were established at about 50 and 40 days, respecttively.
To establish the wheat area, each pixel was evaluated by correlation and regression between the reference curve and NDVI values, considering two indicators for selection, the coefficient of determination and the slope of the linear relationship. Wheat corresponds only to pixels with both values greater than 0.5. As a test, thresholds of 0.4 and 0.6 were also evaluated for the classification.
2.5. Evaluation and Validation
The predictive behavior of the proposed procedures was evaluated using crop statistics compiled and published by the Agriculture Ministry of Córdoba Province [29] as field information. Data from Río Segundo Department (Region V North) were used to evaluate the procedures and verification was then performed with data of Marcos Juárez Department (Region II North).
3. Results and Discussion
Figure 5(a) shows that, for most years, calculated values correlated well with the wheat area estimated by the Ministry of Agriculture, with greater or lesser accuracy according to each procedure. However, for some procedures in 2007, the difference between the estimates of both sources is very large. Nevertheless, the figure shows that there is no appreciable increase in the wheat surface over time, which supports the use of Root Mean Square Error (RMSE) for comparative purposes. Figure 5(b) shows the difference obtained each year between the percentage wheat area values reported and those estimated using the different options proposed for Río Segundo Department.