Expression Patterns of CAPN1 and CAPN8b Genes during Embryogenesis in Xenopus laevis ()
1. Introduction
Found in all eucaryotes and some bacteria, the multigenic calpain family encodes calcium-dependent cysteine proteases that vary in their domain structure, expression and substrate specificity [1]. Calpains have a limited proteolytic activity and function in order to modulate their substrates activities. There are typical and atypical proteases according to the presence or absence of the calmodulin-like domain [2,3]. Moreover, some typical calpains are ubiquitous, while others are tissue-specific.
The ubiquitously expressed calpain 1 (CAPN1) is well characterized [4]. It is a heterodimeric enzyme consisting of a large catalytic subunit (80 kDa) and a small regulatory subunit (30 kDa), common with the calpain 2. These two enzymes have mostly indistinguishable substrate and they are ubiquitously expressed, but they differ in the in vitro Ca2+ requirement (µM versus mM) for the proteolytic activity. The large and small subunits contain four (I-IV) and two (V-VI) domains respectively: the regulatory N-terminal domain (I), the protease domain (II), the C2-domain-like Ca2+/phospholipid-binding domain (III), the penta-EF-hand domain (IV and VI) and the Glyclustering hydrophobic domain (V). In the presence of Ca2+, the binding of Ca2+ to domains II, III, IV and the domain VI induces some conformational changes that allow domain II to form a single active domain [5]. Ubiquitous calpains are synthesized under inactive form, activated after translocation near the plasmic membrane [6]. Their activity is strictly regulated.
The functions of the ubiquitous calpains are fundamental; they are implicated in a large range of biological processes, such as regulation of cell cycle, cell migration, apoptosis or intracellular signaling [7-9]. The calpains are thus probably necessary in all the stages of cell life. Calpain genes were particularly indispensable for early development of vertebrates [10-13]. The CAPN1 (NP_ 001080485.1) distribution was performed during the development of Xenopus laevis and its essential role demonstrated [14].
The mammalian typical calpain 8 (CAPN8), previously known as nCL-2, is specifically expressed in the stomach and weakly in the intestine [15,16]. An ortholog of human CAPN8/nCL-2, XCL-2, was identified during embryogenesis of Xenopus laevis and it is actually referred by the official symbol CAPN-8b. The role of CAPN-8b was demonstrated during the cell movements of gastrulation and neurulation [17].
Only a few studies regarding the calpains have been realized in amphibian [18]. The aim of the present paper is to compare during the embryogenesis of Xenopus laevis the expression profiles of a well-known calpain, the CAPN1, with a calpain that is less studied, the CAPN-8b. The objective is to show whether there are quantitative differences between their expressions. Quantification is carried out by a relative approach comparing the amount of the target mRNA with those of a reference gene, the fixB gene.
2. Materials and Methods
2.1. Embryo Culture
Three independent in vitro fertilizations (FIV) (with three different females) were realized following standard procedures. Xenopus laevis females were stimulated by hCG (human chorionic gonadotrophin) injection. For each one, in vitro fertilized eggs were incubated at 23˚C. Only eggs that turned round with the animal pole on the top were harvested. For each FIV, different sets of few embryos from developmental stages 0 (unfertilized eggs), 1 (fertilized eggs), 5 (morula, 2 h 45 pf at 23˚C), 8 - 9 (blastula, 5 h pf at 23˚C), 11 (gastrula, 11 h 45 pf at 23˚C), 20 (neurula, 21 h 45 pf at 23˚C), 36 (tailbud, 50 h pf at 23˚C), 48 and 58 (metamorphosis, about 2 months) were collected, anesthesized with MS222 (Sigma, St Louis MO), and immediately immersed in RNAlater RNA stabilization Reagent (Qiagen) with β mercaptoethanol (10 µl β mercaptoethanol for 1 ml of RNAlater RNA stabilization Reagent) and stored at −70˚C. The embryos were staged according to [19].
2.2. RNA Extraction
Total RNAs from each sample were extracted using RNeasyR Lipid Tissue Mini kit (Qiagen) according to the manufacturer’s instruction, including on column DNase treatment. Total RNAs were eluted into 30 µl of elution buffer. The RNAs yield and purity were assessed by spectrophotometric measurements on Nanodrop ND- 1000 (NanoDrop technologies). Each sample was measured three times and the average value was determined. The quality of total RNAs was analyzed by 1% ethidium bromide agarose gel electrophoresis. RNAs integrity was estimated using AGILENT RNA 6000 Nano kit on an Agilent 2100 Bioanalyzer (Agilent technologies).
2.3. Reverse Transcription
Total RNAs (1 µg) were reverse transcribed with anchored Oligo-dT. Then, cDNAs were amplified using VersoTM cDNA kit (Thermoscientific) according to the manufacturer’s instruction. 50 pg fixB (bacterial gene, spike control) were added to a total volume of 20 µl and incubated at 42˚C for 45 min. Enzyme was inactivated at 95˚C for 2 min. The reactions were subsequently diluted to 80 µl and frozen at −20˚C.
2.4. Primer Design
Sequences of primers for X. laevis CAPN1 (mu/I) and CAPN8b were designed by using the Primer3 software (Whitehead Institute/MIT, USA) and purchased from Eurogentec (Seraing, Belgium). These primers have Tms between 52˚C and 60˚C and the products were 160 and 137 bp. Primers used for qPCR detection of are shown in Table 1.
2.5. Real-Time Quantitative PCR Using SYBR Green I
LightCycler DNA Master SYBR Green I (Roche Diagnostics GmbH, Mannheim, Germany) combined with LightCycler Instrument (Roche Diagnostics GmbH, Mannheim, Germany) and suitable primers were used for qRT-PCR, according to the manufacturer’s instruction. The LightCycler experimental run protocol consisted of an initial Taq activation at 95˚C for 8 min, followed by a “touch down” PCR step of 45 cycles consisting of denaturation at 95˚C for 15 s, annealing at 68˚C for 5 s, and elongation at 72˚C for 8 s. After completed qPCR, melting curves were collected. A slower melt rate of 0.1 degrees C/s was effective for detecting weak amplicons, and improved resolution of the T(m) of amplicons amplified simultaneously. Relative quantification was carried by the standard curve method out using the LightCycler® Relative quantification Software (Roche Diagnostics GmbH, Mannheim, Germany, version 1.01). A series of dilutions of calibrator sample (external standard = pool of four sets of embryos from stage 48 = 2 µg) was included in each experiment in order to generate an external standard curve. That curve was used for quantification of both target and FixB gene (spike control) in each sample. The calculation of data was based on the cross
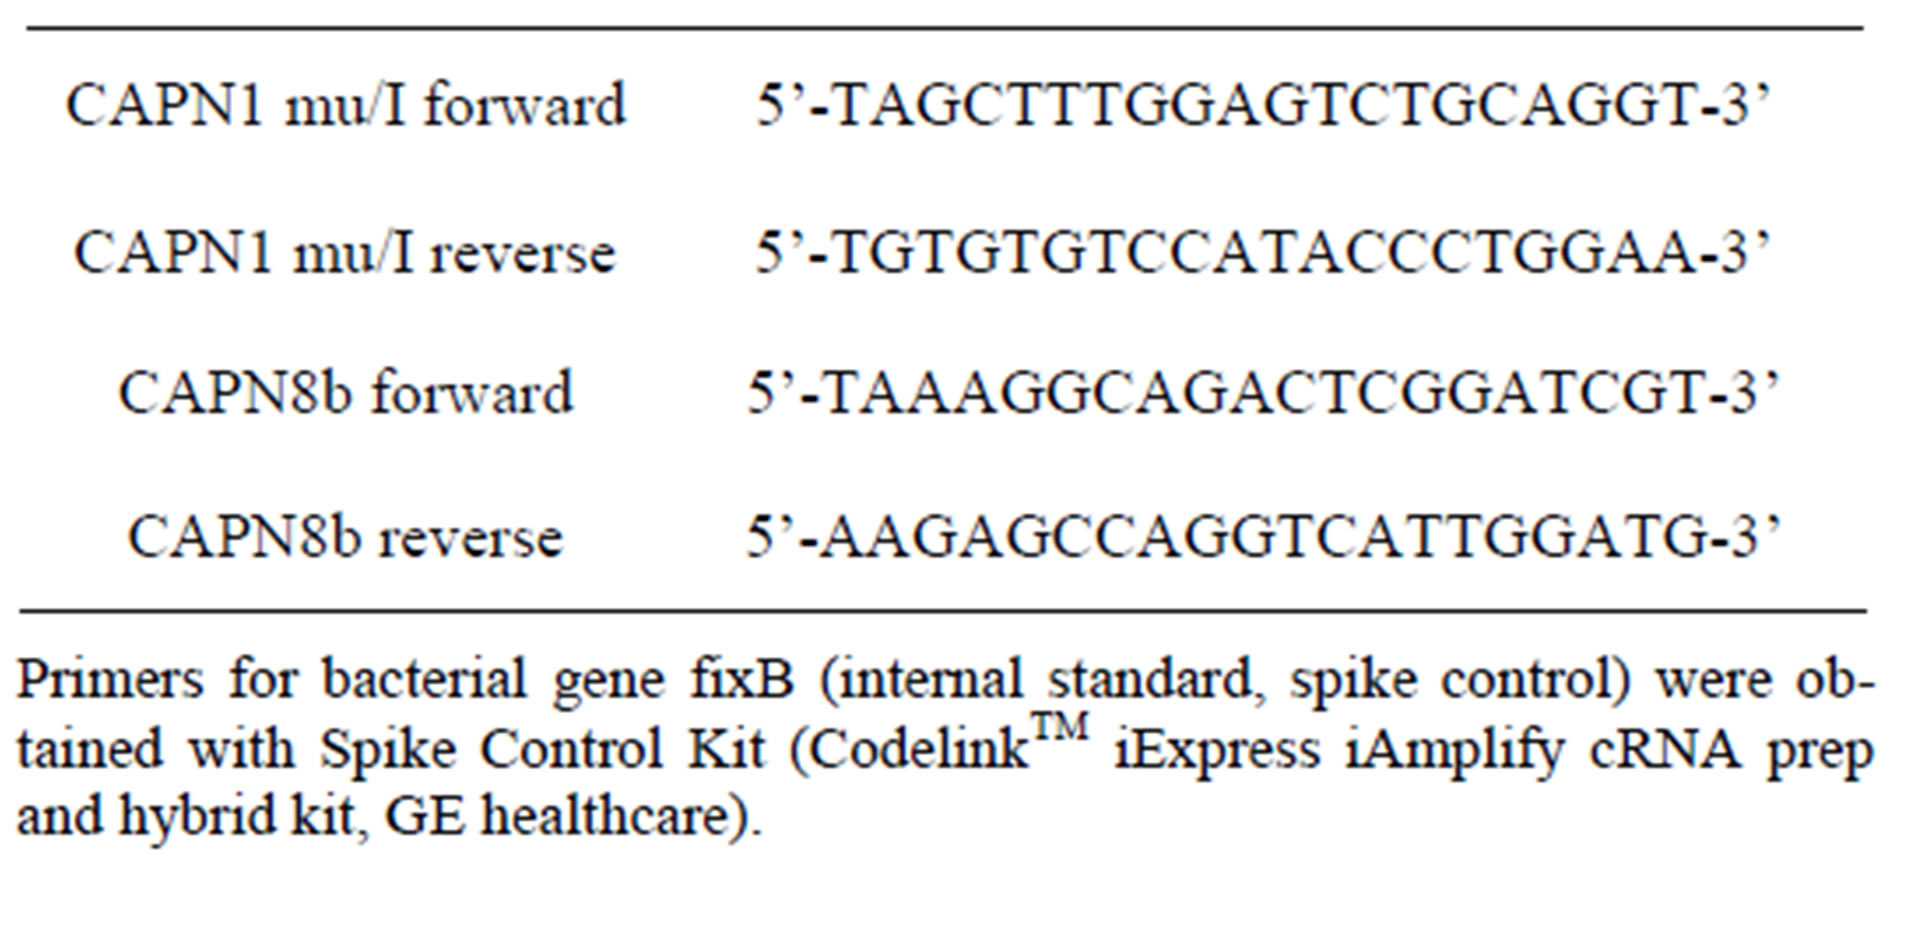
Table 1. Primers for qPCR detection.
ing point (Cp) values obtained by the lightCycler® Software. Results were calculated as the target/reference ratio of the sample divided by the target/reference ratio of the calibrator. This corrected for sample in homogeneity and variability of detection.
Accession numbers of all sequences used in this study are given in Table 2.
3. Results
3.1. Quantification of Total RNAs
Amount of total RNAs per embryo in the course of early Xenopus laevis embryogenesis stayed stable up to about stage 36 (tailbud). A decrease was then observed so that the amount of total RNAs at stage 48 was about two-and-half times lower than that at earlier stages. Then the amount of total RNAs began to increase to a maximum at stage 58 (Figure 1).
RNA integrity was estimated using AGILENT RNA 6000 Nano kit on an Agilent 2100 Bioanalyzer. The method provided total RNA extracts of good quantity and quality (Figure 2).
3.2. Expression Pattern of CAPN8b and CAPN1 (mu/I) during Development. Temporal Expression during Embryogenesis
Using real time PCR, which is currently the most sensitive and reliable technique for quantitative mRNA analy-
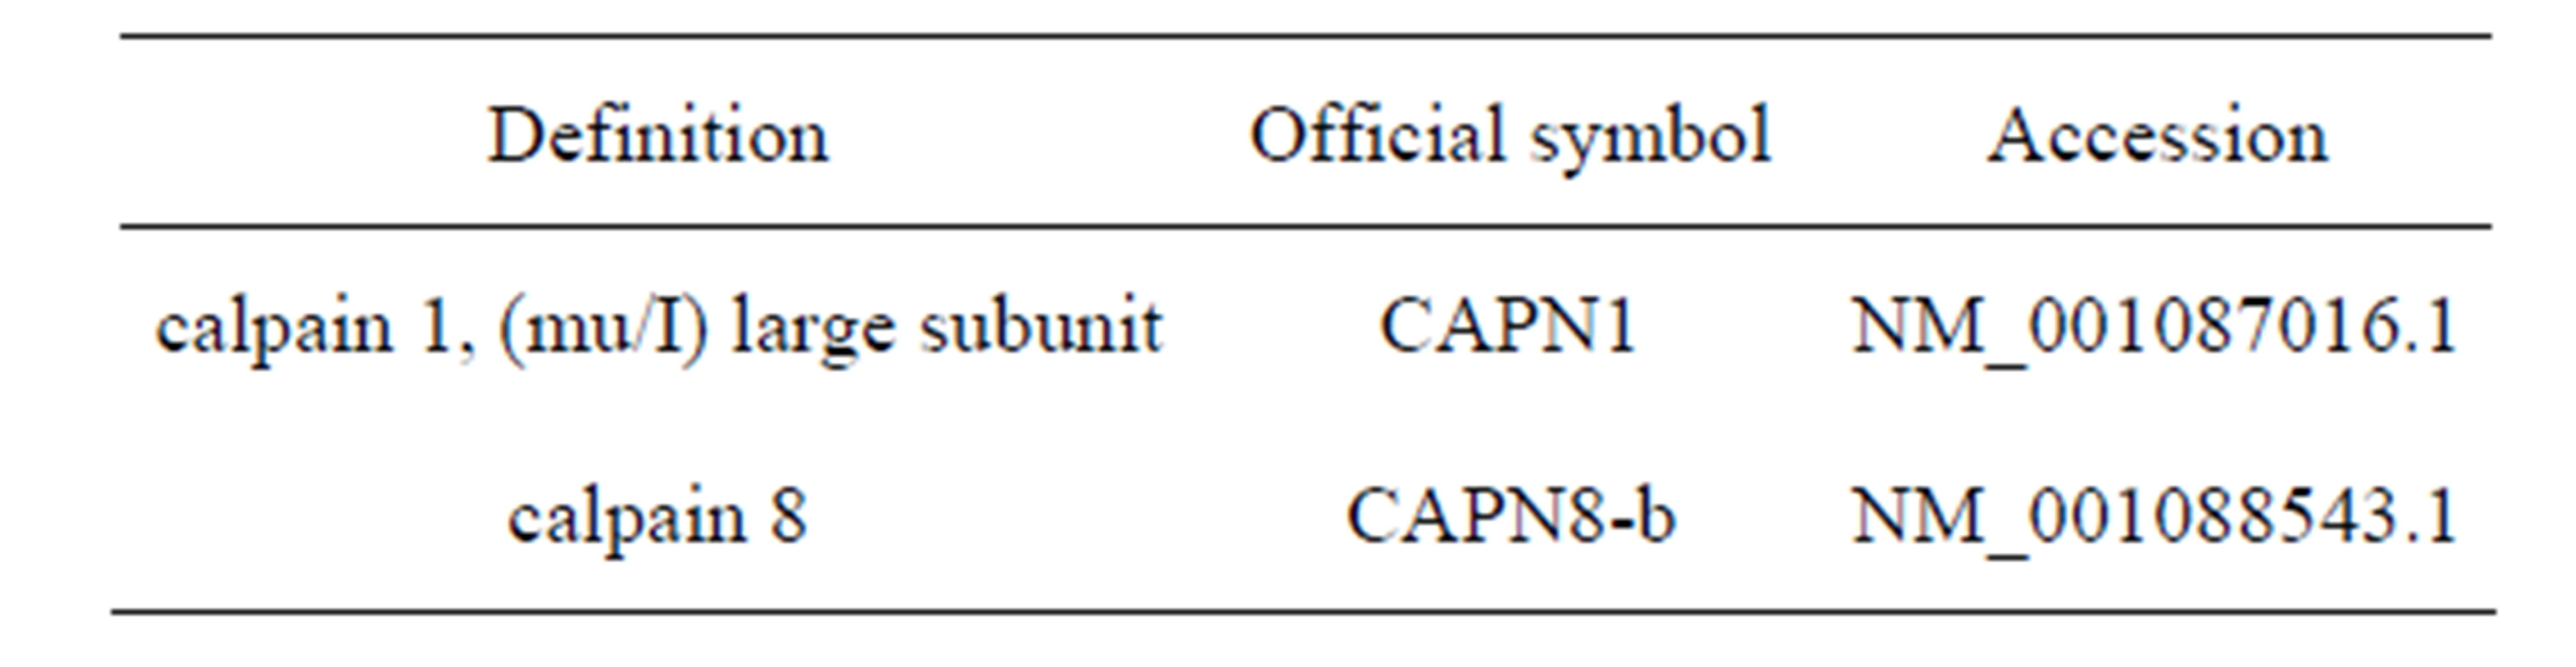
Table 2. Accession numbers of sequences used.
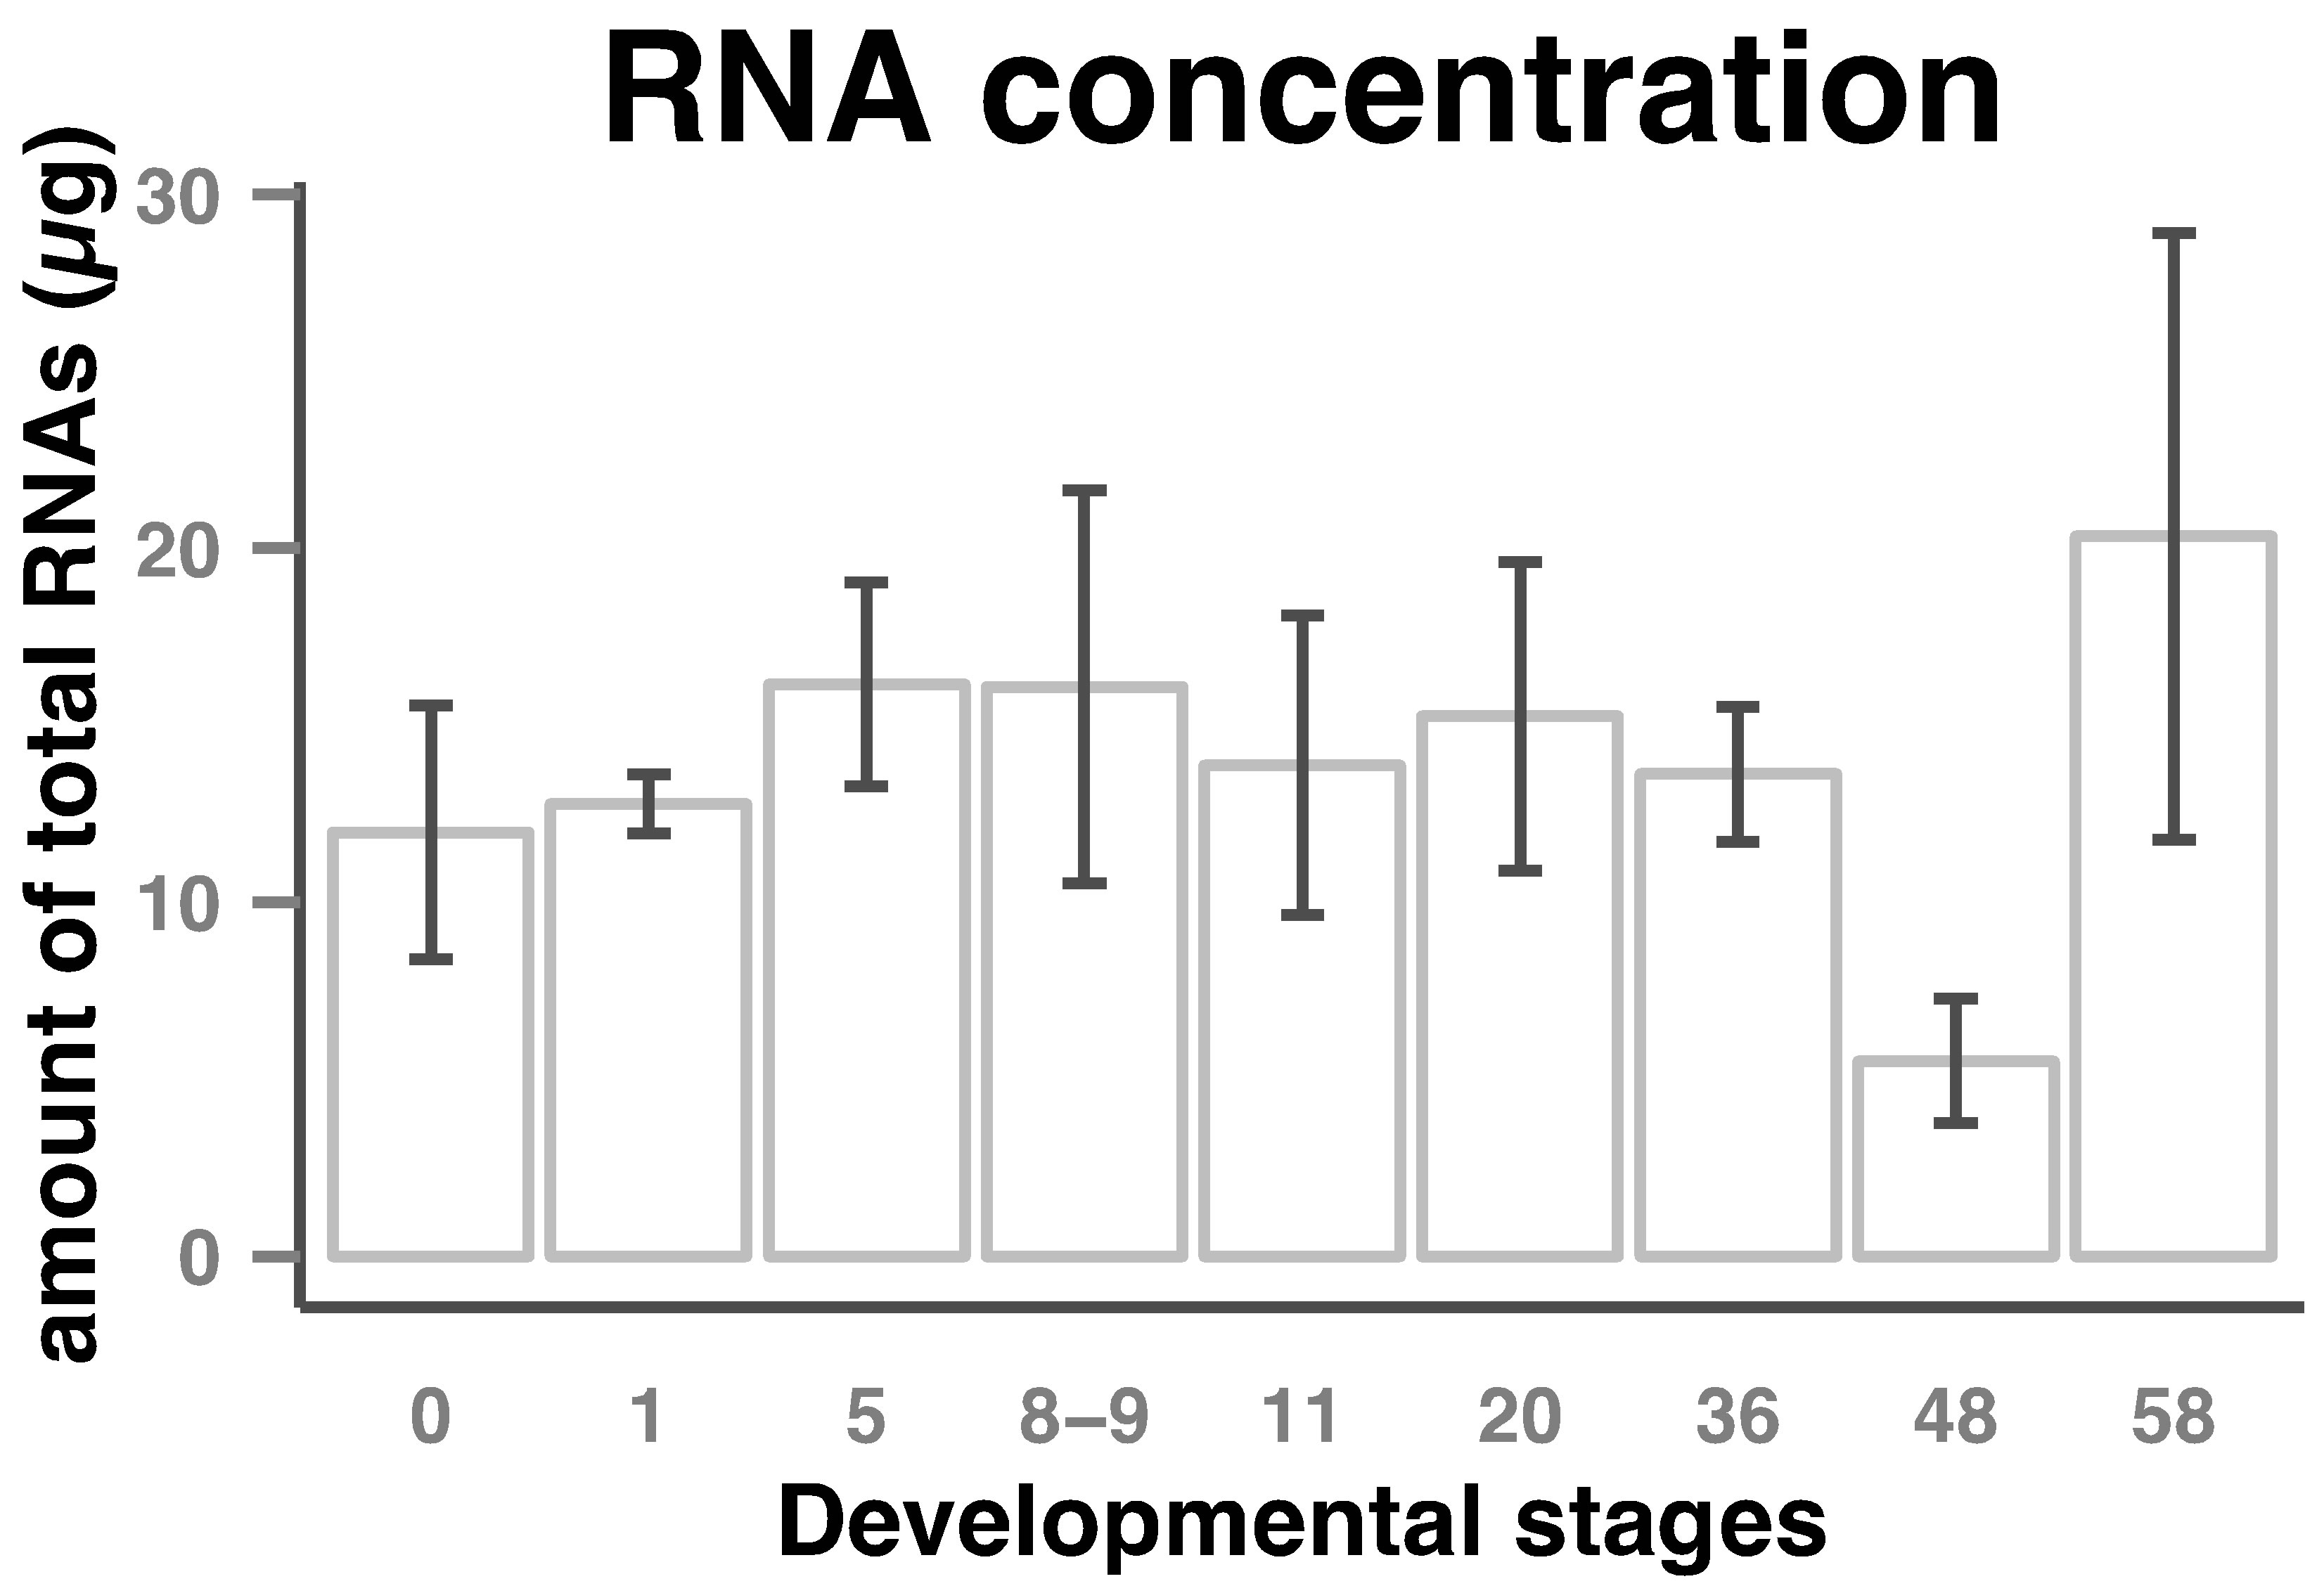
Figure 1. Total RNAs amount in Xenopus laevis early developmental stages. RNA was extracted from eggs/embryos and diluted to 30 µl as described in the Materials and Methods section. Amount of total RNAs (columns) per embryo and standard deviations (bars) from 3 or 4 sets of eggs/embryos from stages indicated on the horizontal axes are shown.
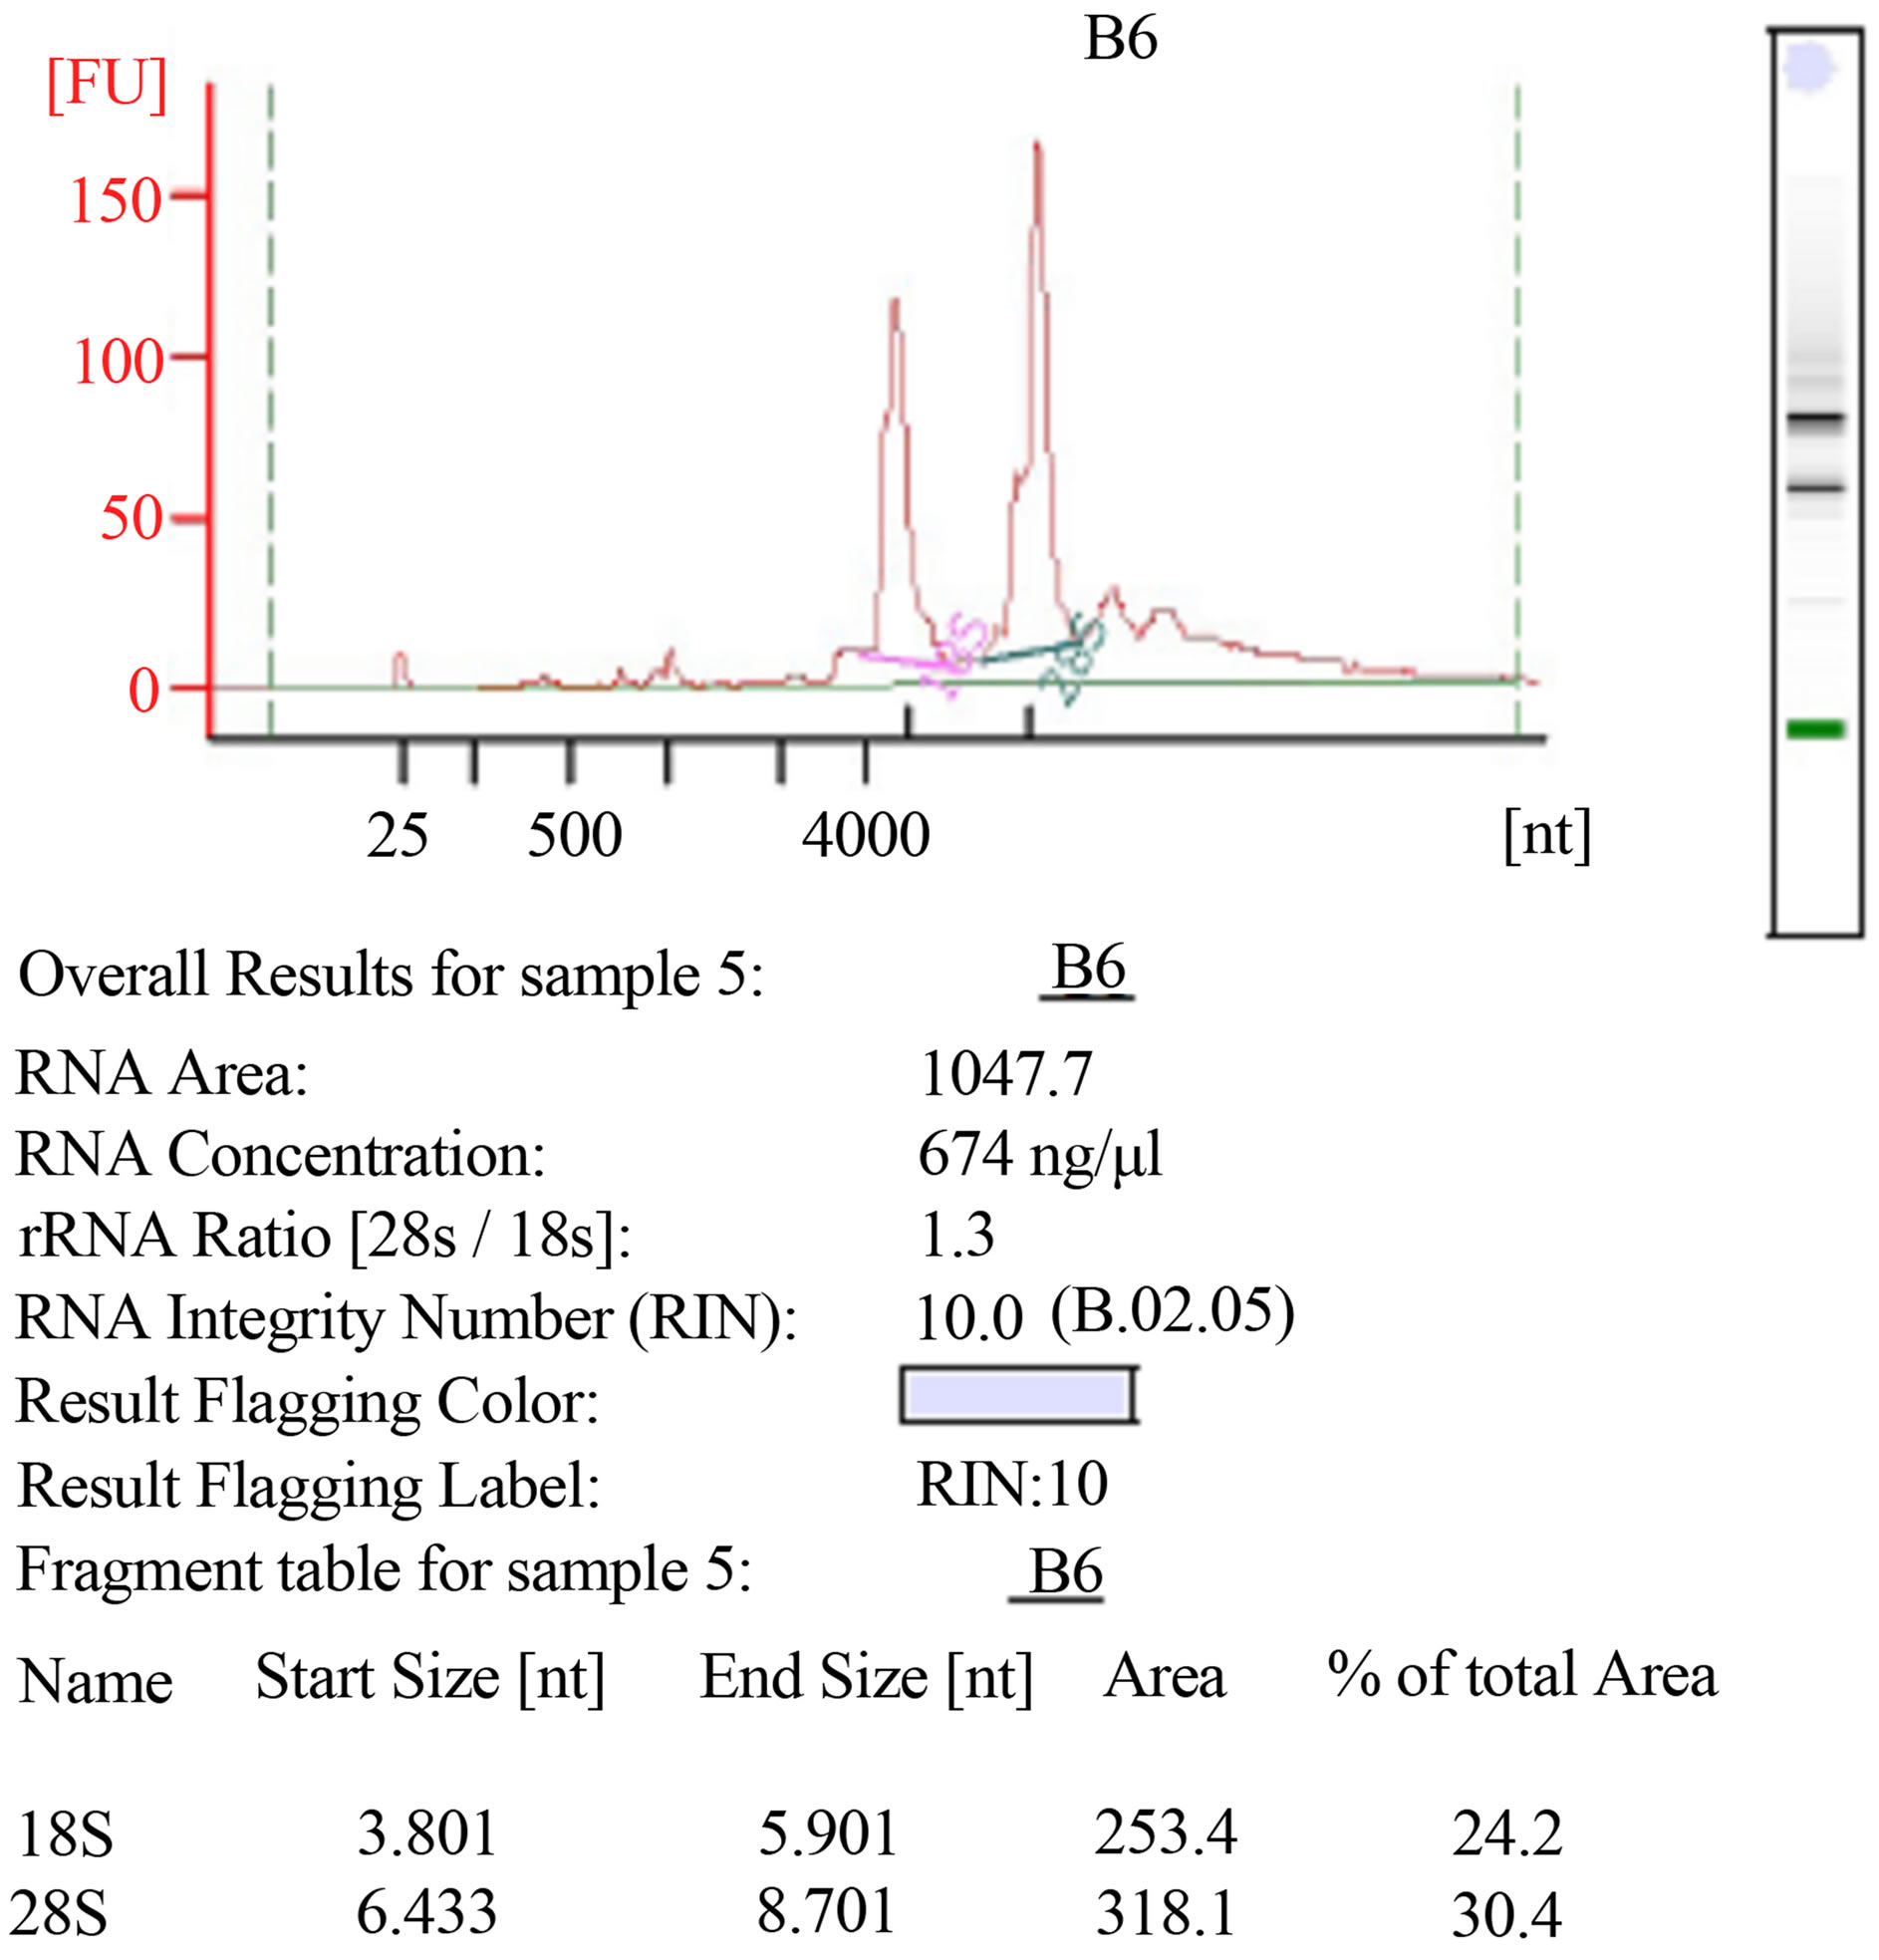
Figure 2. RNAs integrity using AGILENT RNA 6000 Nano kit on an Agilent 2100 Bioanalyzer (Agilent technologies).
sis, the expressions levels of both two calpain genes have been examined and compared during the period of early development of Xenopus laevis. The quantitative expression of CAPN8b and CAPN1 (mu/I) mRNAs determined by RT-qPCR during the period of early development of Xenopus laevis (9 developmental stages) are shown in Figure 3.
CAPN1 (mu/I) mRNAs were already detectable in Xenopus one-cell embryos, contrary to CAPN8b mRNA. Following fertilization, the levels of two mRNA stayed stable up to about stage 8 (blastula). Then, the level of two transcripts began to increase to a maximum. It was reached at stage 22 - 43 for RNA CAPN1 or 13 - 21 for RNA CAPN8b. The CAPN1 (mu/I) and CAPN8b mRNA levels gradually decreased up to about stage 58, the last stage tested in this study. The levels of CAPN8b mRNA were kept about 10 times greater than was the level of CAPN1 (mu/I) mRNA from gastrula until the metamorphosis.
4. Discussion
This is the first extended report of quantification of total RNAs within the developmental stages of Xenopus laevis. The quantification of total RNA profile presented here complements and correlates the partial quantification data previously published [20]. A light decrease of the concentration of total RNA was observed at stage 11 (gastrula) and was positively associated with a maternal cell death program which is set up at fertilization and abruptly activated at the onset of gastrulation (10.5) [21]. The second wave of apoptotic cell death has been recog-
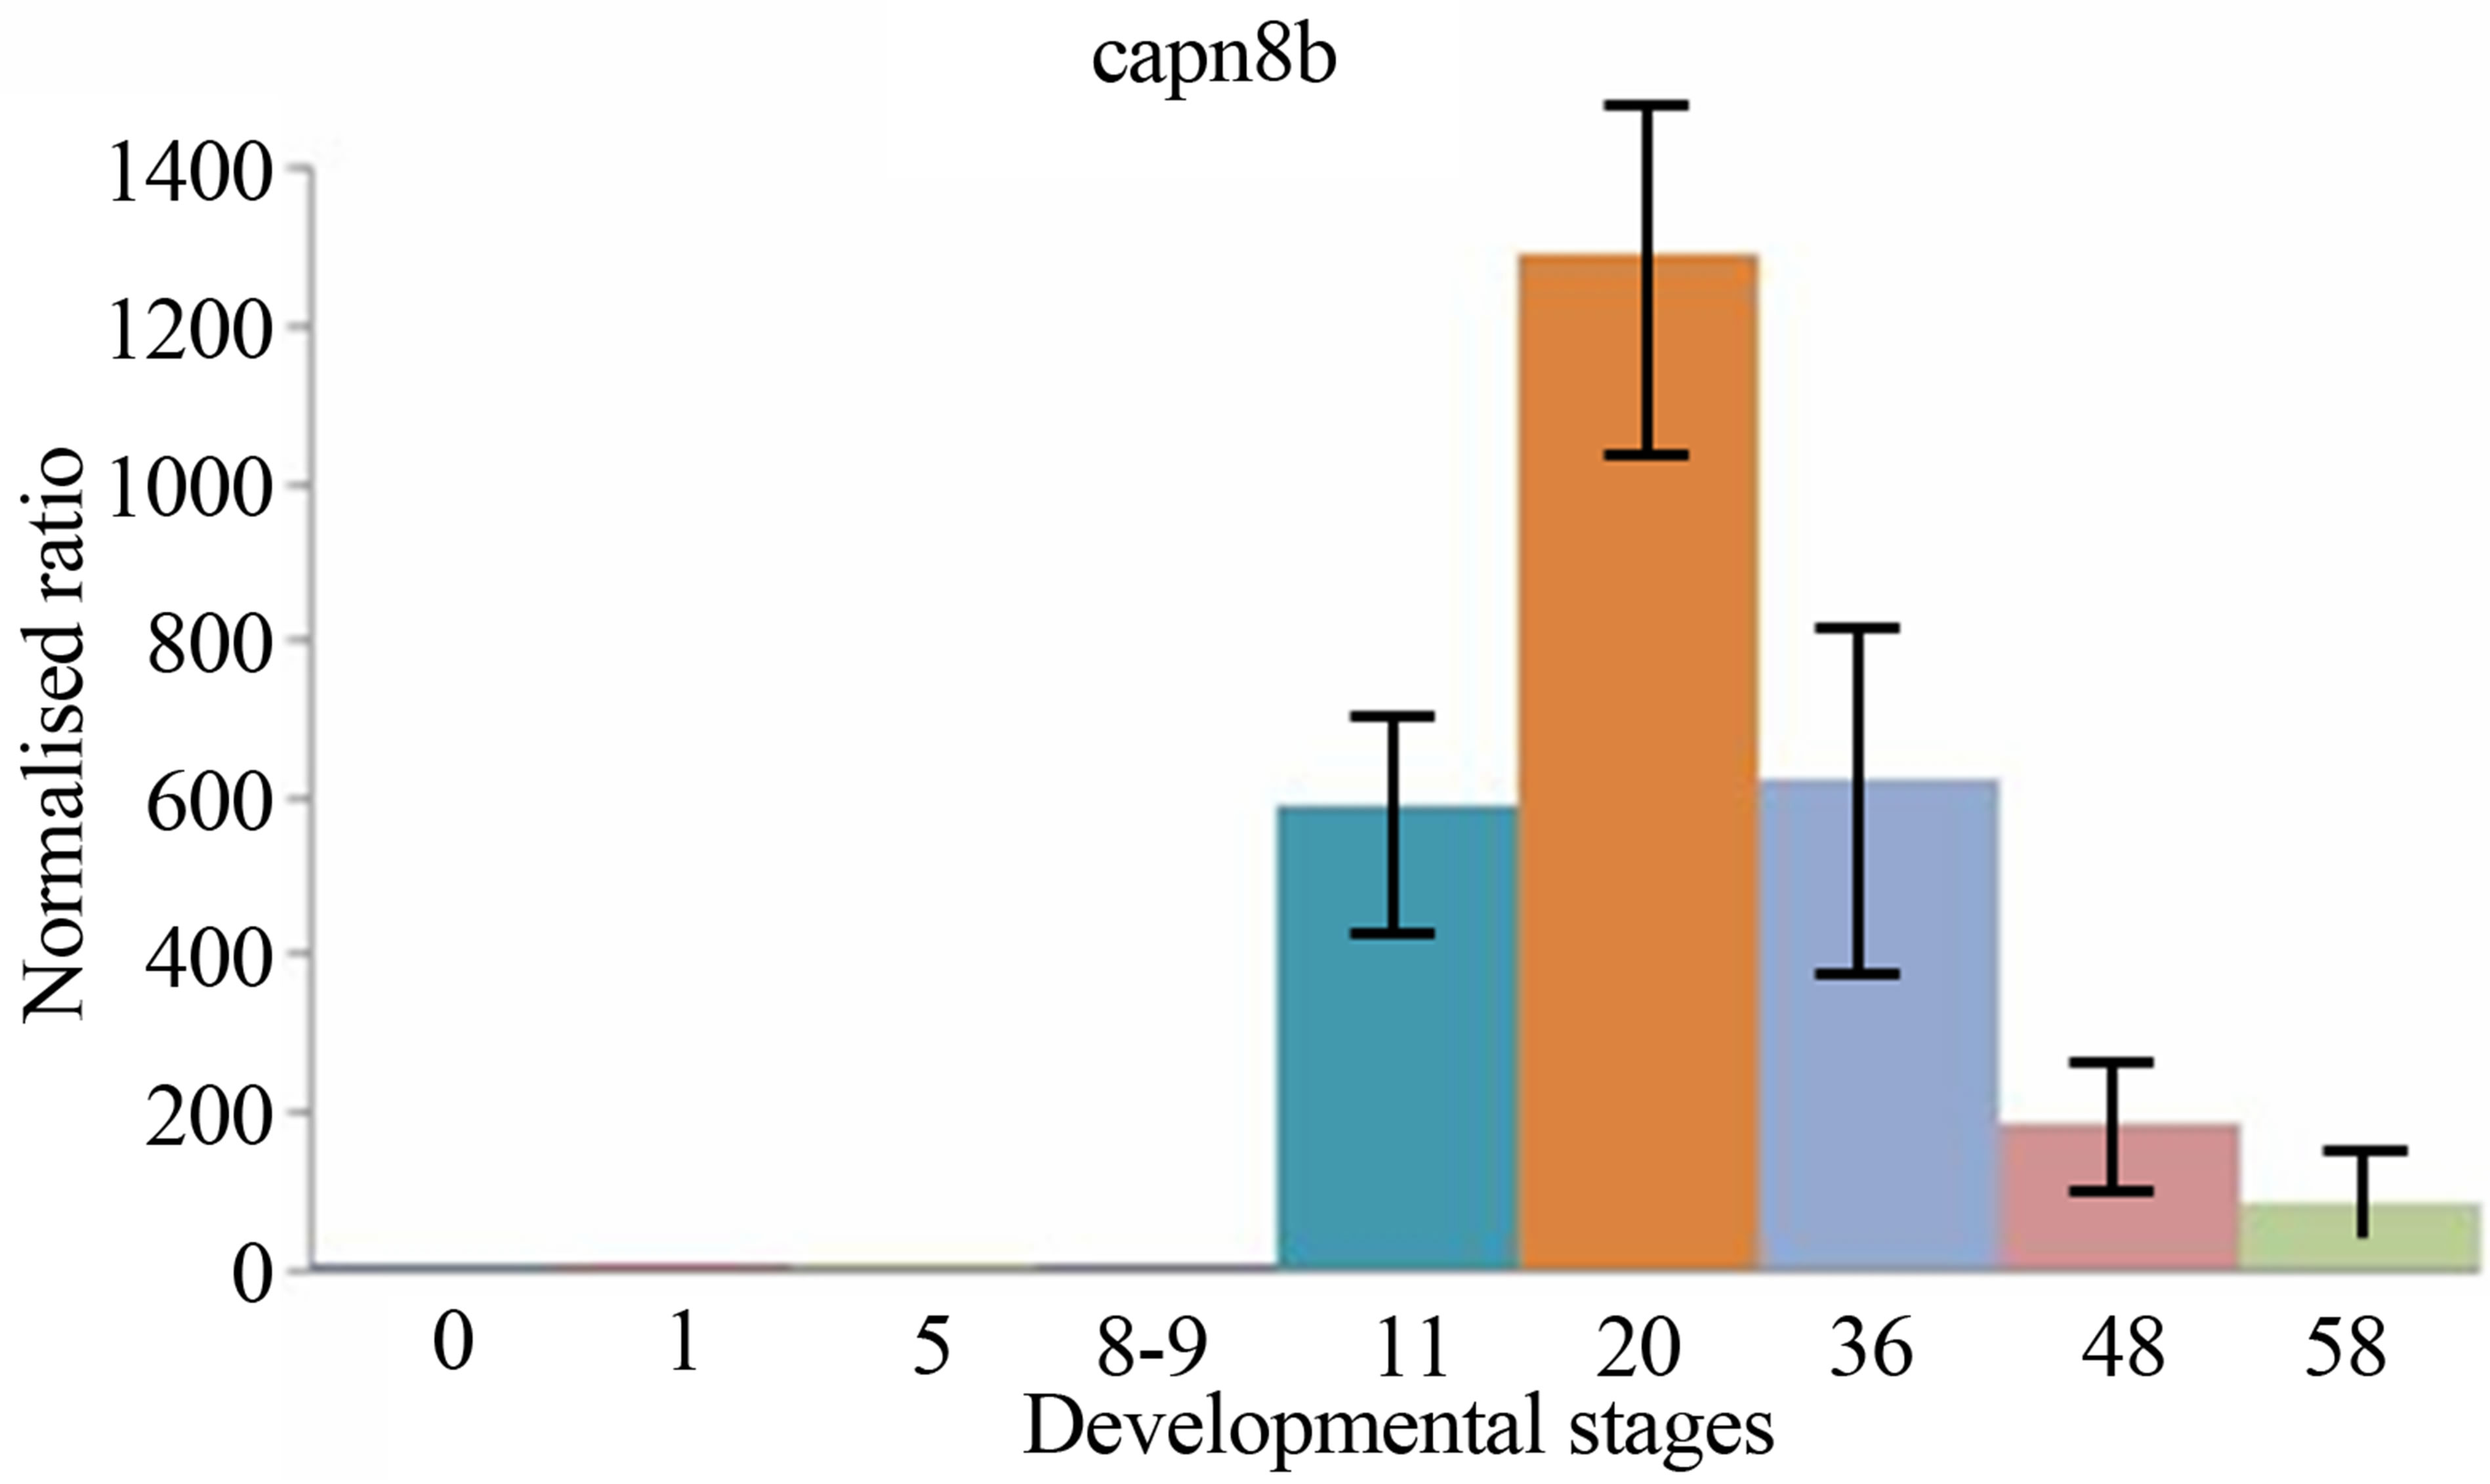
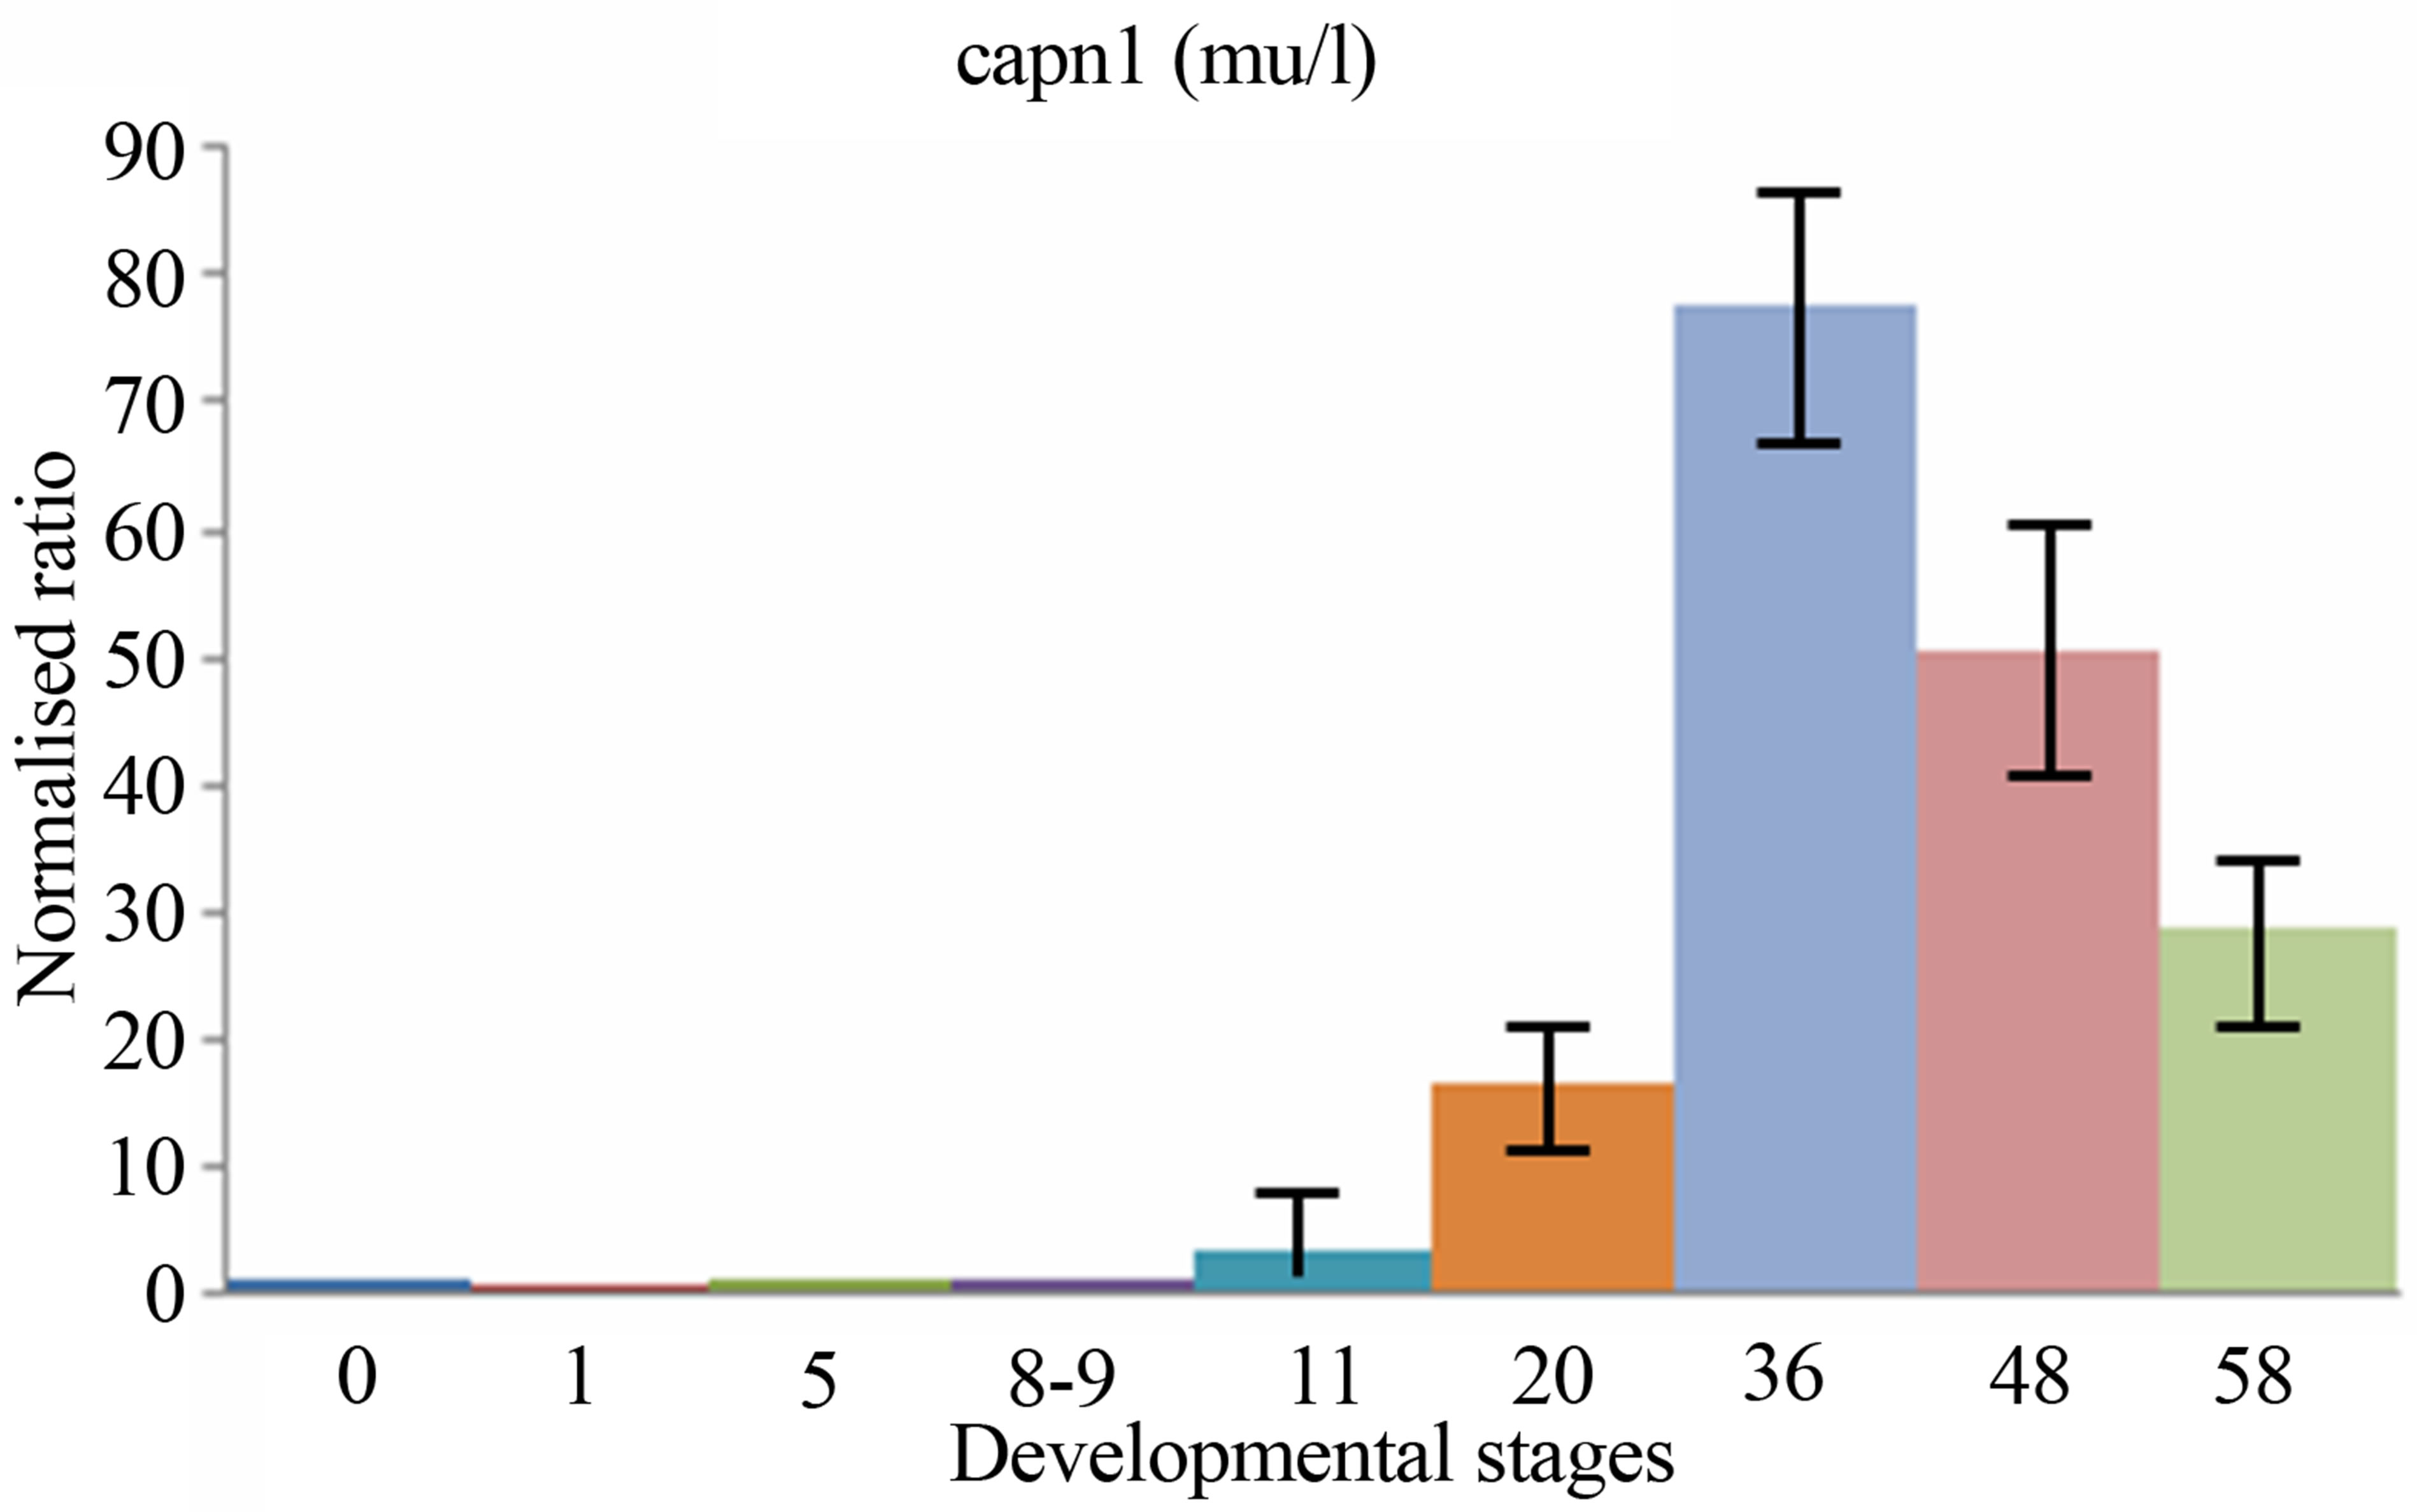
Figure 3. The mRNA expression profiles of Xenopus laevis CAPN1 (mu/I) and CAPN8b genes, normalized to total RNA and stage 0 (unfertilized eggs) and expressed in arbitrary units. The numbers on the vertical axis represent the ratio between the average amount of copies of a mRNA at a particular developmental stage and stage zero normalized to the same amount of input RNA (means ± SD, n = 3 replicates). The numbers on the horizontal axis represent the Xenopus developmental stages determined according to Niewkoop and Faber [19].
nized to occur throughout neurogenesis (stages 13 to 21) [22] and was correlated with a light increase of total RNA. Stages 35 to 46 represent the end of morphogenesis leading to the development of organs necessary for free floating life. A significant decrease of the concentration of total RNA was introduced at stage 36 to stage 48 and was positively associated with a large wave of apoptotic cell death in several organs (ectoderm, digestive tracts, somites) [23].
qPCR data are frequently normalized by one of several options, including the expression of reference genes, number of cells, weight of tissue, DNA/RNA spike and total RNAs concentration. The RT-qPCR normalization of mRNA expression patterns to reference genes such as ODC, GAPDH, EF-1α, H4 or L8, widely used in Xenopus RT-qPCR experiments, is not particulary suitable, because their levels vary during Xenopus development. The normalization to total RNAs is more appropriate [20]. Therefore, the mRNA expression profiles of CAPN8b and CAPN1 (mu/I) in stage series were normalized to total RNA of each embryonic stage and to stage 0, and are presented in arbitrary units. This is the first report of quantification of mRNAs CAPN8b and CAPN1 (mu/I) within the developmental stages of Xenopus laevis by qPCR.
The CAPN1 (mu/I) mRNAs were expressed maternally contrary to CAPN8b mRNA. Expression of these two genes was remained at a constant level until the onset of gastrulation. CAPN1 (mu/I) and CAPN8b genes display distinct embryonic specific expression patterns, suggesting potentially different developmental roles for these tow genes, during amphibian early embryogenesis.
The levels of two transcripts then started to rise again obviously as a result of zygotic expression. Zygotic expression of CAPN8b mRNA was detectable greatly at stage 11 (gastrulation) and its level of expression increases until stages 13 - 21 (neurulation). Zygotic expression of CAPN1 (mu/I) mRNA was detectable weakly at stage 11 (gastrulation) and its level of expression increased until stages 22 - 43 (tailbud). The CAPN1 (mu/I) and CAPN8b mRNA levels gradually decreased up to about stage 50 (metamorphosis), without nevertheless reached to maternal levels.
While the separate expression patterns of CAPN1 and CAPN8b genes particularly highlight similarity in their expression profiles in the course of early development, we observed quantitative differences in the expression of these genes. The levels of CAPN8b mRNA were kept about 10 times greater than was the level of CAPN1 (mu/I) mRNA from gastrula until the metamorphosis.
The CAPN8b temporal expression profile presented here complemented the partial CAPN8b expression data previously published [17] and also corroborated very well with the RT-PCR expression analysis described in [17]. The temporal expression profile of CAPN8b transcripts determined by RT-qPCR was consistent with the spatial expression of XCL-2 examined by whole-mount in situ hybridization and described in [17]. Signals were first detected in the area close to the ventral blastoporal lip at stage 12.5 (gastrula). In late gastrulae and neurulae, XCL-2 gene was expressed exclusively in the ventral circumblastoporal collar and the mesoderm-free zone at the most anterior tip of neural fold where the stomodeum and cement gland form. From the late neurula stage, it was expressed significantly in the cement gland and proctodeum, and after stage 34, expression was only found in the cement gland.
The temporal expression of CAPN1 (mu/I) and CAPN8b transcripts determined by RT-qPCR was correlated with the temporal expression of calpains 1 and 2 examined by immunohistochemistry with antibodies directed against human isoforms and described in [14]. Calpains expression was weak in the early stages, strong between neurulation and growth period and decreased in the second part of metamorphosis. The mRNA expression profiles of CAPN8b and CAPN1 (mu/I) were correlated with the expression of calpains. The high expression of mRNA and calpains between the gastrulation and the metamorphosis suggest their fundamental role in organogenesis and at the onset of metamorphosis. Our data suggest that CAPN1 (mu/I) and CAPN8b are a prerequisite for morphogenetic movements during embryogenesis in Xenopus laevis.
The temporal changes in gene expression are a key mechanism in embryo development. Three major changes in the cellular activities take place at the midblastula stage (just after 12 cleavages). This midblastula transition (MBT) was assumed to involve the coordinated initiation of transcription, acquisition of cell motility and lengthening of cell giving rise to G1 and G2 phases [24].