Using Capillary Pressure Derived Parameters for Improving Permeability Prediction ()
1. Introduction
As I noted earlier the majority of permeability estimates obtained from capillary pressure curves are derived from two fundamental theories, percolation length models and poiseuille models. Poiseuille theory attempts to treat the flow paths of rocks as a bundle of tubes with various pore diameters. The complexity of a rock system doesn’t necessarily lend itself to the bundle of tubes model. However, many authors have introduced the scaling factors into poiseuille theory that treats variable pore throat distributions and tourtousity as calibration constants.
The primary distinction between percolation and poiseuille models for permeability is that for the poiseuille application, the flow paths within the reservoir rock are mathematically formulated (exactly), and the random nature of the rock is reconciled by introducing experimentally derived tuning factors.
All the models for permeability estimation use the simple relationship between Hg-air capillary pressure (Pc), interfacial tension σHg-air, contact angle θHg-air, and pore throat entry radius (R) first proposed by Washburn in 1921 [1];
 (1)
(1)
where: R = pore throat radius in μm;
σHg-air = interfacial tension between mercury and air in dyn/cm;
θHg-air = contact angle between mercury and air in degrees (typically 140 degrees);
Pc = capillary pressure between the Hg and air phases in Psia.
The fundamental relationships between pore size/geometry and basic rock properties (e.g., effective porosity, absolute permeability, etc.) are well documented in the petroleum and petrophysics literature. Moreover the literature is replete with various models, methodologies, and data sets, all of which have been applied to the practical problem of estimating or predicting permeability from basic rock properties obtained from capillary pressure for a variety of rock types. Nelson [2] has developed a comprehensive review of the literature, and he has identified five major categories of permeability models based on the physical rock attributes used in the model development: the five major model categories specified by Nelson are:
1) petrophysical model, 2) models based on grain size and mineralogy, 3) models based on surface area and water saturation, 4) well log models, and 5) models based on basic rock pore dimensions.
In this paper, I focus on models that incorporate basic rock pore characteristics and dimensions, and specifically pore characteristics as determined from capillary pressure data. Nelson has further classified these particular models as direct types, since they not only relate rock permeability directly to the pore dimensions and connectivity, but also incorporate fundamental theories of fluid flow through porous media. Most of these direct methods, especially the early models, were developed in the 1940s and 1950s-use mercury-injection capillary pressure data to quantify the rock pore and pore throat characteristics.
Although the physical basis for the existing direct models is similar, I have observed varying results (even inconsistent) among the various theoretical models. The primary motivation for my work is to “close the loop” on relating mercury injection capillary pressure data and the simplified “bundle of tubes” permeability power law model by Brook and Corey, and is extended to incorporate the permeability model proposed by Huet-Blsingame [3] using the theory of Purcell [4] and Burdine [5], combined with the function fitting parameters of Brooks and corey [6] and Nakornthap and Evans [7] to determine the absolute permeability from MICP.
Consequently, the principle objective of this work is to develop and document a universal model which provides a more consistent correlation of permeability with mercury capillary pressure data for a much wider range of rock types. I begin with a review of the most important models developed previously and I then document the validation of our generalization of the Huet and Blasigame K (Hg) model.
2. Material and Methods
Methods Derived from Poiseuille Theory
1) Brooks and Corey’s λ (1966)
Pore-throat size distribution is an important property of porous media. It affects both permeability and capillary pressure. Several variables have been proposed to quantify this property (Archie, 1950 [8], Jennings, 1987 [9], Thomeer, 1960 & 1983 [10,11], Brooks and Corey, 1966 [6]). Among these variables, Brooks and Corey’s λ (1966) and Thomeer’s Fg (1960, 1983) are the most popular.
Brooks and Corey (1966) found that drainage capillary-pressure curves can be approximated by a powerlaw relationship:
 (2)
(2)
where S* is normalized, wetting-phase saturation, called “effective saturation”, which is expressed as:
 (3)
(3)
where Swir is irreducible water saturation.
The λ in Equation (2) is called “pore-size distribution index”. It controls the slope of a capillary pressure curve. Larger λ values usually have gentle curves, while smaller λ values usually have steeper curves. The λ typically is obtained by fitting the experimental data with the leastsquares technique. It is the negative slope of the points on a log-log plot of S* vs. J-function. The J function needed to calculate λ is a dimensionless number originnally developed by Leverett (1941) [12].
To synthesize capillary pressure curves with Equation (2), λ must be estimated. The λ is measured directly from the best-fit line drawn through the data points on a log-log plot of S* vs. J-function. The negative slope of the fitted line is λ. According to Brooks and Corey (1966) [6], porous media having narrow pore-throat size distributions (well sorted) tend to have large values of λ, while porous media having wide pore-throat size distributions (poorly-sorted) tend to have small values of λ. If this assumption is correct, then λ should be correlated with other variables, such as permeability and irreducible water saturation, since these variables are sensitive to porethroat distribution. A plot of Brooks and Corey’s original data shows no relationship between λ and these two variables.
2) Huet-Blasingame Method (2005):
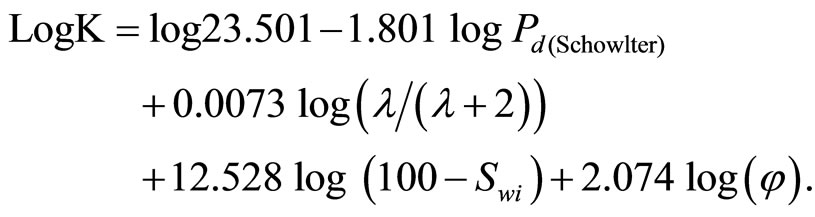
Huet-Blasingame [3] use the underlying theory of Purcell and Burdine, combined with the function fitting parameters of Brooks and Corey and Nakornthap and Evans to determine the absolute or Klinkenberg-corrected permeability from MICP [13]. Their dataset includes a variety of rock types spanning a wide range of permeability (0.0041 - 8340 mD) and porosity (0.003 - 0.34). The Huet-Blasingame implementation requires first that the capillary pressure curve be modeled according to the power law relationship of Brooks and Corey Equation (1)
Huet and Blasingame use the terms “displacement pressure” and “threshold pressure” interchangeably, although the physical meanings of each have been specifically defined by Pittman. Displacement pressure is the pressure at which mercury first enters the sample, regardless of its interconnectivity.
Schowalter (1979) [14] used a 10 percent mercury specification as a pragmatic measure of displacement pressure, particularly in seal rocks. Special care must be taken to ensure a conformance correction is taken into consideration which discounts any “apparent” intrusion of mercury into the sample due to surface vugs and/or irregularities. For clarity, the threshold pressure as first defined by Katz and Thompson (1986 & 1987) [15,16] and further illustrated by Pittman (1992) [17] is defined as the pressure at which mercury first forms a connected filament across the span of the sample. The threshold pressure corresponded graphically to the inflection point on a mercury injection plot.
Huet-Blasingame further related permeability to the curve fitting parameters of Equation (1) by:
 (4)
(4)
My intension was to qualify the performance of Huet and Blasingame method using the log-log correlation plot-specifically, the perfect correlation (i.e., the 1:1 trend) as well as the 2.5 factor trends. I used this envelope to assess goodness of fit between the measured permeability and calculated one from the used permeability model.
My data set is comprised of 202 whole core plug samples representing sand and limestone formation from different basins within the Egypt. The range of porosity and permeability is 1.8 to 39.9 percent and 0.003 to 5341 MD, respectively. The diverse composition and the variable texture of the sandstones suggest this should be a representative sample set for reservoirs. A graphical and statistical analysis system multiple regression program was used to establish various empirical relationships.
3. Results and Discussion
1) Correlation of different petrophysical parameters
My initial calibration process was performed to estimate the displacement and critical capillary pressure (Pd), irreducible wetting phase saturation, the index of pore size distribution (λ), effective porosity, Winland (R35) and calculating the permeability value on a sample by sample basis using the Huet and Blasingame and BrooksCorey Pc (Sw) model.
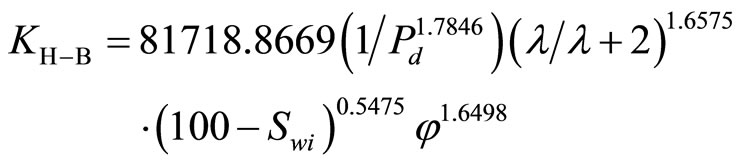
Figure 1 shows the directly relationship between permeability and estimated Pore geometry index (λ) of Brook and Corey’s method. The directly relationship indicates wide spectrum of pore throat size distribution (poor sorting) at low values of λ thus the rock will obtain low permeability values which are also function of pore throat size distribution and vice versa. The Brook and corey’s method provides its best correlation to sample measured permeability above 0.1 md. However, for samples data below 0.1 md, the points become scattered and
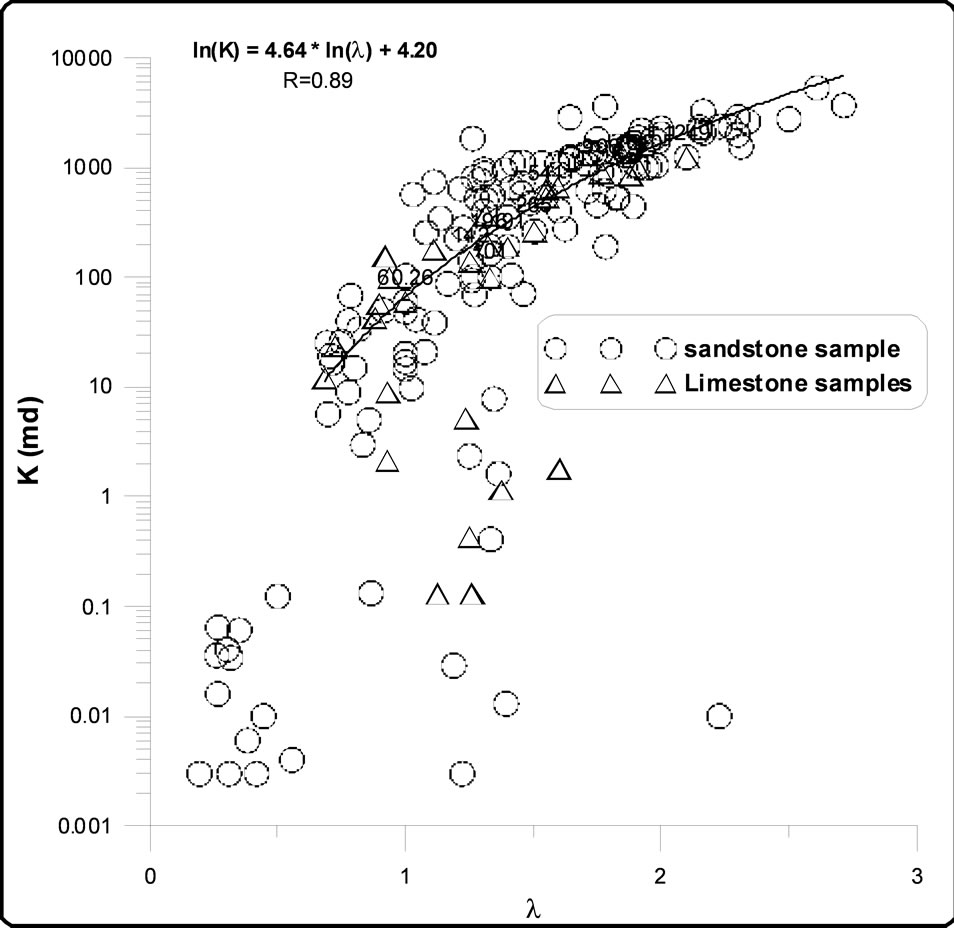
Figure 1. The relationship between pore geometry index and permeability for the all studied samples.
correlation turn very weak. The Brook and Corey’s method suffers up to an order of magnitude of error and suggest, at least for this case, that the Brook and Corey’s method may not be applicable. Our defends using this wide permeability range despite the fact that the original equation of Brook and Corey is not tailored specifically for low permeability rocks because of the inherent uncertainties at the time of accurately measuring permeability below 0.1 md. This indicates that the two parameter are affected more by macro porosity than micro porosity I present my results as log-log crossplots of calculated permeability using Huet and Blasingame versus measured permeability in Figures 2 and 3 where the displacement pressure used for Huet and Blasingame method is estimated using Schowlter and KatzThampson assumptions respectively. For guidance high and low dashed trend line which represent a variance factor of 2.5. The graph provides a visual orientation as to the accuracy of permeability estimation method. Data points which lie within the envelope are considered as an acceptable match. Using the Katz and Thampson (Pd) improves the accuracy and precision of the Huet and Blasingame’s method and gives better match to measured permeabilities of our data set than Scowlter assumption which overestimates it. This is because Schowlter consider only a single capillary pressure point while, permeability overestimation occurs to a lesser degree for the Katz and Thampson and Huet and Blasingame assumptions due (most likely) to the use of a Klinkinberg (slippage corrected) air permeability values as standard in the development of these methods. So using Schowlter
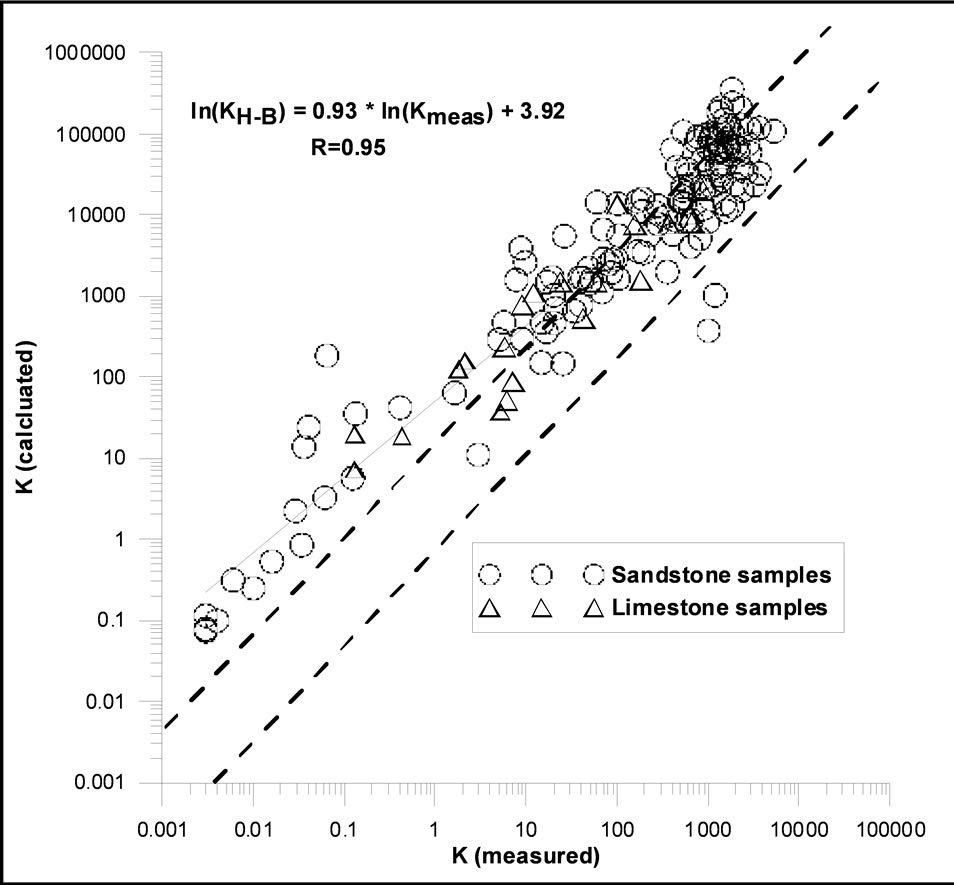
Figure 2. Comparison between calculated (Kc) and measured (Km) permeability. The upper and lower dashed lines represent the range of 0.25 < Kc/Km < 4 (Calculated from Huet and Blasingame, 2005).
Figure 3. Comparison of the MICP-based permeability estimated using Huet-Blasingame method to themeasured (Km) permeability. The upper and lower dashed lines represent the range of 0.25 < Kc/Km < 4 (Calculated from Huet and Blasingame, 2005).
assumption will affect on the accuracy of the Huet and Blasingame and overestimate the absolute permeability using MICP measurement—obviously because of gas slippage effects. The Katz-Thampson (Pd) yields good precision of the results for permeabilities above 2 md and below 0.7 md, but the method has poor accuracy between these values. This performance in Huet and Blasingame model may be due to interpretation in fitting the capillary pressure curve, as well as the fact that Huet-Blasingame used a data set which was not optimally populated (our data set contained a very large variation in sample permeabilities). It is clear that additional work is required to improve both the accuracy and precision of this method for estimating permeability using MICP tests on core samples.
Overall, the accuracy and precision of the mercury injection, capillary pressure based permeability correlations were lower than expected. Perhaps this performance could be due to our data sets employed in this study, but that seems less likely than the probability of issues with the method itself.
Figure 4 illustrates the relationship between measured permeability multiplied by pore geometry index versus effective porosity for all studied samples. The correlation indicates better precision above 0.1 md with good accuracy. Below this (Kλ) limit value the correlation lacks accuracy, which may account for the strong correlation between permeability and effective porosity and between pore geometry index and macro pore throat radius. Whereas, the scattering of data points below 0.1 md indicates significant degree of samples pore throat size heterogeneity and so weak correlation of λ.
Figure 5 shows the relationship between pore geometry indexes versus the sqrt (K/φ) for our studied samples. As pore geometry index is a measure of degree of pore sorting it shows positive strong correlation, increasing λ values will increase the homogeneity of pore throat radius values and so will sqrt (K/φ) values.
Figure 6 indicates the weak negative correlation between pore geometry index and irreducible water saturation estimated from capillary pressure curves of our

Figure 4. The relationship between Kλ versus effective porosity for the all studied samples.

Figure 5. The relationship between pore geometry index and sqrt (K/φ) for all studied samples.

Figure 6. The relationship between pore geometry index versus irreducible water saturation for the all studied samples.
studied core samples. The weak relation may be caused by the presence of other factors which has more affect on pore geometry index like permeability and pore throat. The inversely relationship because porous media having narrow pore throat size distributions (well sorted ) tend to have large values of λ and vice versa. So, λ should be correlated with irreducible water saturation since both are sensitive to pore throat distribution. But it seems that λ is mostly affected and measure macro pore sorting so will result relatively weak inversely correlation with Swi which is affected by presence of micro pores in the studied rock samples.
The permeability versus porosity time pore geometry index square (φλ2) for all studied samples are presented in Figure 7. The correlation performs quiet well above K value of 0.1 md with high correlation coefficient. The correlation become worse below this K value indicate that λ is a more function of macro porosity which give greater contribution to fluid flow, thus improve the relationship between K and φ.
The relationship between k λ and φ R35 values for our studied core samples are plotted in Figure 8. Visual inspection of this figure shows that the samples points are described very well by the best fit line with high regression coefficient determined for all the samples. This implies that within the limits of our data, it is reasonable with our obtained model to estimate the permeability of the reservoir. Because pore throat radius R35 and λ are closely related to macropores and quantifies the largest and best connected pore throats which mostly affect on reservoir fluid flow (permeability).
Figures 9 and 10 show the relationship between measured permeability versus pore throat radius estimated using schowlter and Katz and Thompson assumptions respectively. These figures show directly strong correlation with high correlation coefficient where R = 0.95. So, my data samples prove that, I can use the terms displacement pressure and threshold pressure interchangeably, although the physical meaning of each have been specifically defined by Pittman (1992). The strong correlations illustrate the forms of a connected filament across the span of the sample at these pore throat radiuses of our studied data set.
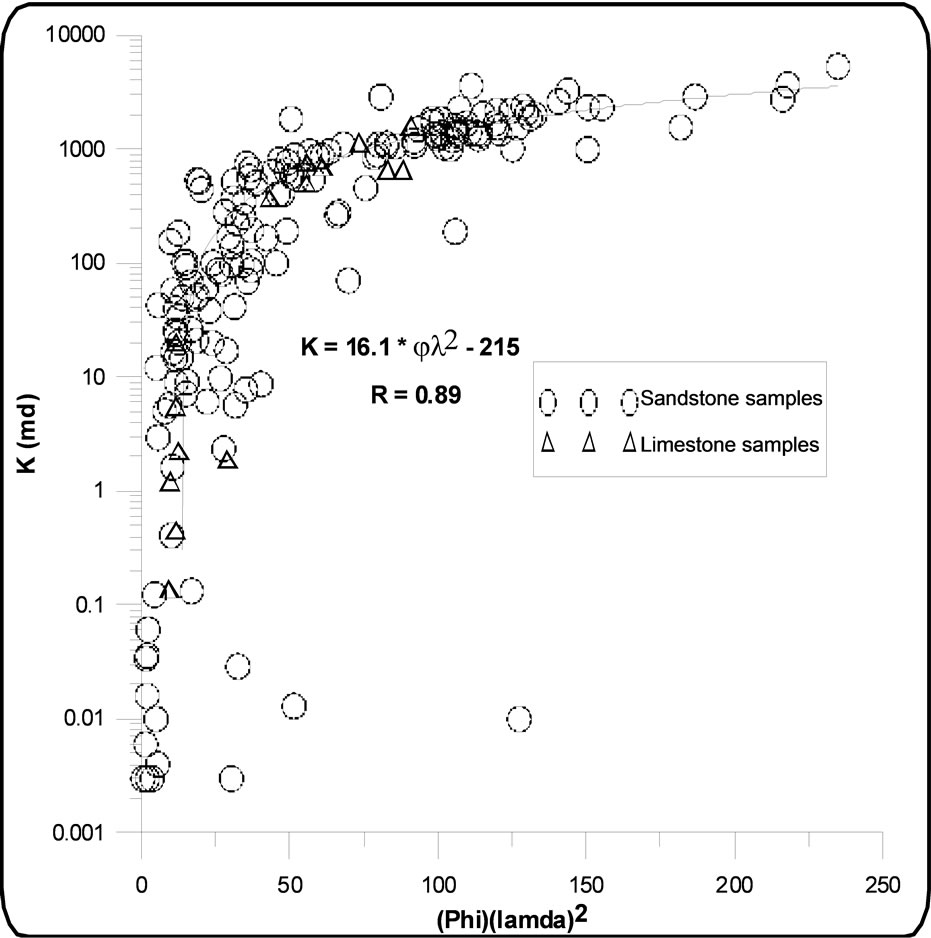
Figure 7. The relationship between measured permeability versus Phi time pore geometry index for all studied sandstone samples.

Figure 8. The relationship between (Kλ) and (R35.φ) for all studied samples.

Figure 9. The relationship between estimated pore throat radius versus permeability (Schowalter, 1979).
2) Development of new modified model
Using the relation of Huet and Blasingame I develop a base model to correlate permeability from capillary pressure data. The constants a1, a2, a3, a5 and a6 of our new general permeability equation can be determined through the use of calibration data set of cores and capillary pressure data. Here after, that Quantity will be referred to as the kernel. The coefficients a1, a2, a3, a5 and a6 should be adjusted to minimize the error in the prediction of K. The estimation of a1, a2, a3, a5 and a6 can be

Figure 10. The relationship between estimated pore throat radius versus permeability for all studied samples, (Katz and Thompson, 1987).
accomplished by fitting the data with an equation having the form of:
 (5)
(5)
Y values associated with permeability, X values associated with the kernel.
The constants C and n are determined through least square minimization or other suitable error minimization technique.
Providing measured porosity, fractional bulk volume occupied by non-wetting phase in the formation material at pressure Pc, infinite pressure Vb (P∞), pore size distribution index and displacement pressure derived from capillary pressure measurements of a formation material from a laboratory capillary pressure measured curves on core samples. Using the said parameters in empirically derived equation to predict permeability;
 (6)
(6)
Here after refereed to as the kernel.
Determining the coefficients a1, a2, a3, a4 and a5 by use of a suitable minimization technique; using a1, a2, a3, a4 and a5 in the Equation (6) so,
 (7)
(7)
for determining permeability from measured capillary pressure curves.
Minimizing the error is accomplished by least square minimization with the equation  where x is the kernel and y is permeability.
Thus,
 (8)
(8)
where, r = 0.952
 (9)
(9)
where, r = 0.964 The two equations indicate slightly improvement of correlation coefficient (r) with change of the used displacement pressure deriving assumptions from ThampsonKatz [18] to Schowlter.
The most significant contribution of this work will be presentation of the two Equations (8) & (9) as these relations clearly verify that permeability should be a power law function of displacement pressure, irreducible wetting phase saturation and porosity. While, involving of effective porosity variable of my measured data samples set in the correlation doesn’t make any enhancement for the regression coefficient of my model.
Furthermore, I have built a new model using samples from both sandstone and carbonate covering a wide range of lithology. Thus, I postulate that new general permeability predication equations might holds for different lithology and fluid systems.
3) Validation of the new permeability universal model
Measured permeabilities and capillary pressure derived petrophysical properties from Caballos Formation, San Francisco, Colombia and Stevens sandstone samples, Yowlumne and Paloma Fields, Kern County, California (Wu, 2004) [18], were used to test the new regression model for verification of the permeability predication.
My calibration process was performed to estimate the permeability on a sample by sample basis using the new universal regression model from the given data set of stevens sandstone samples.
Figure 11 shows the permeability calculated from my new universal model versus the measured permeability. All of the predicted permeability values fall into the acceptable range 0.25 < Kc/Km < 4, where Kc and Km are calculated and measured permeabilities, respectively. This range is considered acceptable because Bradley et al. (1972) [19,20] pointed out that closely spaced permeability measurements in core analysis can vary up to four times and still be considered accurate estimates. The coefficient of correlation (R) = 0.94 indicates the presence of high correlation. Thus, I postulate that a general equation holds for different lithology and fluid systems.

Figure 11. Comparison between MICP based permeability estimated using the new model to the measured Caballos and Stevens permeability.
4. Conclusions
My data set emphasizes and verifies the assumption of the function fitting parameter of Brooks and Corey’s (λ) and its relation to pore throat size distribution porosity and permeability. The model given by Brooks and Corey is robust and suitable for this work.
Pore geometry index shows good relationship between porosity and permeability and control fluid movement in the pores of rocks, which makes it easy to predict and widens the application of our new modified Huet and Blasingame model.
The strong correlation between pore throat radius of Schowlter and Katz-Thompson versus permeability is caused by forming of a connected filament across the span of the sample at these pressures. The permeability K can be successfully correlated to the effective porosity, capillary displacement and critical pressures corresponding pore throat radius, irreducible wetting phase saturation, and the index of pore size distribution using a theoretically defined power law correlation model.
KH-B method has been formulated in such a way that allows the capillary pressure data to be incorporated as a variable using the Brooks-Corey methodology. Given that the entire pore throat distribution is considered during the Huet-Blasingame approach, the KH-B value is most sensitive to the displacement pressure (pd) estimation and, pd is highly dependent on the conformance correction and different assumptions—failure to incorporate this correction and different assumptions can and will lead to significant errors in permeability estimation for the Huet-Blasingame approach.
Huet and Blasingame used data set which was not optimally populated. I recognize that the method was not derived for rock permeabilities less than 0.1 md. The model can be relatively insensitive to the different combination of the Pd, Swi and λ parameters while my present study widens the permeability range to less than 0.1 md. This is an issue that is most likely related to the quality and character of the capillary pressure data.
The building of my model suggests that the correlating properties of the porous media (k, φ, Swi, Pd, and λ) are not specifically dependent upon lithology but rather, these properties uniquely quantify the fluid flow behavior of the porous medium.
My new model takes into consideration issues relevant to low and very low permeability reservoirs (very complex flow paths, micro/nano-porosity, etc.).
General equation for accurate predications of permeability produced from measured capillary pressure curve is possible in spite of sample rocks lithology type.
R35 is of better correlation than pore geometry index with permeability because λ express the complete spectrum of effective pore throat radius.
The calculated permeabilities from the new universal empirical model agree will with measurements.