Rockfall Hazard in an Old Abandoned Aggregate Quarry in the City of Tétouan, Morocco ()
1. Introduction
The city of Tétouan has witnessed a very important demographic growth in the last few decades. This growth is related mostly to a phenomenon of rural exodus that has been increasing due to various causes like job opportunities and better conditions of life but mostly because of the long period of drought in Morocco peaked in the late 1980’s and early 1990’s. The total population has gone from 206.556 in 1982 to 318.698 in 2004 (official census data from the High Commission for Planning). This growth has put a big strain on the urban capacity of the city resulting in the creation of various slum areas around the city.
One of these areas constitutes the subject of this study. It is an old abandoned quarry left without rehabilitation since it was shut down in the 60s, which became a place for unauthorized construction that has converted the site into a neighborhood that conveniently took the name of “CARIAN” which means “quarry” in the local dialect. Many houses are surrounding the quarry’s wall; others are built on top of the quarry very close the edge of the slope. On the wall of the quarry multiple caves are founds and they can be frequented by people on a daily basis and its ground is used as a frequent walkway for pedestrians and as an unofficial parking lot, which makes it a source of great risk for these people even though the site has been officially included in the urban area.
2. Description of the Quarry
The subject of this study is a small scale abandoned aggregate quarry exploiting a small hill in the north western part of Tétouan at the following coordinates: 35˚34'32"N; 5˚23'30"W. The quarry stretches in NE-SW direction with its face toward the south east and it extends approximately over 120 m (figure 1). The face of the quarry from 8 to 30 m high is highly irregular.
From a geological point of view the exploited site is a klippe that belongs to the Predorsalian nappe [1,2], which is of limestone with marl interbeds of the Upper Oligocene Age.
The face of the quarry is heavily fractured due to both tectonics and to the use of explosives during its active years. The joints in the rock mass vary from small scale fractures to decametric faults that run vertically through the whole rock mass; the fracturing becomes denser towards the east as the rock benches narrow (figure 2).
The face of the quarry is highly weathered and unclean due to human activity in which they use the slope as a dump, at its foot we can find blocks of rocks of multiple
sizes that varies from few centimeters to metric size. People from the area have confirmed that a lot of these rocks did fell off the quarry face, that lay on top of layers of harden overburden material, from the old mining activity, which, presumably has been serving as a catch bench for these rock falls. Multiple screes also can be noticed on quarry’s wall; some of them look more recent than others (figure 2), we have also found multiple caves of different sizes across the wall of the quarry, some of which are at its foot and form a cantilever—like structure.
3. History of Rockfalls
There is no official registry of the previous incidents but according to local residents in the neighborhood, they are frequent and can happen every year with some major ones that occurred in 1969, 1972 and 1977 during the rainy season, resulting the fall of big blocks of rock (figure 3).
In recent years, a major rockfall incident happened January the 29th and the 31st of 2010, which followed a week of rain (208 mm) and two days after the rainiest day of the year (88 mm). Another one of a lesser scale happened in mid-January 2012 resulting screes and rockfalls, these two incidences have affected mostly the eastern area of the quarry where it is most fractured and caused it to recede noticeably.
4. Rock Mass Characterization
In order to characterize the rock mass, a study of its discontinuities was conducted on the quarry’s wall using the one proposed by the IRSM [3], in which we have realized an inventory of discontinuities that appear across the quarry’s wall in order to determinate these parameters: orientation, persistence, spacing, roughness, strength (in situ), width and fill of the opening, weathering and the existence of water.
The measurements were then reported on the canvas of Schmidt (figure 4) with the help of DIPS (5.1) (RocSciences) [4] in which we were able to determine five different join sets represented in table 1 with their different parameters.
Quality of Rock Mass and Geomechanics Classification
After having established the geotechnical parameters of the rock mass, it was possible to estimate its geomechanics quality, using the RMR classification proposed by Bienawski (1989) [5], as shown in table 2. The value of the RMR in the quarry was estimated at 61 which reflect a fair to good rock quality.
5. Stability Analysis
5.1. Geotechnical Parameters
The rock have a density of 2631 kg/m3, GSI = 48,  = 148 MPa and mi = 8; and using the Hoek-Brown failure criterion we were able to determine the average cohesion; c = 0.337 MPa using RocData (Rocscience, 2004).
Angle of friction
Using Barton’s equation for estimating shear strength in a rock mass [6]
 (1)
(1)
where:  is the normal stress;
  is the residual friction angle of the surface; JRC is the joint roughness coefficient and JCS is the joint wall compressive strength.
Starting from a basic friction angle of  = 28˚ we were able to estimate
  for each join set using the following equation:
 (2)
(2)
where r is the Schmidt rebound number wet and weathered fracture surfaces and R is the Schmidt rebound number on dry unweathered sawn surfaces.
Combining equations (1) and (2) we were able to determine the specific shear strength value for each family set.
5.2. Kinematic Analysis
The stereographic representation of the join sets with the slope (figure 5) allows the realization of a kinematic analysis on the walls of the quarry divided in five domains, following the variations of slope to identify the different failure mechanisms that occur in the quarry [7,8].
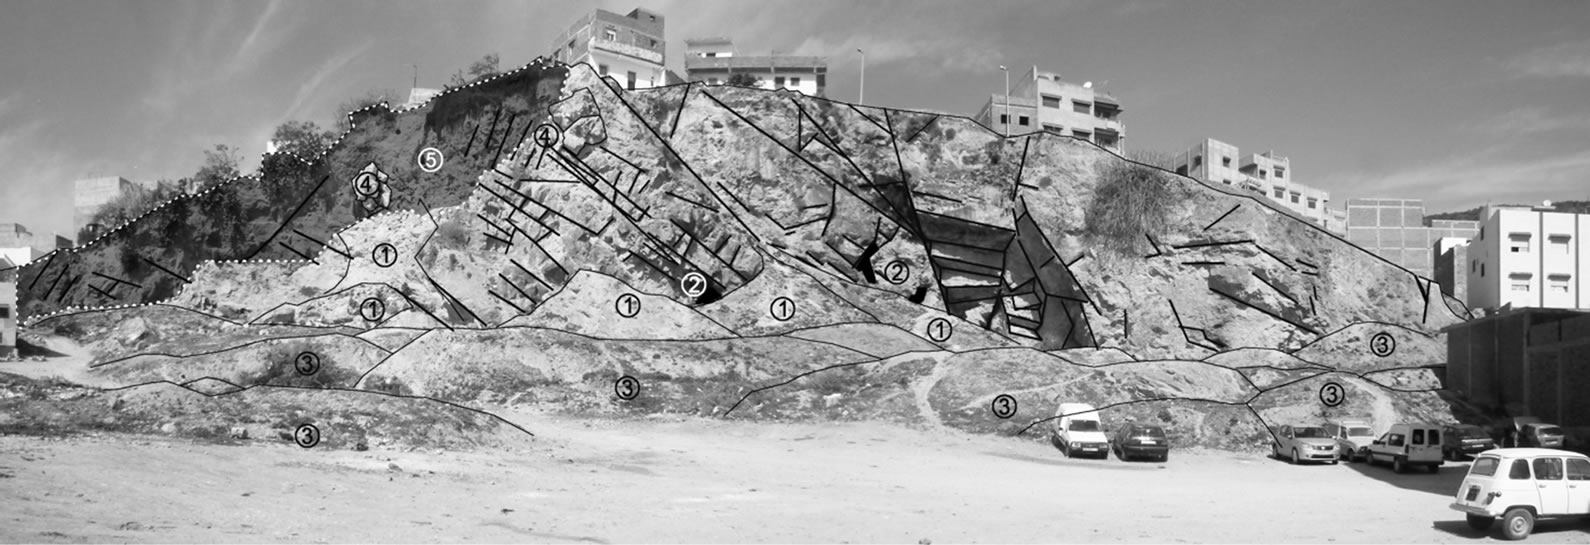
Figure 2. Fracturing and instability components showing on the face of the quarry. (1) Talus; (2) Caves; (3) Overburden; (4) Unstable rocks attached to the face of the quarry; (5) Highly fractured area.
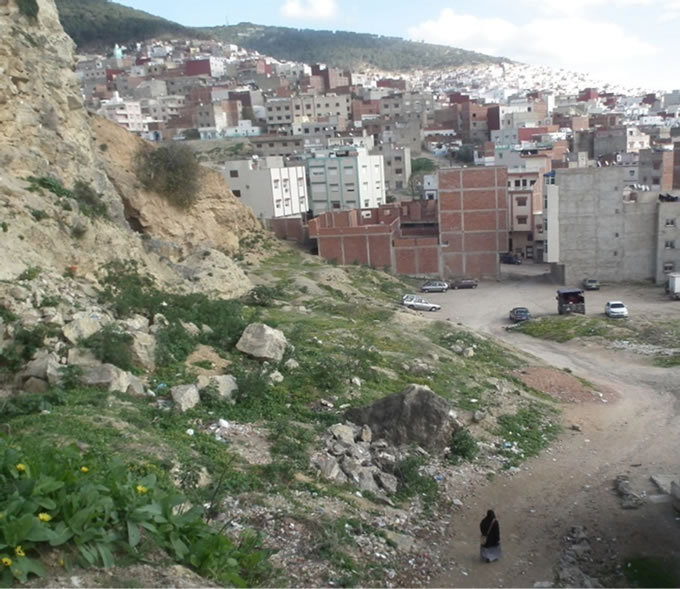
Figure 3. Photo of the eastern part of the quarry showing different blocks that have fallen off the slope during different incidences.
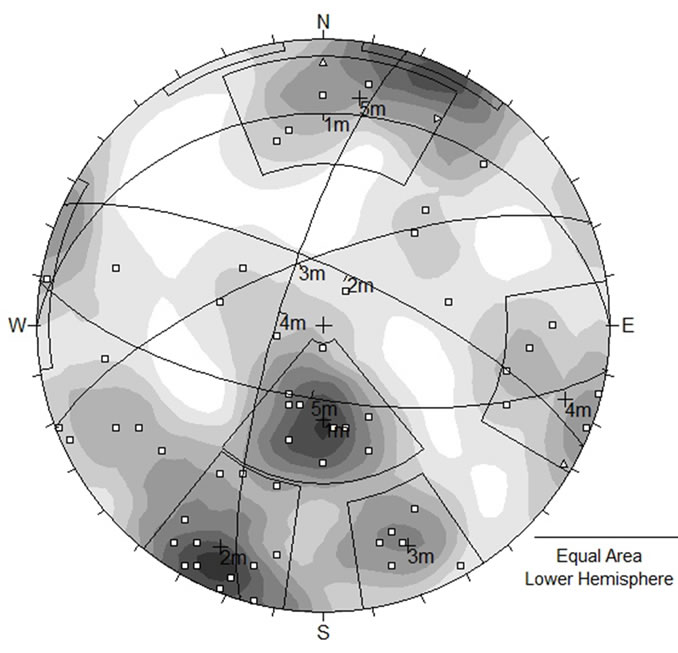
Figure 4. Stereographic representation of joins and join sets in the quarry.
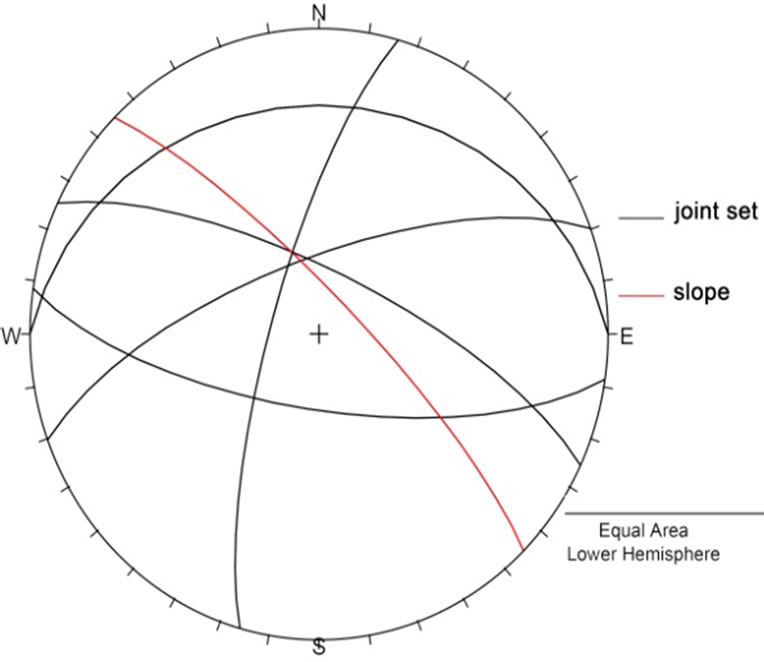
Figure 5. Stereographic representations of the join set and slope in one of the positions.
5.3. Stability Analysis of Failure Mechanisms
The stability analysis was done using specialized programs like Swedge (4.0) [4] (figures 6 and 7) for wedge analysis and Roc-Plane [4] (2.0) for planar failures, these two programs allow to estimate the probability of failure (PF) for each case, taking into consideration the different variables like orientation of the joints, orientation and height of the slope, the rock’s specific weight, cohesion, friction angle, water pressure in the joints and seismic coefficient.
Table 3 shows the results of these analyses with the values of probability of failure associated to each case with degrees of water fill 0%, 50% and 100%.
The results show that in the actual orientation of the quarry’s face, many wedges exist along its wall, and while they are totally stable in dry conditions, they are at risk of falling when the joints get filled with water.
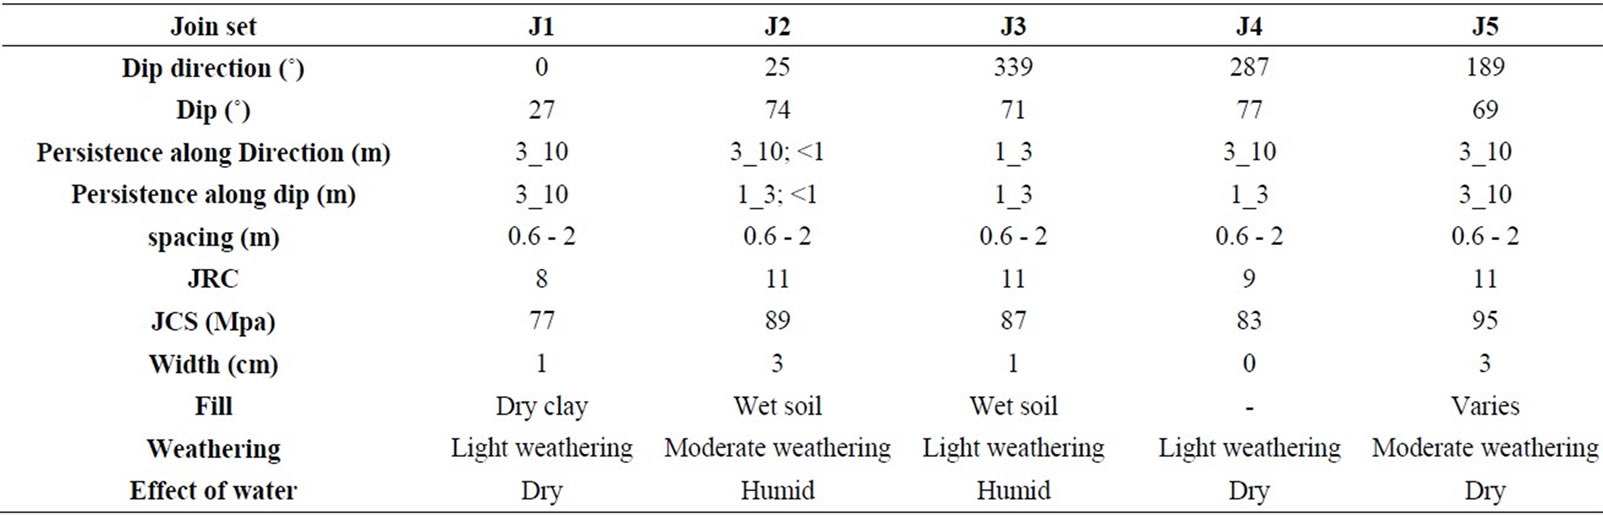
Table 1. summary table characterizing the join sets found.
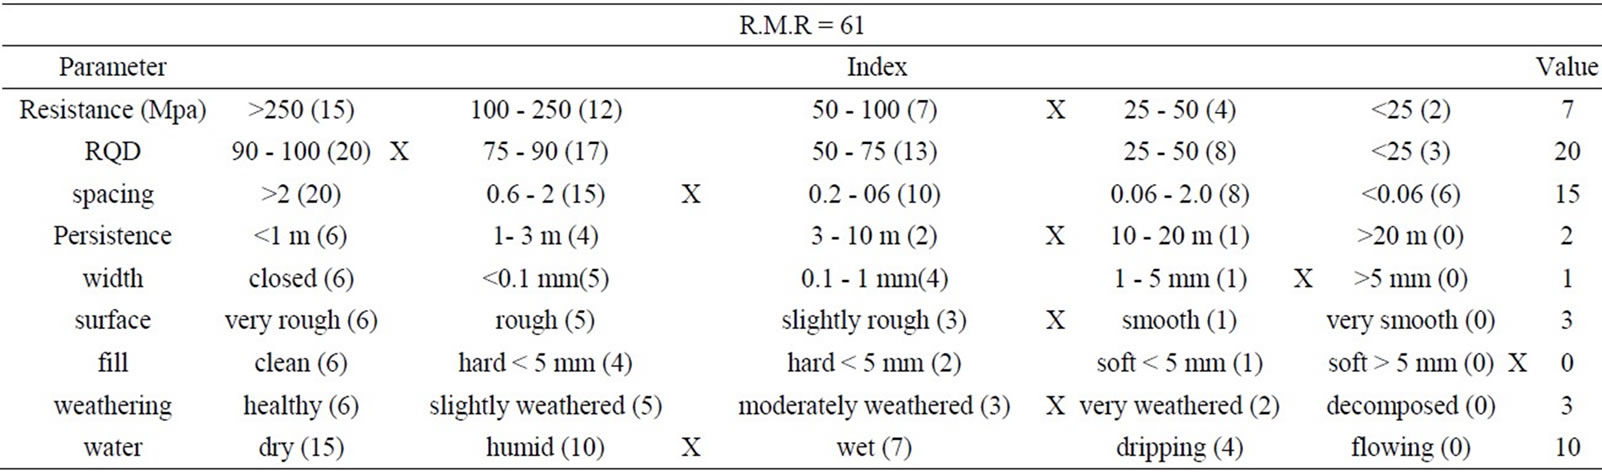
Table 2. Rock mass rating (RMR) index of Bienawsky 1989.
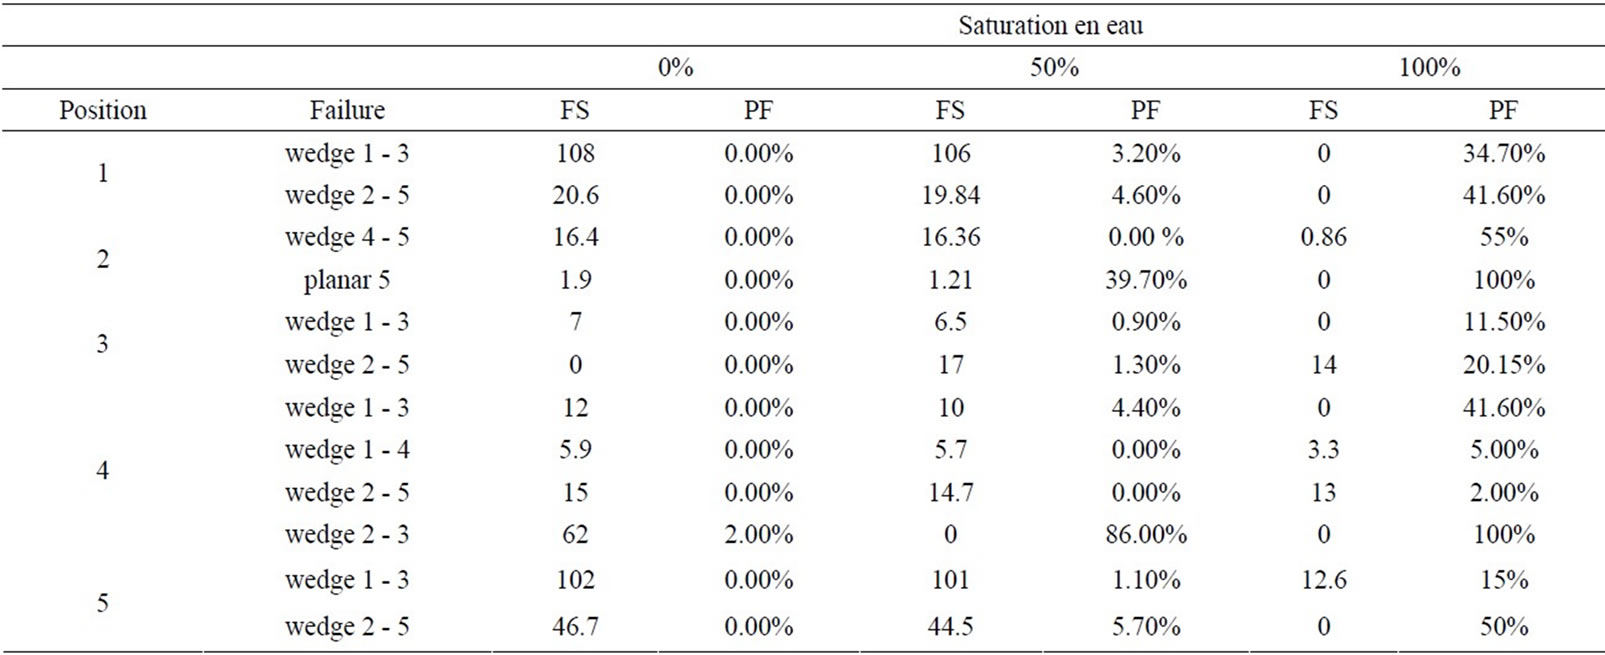
Table 3. Results of stability analysis of the different found in each position of the quarry.
5.4. Rockfall Simulation and Determination of the Risk Area
Virtual simulation of rockfall phenomena was done on 13 profiles across the quarry’s face, using Rocfall (RocSciences, 2004) [4], allows the estimation of the possible trajectories of a rockfall and calculate the horizontal distributions of its end points (figure 8).
These results enabled the determination of the distance from the quarries wall where most rockfalls could occur. Reporting these distances on the quarry’s plan allows to draw a high risk area and determinate a safe distance from the wall of the quarry (figure 9).
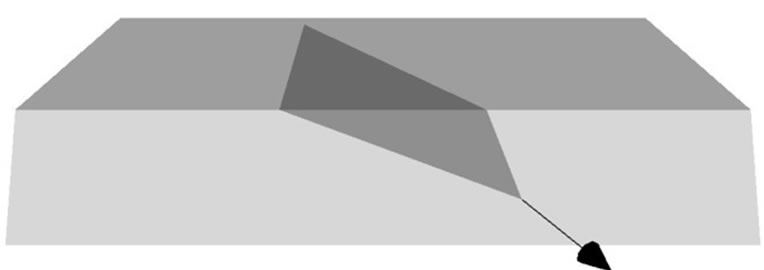
Figure 6. Virtual modeling of a wedge type failure in the quarry done by swedge.
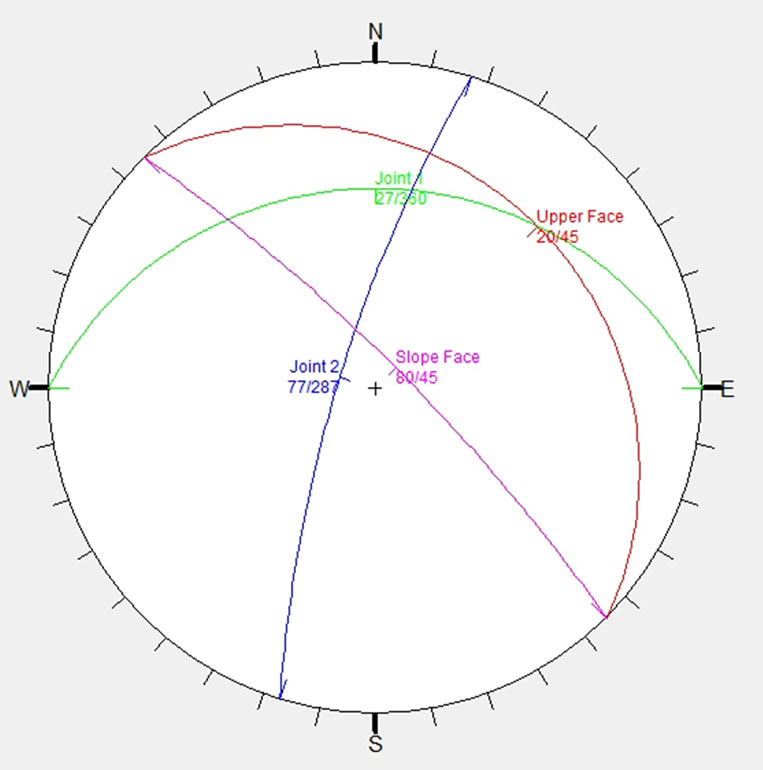
Figure 7. Stereographic representation of the same failure.
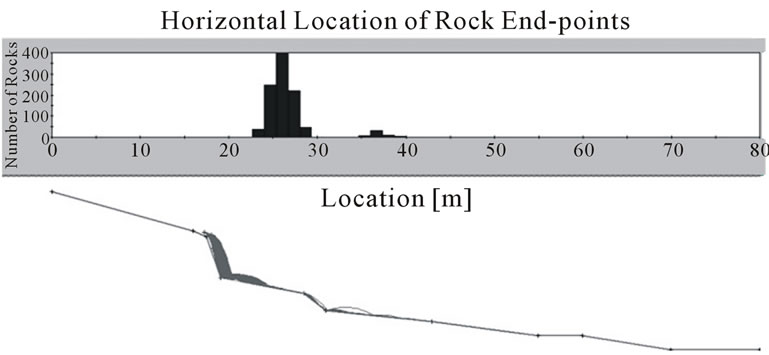
Figure 8. Rock simulation and its vertical destribution in one of the profiles done by Rocfall (4.0).
The results of rockfall simulations show that in most location within the quarry 80% - 99% of the rocks fall only few meters away from its wall, which is due to those levels of overburden that work as a catch bench, still there is a risk that rocks can reach distances as far as 40 m from the wall in some places with a bounce level that can reach over 1 m in height.
6. Conclusion
Years of poor practices of blasting and poor management
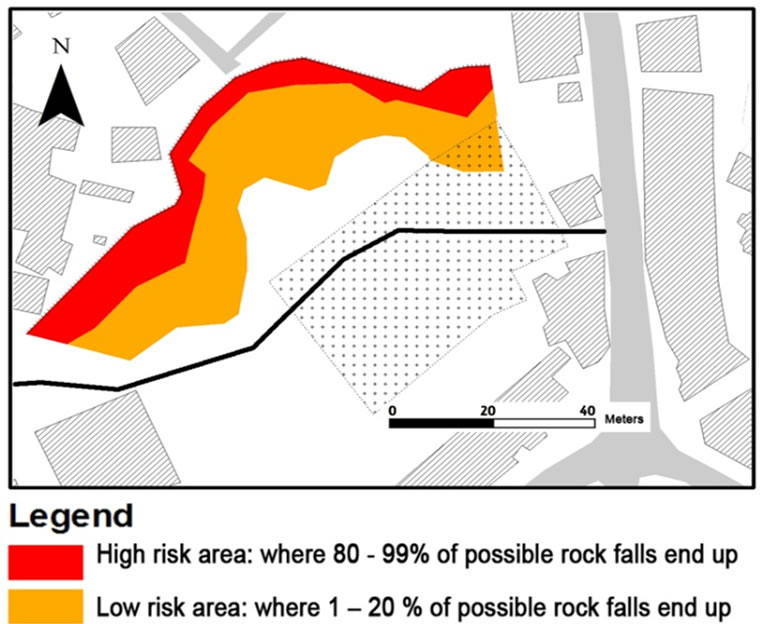
Figure 9. rockfall risk areas in the quarry.
have left the Carian quarry at a genuine risk of rockfall that can cause serious physical and/or propriety damages, to the population of the area, passengers, and the houses on top and cars at the ground. On the other hand these instabilities cause a noticeable recede of face of the quarry in some of its areas, which puts the houses on top at a great risk. As these risks get even higher during the raining season, it is advisable to keep a safe distance as mentioned and get into rehabilitating the area as soon as possible.
NOTES