The Role of Fiscal Policy in Spain from 2007 to 2010 and the Influence of Aggregate Public Spending on Economic Growth ()
1. Introduction: Going through the Worst Crisis in Decades
During the year 2008, we were exceptional spectators of the international economic deterioration and the first global crisis of the 21st century that apparently originated in the explosion of subprime mortgages in the United States in 2007. From that moment, a period of deep turbulence began that entailed the loss of solvency throughout the entire international financial system. Later, as we know, this situation worsened due to the serious challenges that many European and American financial institutions faced, regardless of their size. This situation led to various governments and central banks intervening by providing huge resources for their restructuring.
In Spain, the curbed financial activity had an immediate transfer on the productive economy as well as families, who saw their access to credit drastically reduced. However, this impact was not the only cause of the economic crisis, given that there also were serious structural imbalances arising in the growth period before the crisis, especially after the adoption of the single European currency. This growth model was based first of all on the drive of domestic demand, which went hand in hand with a sharp increase in funding requirements and a high current account deficit with the outside world, as well as the largest trade deficit among developed countries, since as early as 2007 9% of GDP was exceeded.
Specifically, the Spanish economic growth pattern was essentially based on the push for real estate and services, with little added value, in a context of low interest rates and a growing demand for low-skilled labour. Moreover, we have to take into account the absence of sufficient productive capitalization and investment in research and innovation, which has negatively influenced productivity and market competitiveness.
Thus, the effectiveness of fiscal policy is permanently located at the epicentre of the debate on economic policy [1-3]. Eurozone governments initially responded to the negative outlook of the recession with various countercyclical fiscal measures, under the European Economic Recovery Plan1. In this context, it can be said that the effects on public finances were negative across the board as a result of the sharp fall in government revenues and increased spending, especially those designed to mitigate the effects of the crisis and to nourish the aid for the banking system and other sectors of the economy. From there, all countries of the Economic and Monetary Union (EMU), except Luxembourg, activated excessive deficit procedures (EDP).
In another vein, the crisis clearly revealed that the three pillars of the EMU—a ban on rescuing other states, a ban on the monetization of public debt and the Stability and Growth Pact (Treaty of Maastricht)—have proved a failure. The first two were violated as it was necessary to have mechanisms that would help countries with serious debt problems, and only the third became a reality but not until 2012.
In this regard, there have been various factors that have negatively affected the economic outlook, mainly, the lack of European policies for recovery, the volatility of international financial markets and the slow adoption of agreements. For example, the so-called “fiscal pact”; this gives the EU a new framework for fiscal discipline and stability that must be incorporated into the laws of each country.
According to forecasts by the European Commission (EC), the ratio of public debt to GDP in EMU countries will be around 85% in 2013, compared to 60% in 2007 [4]. And while it is true that these percentages are not very different from what is observed in other periods, a fundamental difference should be noted however: the starting point of public debt. Indeed, Spain started from a relatively low level, not exceeding 36% of GDP in 2007, while it also enjoyed a very favourable situation from the point of view of revenue with a nominal GDP growth rate of 8%. However, the significant declines in the collection of the most considerable taxes for the economic cycle-up to 63% in corporate tax (CT) and 13% in the value added tax (VAT), in spite of a rate increase in the 2010 general budget—along with discretionary expansion measures beyond automatic stabilizers, led to the change in just two years (2008-2009) of 20,066 million euros in surplus in 2007 to −117,630 million euros in deficit, though fiscal consolidation measures adopted in 2010 reduced the deficit to −98,227 million euros.
2. The Evolution of Government Revenue and Expenditure
As shown in Table 1, until 2006 the economic situation enabled the rates of growth of government revenue to be well above the rate of spending, mainly due to the growth of taxes (in greater measure, taxes on production and imports) [5-7]. In 2010, the negative rate in spending reflected the beginning of the fiscal consolidation process2, while the rate of social security benefits on total expenditures peaked in the decade because of the deterioration of the labour market.
In turn, the expansionary measures taken in the twoyear period of 2007-20083 had a reflex in the government’s disposable revenue, as shown by the negative rates in Table 2. In relation to families, the effect could already be seen from 2009, coinciding with the intense adjustment in domestic demand, with a negative variation of a 6% magnitude compared to 2008 and an employment loss rate of 6.6% over the previous year, although part of that expansive impulse, given the uncertain environment, resulted in a higher household saving rate4. With the onset of the path to fiscal consolidation in 2010, the data also show that families had a negative rate in the same year.
Certainly, the discretionary fiscal actions prematurely exhausted the ability for fiscal manoeuvring and efficient mechanisms were not designed to adjust the negative trend in disposable income. Countercyclical measures adopted in the first period of the current crisis did not have a neutral effect on the extent of debt of the Spanish economy, but revealed errors in the power of fiscal policy.
2.1. The Behaviour of Non-Interest Revenue
The crisis, which began to intensify as of 2008, has been
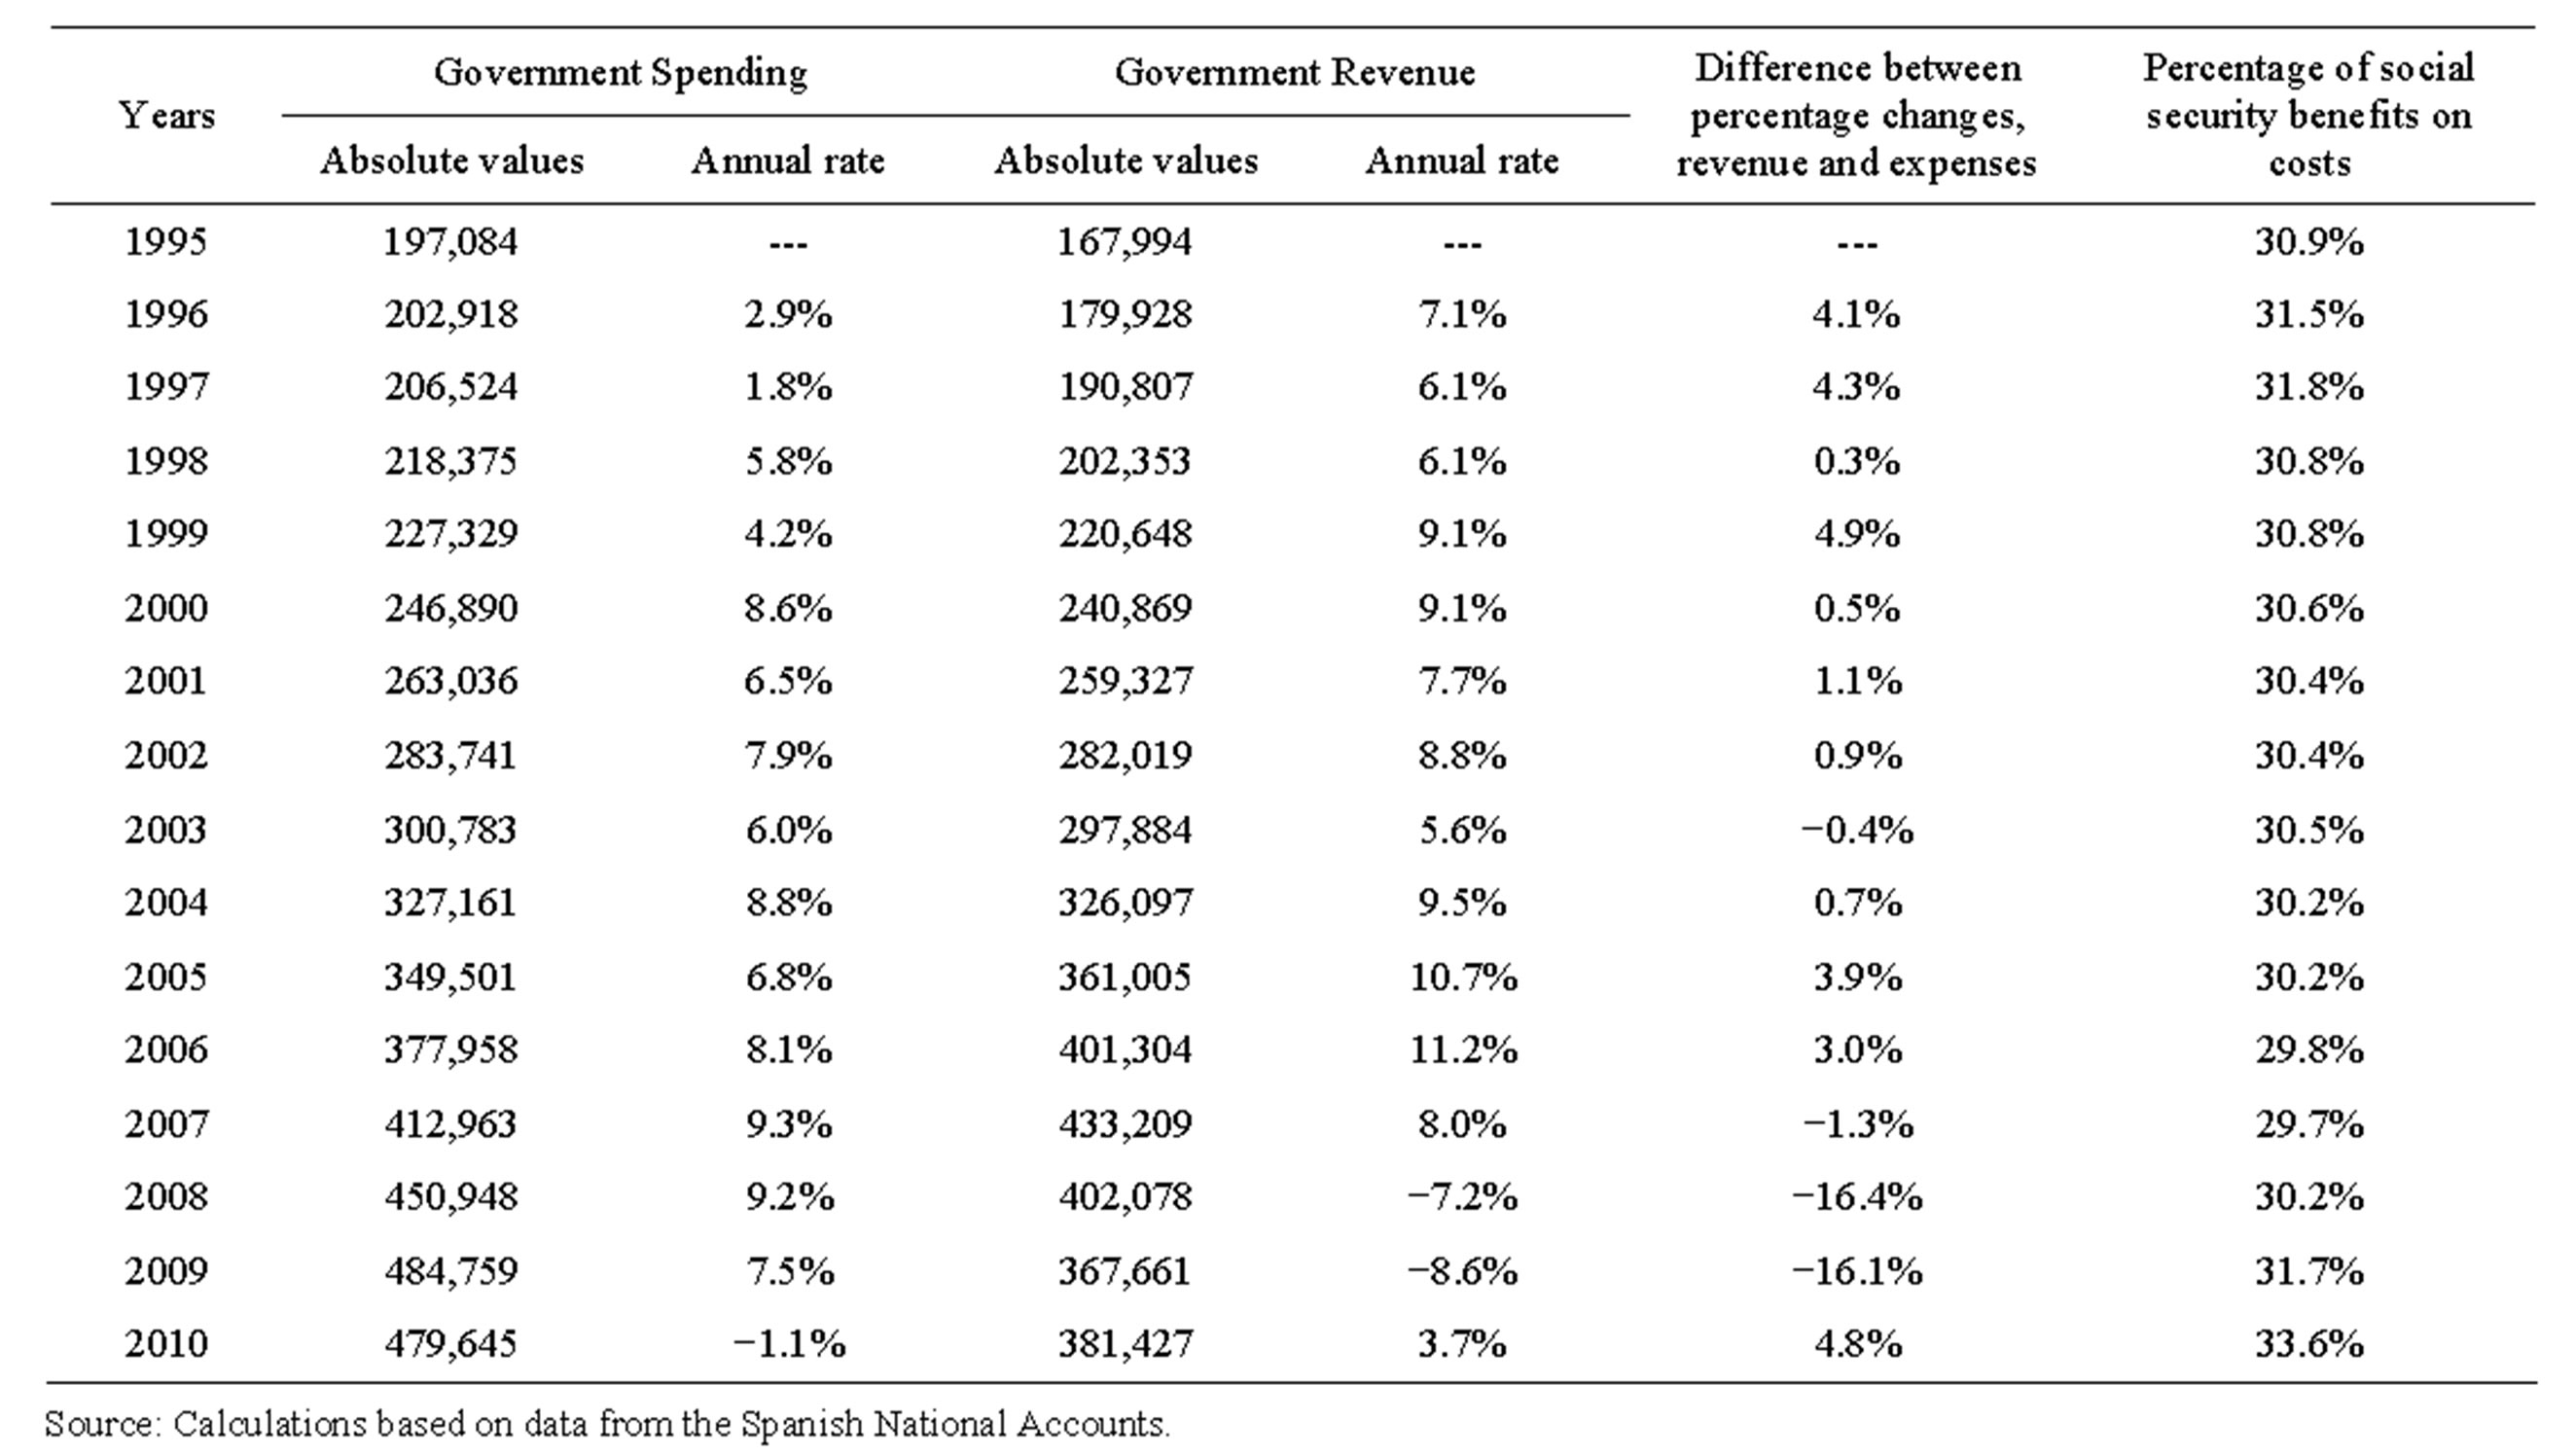
Table 1. Government income and expenditure.
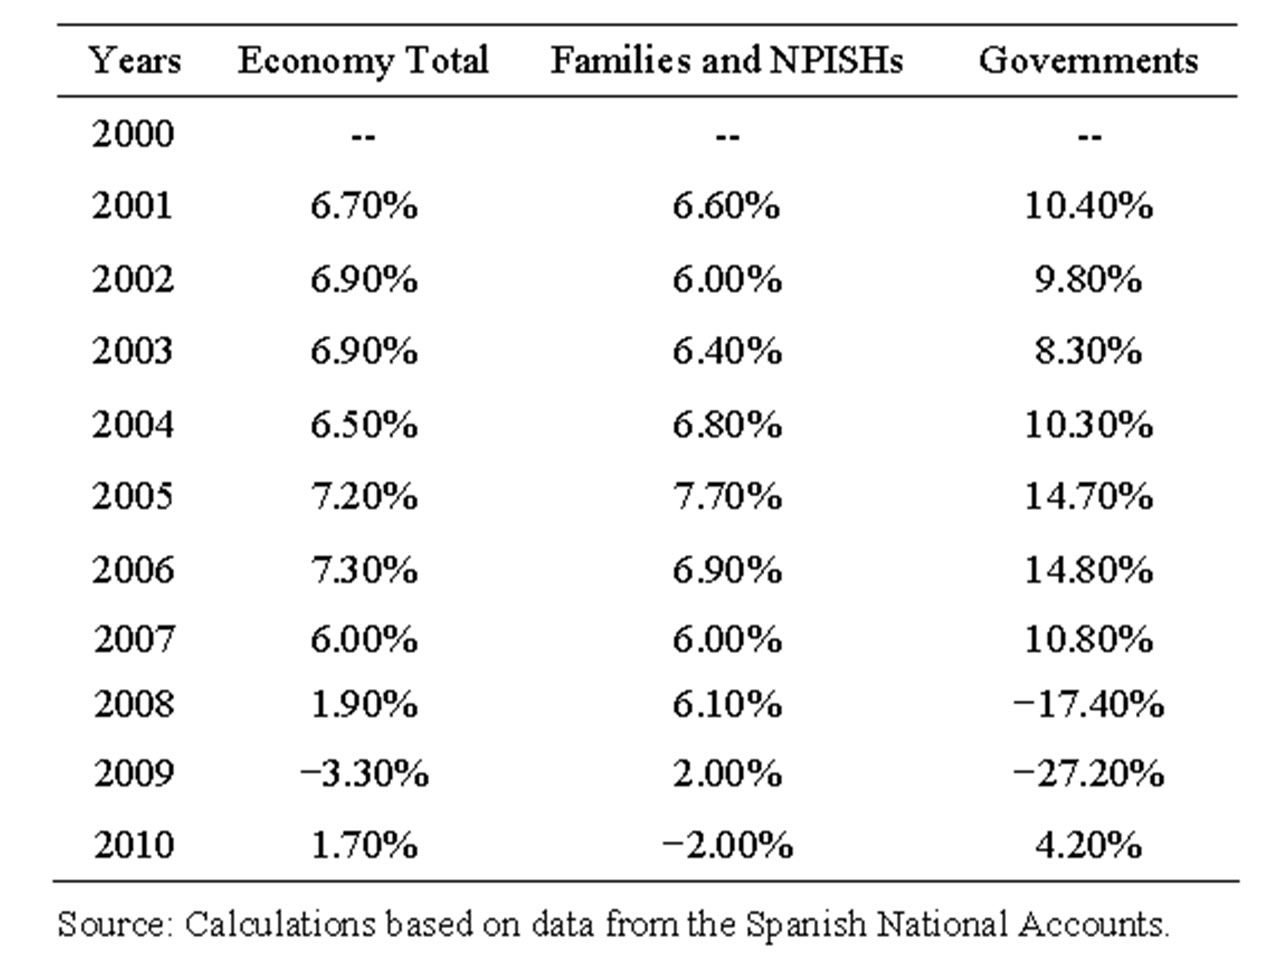
Table 2. Disposable income growth rates.
having a clearly negative impact on government revenue, especially in the two-year period of 2008-2009, due to both the decline in tax revenues caused by decisions of regulatory change in the field of revenues5 as well as the overall economic structure. Since then, this has meant that government revenues (RNIR) have been suffering a greater impact than the change in GDP in nominal terms (RCGDP), as seen in Figure 1.
In 2007-2010, revenue from direct and indirect taxation fell at an annual rate of 5.9% cumulative [5], 2009 being the year of the greatest impact in absolute decline. Specifically, the decline experienced between 2008 and 2009—17% in 2008 and 28% in 2007—was the result of the sharp economic downturn due to the increase in unemployment, the decrease in sales and imports, and restrictions on credit, among other causes. But also fiscal policy decisions taken by the State Government in 2007 —in personal income tax and corporate tax6, with direct impact on income in later years—and in 2008. In particular, the latter were intended to stimulate private consumption and ultimately, boost the economy. However, not only did they not achieve their goal, but they caused the opposite effect, since the elasticity of consumption was lower than predicted by the Executive, so that government revenues did not grow as estimated7. Table 3 shows the negative evolution of tax revenues by section and the impact of measures taken on indirect taxes in 2009, which were higher than the direct ones.
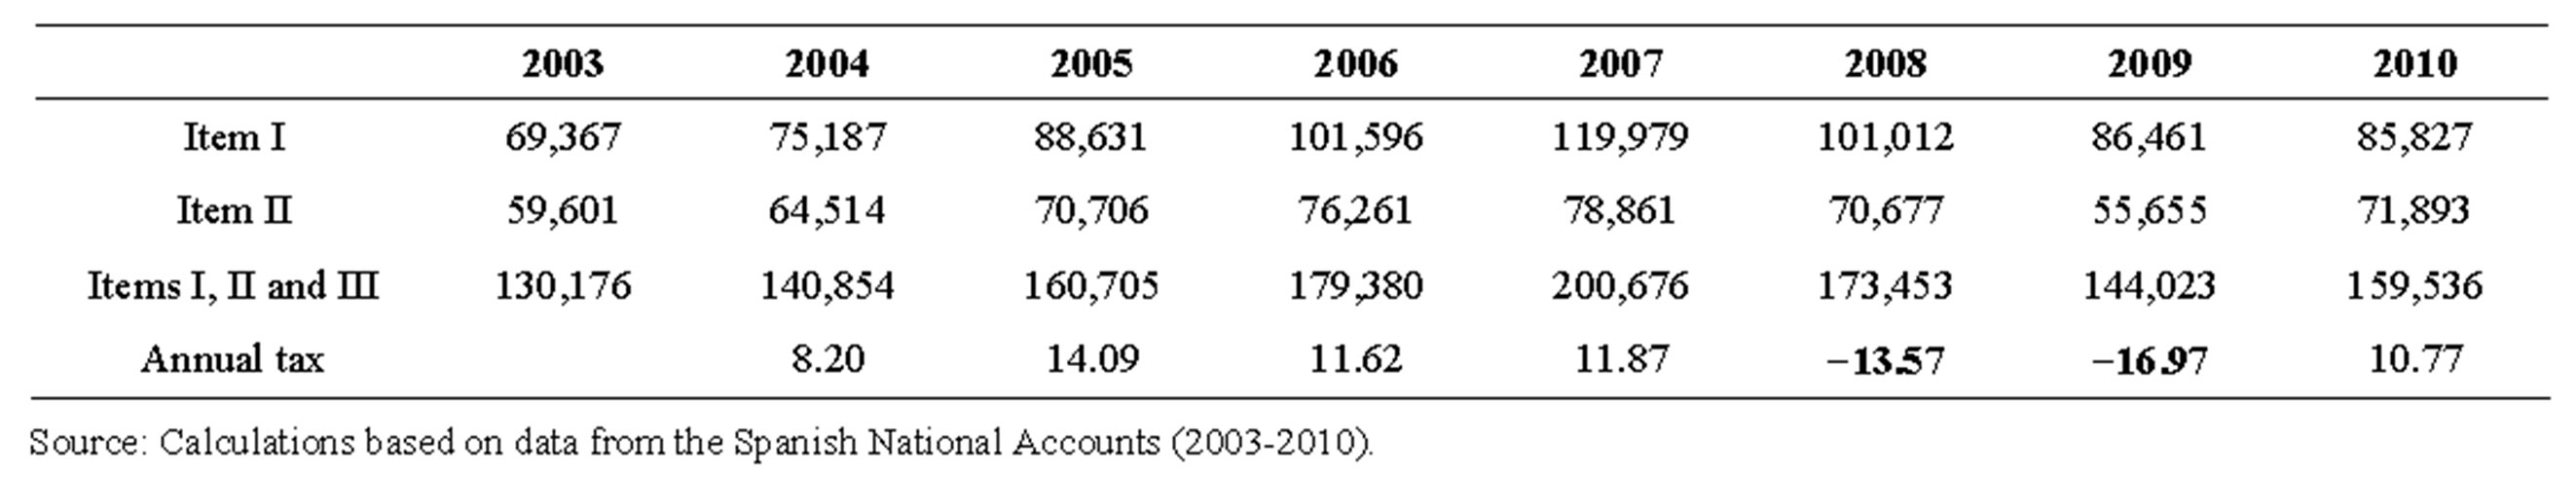
Table 3. Government total tax revenue.

Figure 1. Evolution of the growth rates of GDP and noninterest revenue in nominal terms (1995-2010). Source: Calculations based on data from the Spanish National Accounts.
In 2010, however, there was a trend change as a result of the elimination of the measures undertaken in previous years and the incorporation of new measures for the correction of the public deficit; an increase that was basically due to the increase in revenues from VAT with 15,519 million euros.
2.2. Evolution of the Tax Burden
From another perspective, the expansionary impulse of the first period of the crisis has changed the trend in the tax burden in recent years—calculated as the ratio between the ratio of the sum of taxes (direct and indirect), plus social security contributions to GDP—as can be seen in Table 4. In the statistical series for the decade of 2000-2010, we see a change from 2007, when its propensity for lowering was altered, especially in 2009.
To interpret this scenario we must take into consideration that the evolution of this indicator was in line with the economic cycle: in times of economic growth, it is known that the level of tax revenue usually grows due to the dynamism of the economy and the progressive tax system; whereas in times of recession it falls faster than economic activity. In this sense, we can say that, first, the change in GDP in market prices was positive, except for the year 2009, which revealed the harshness of the crisis. Second, that the change in GDP showed values lower
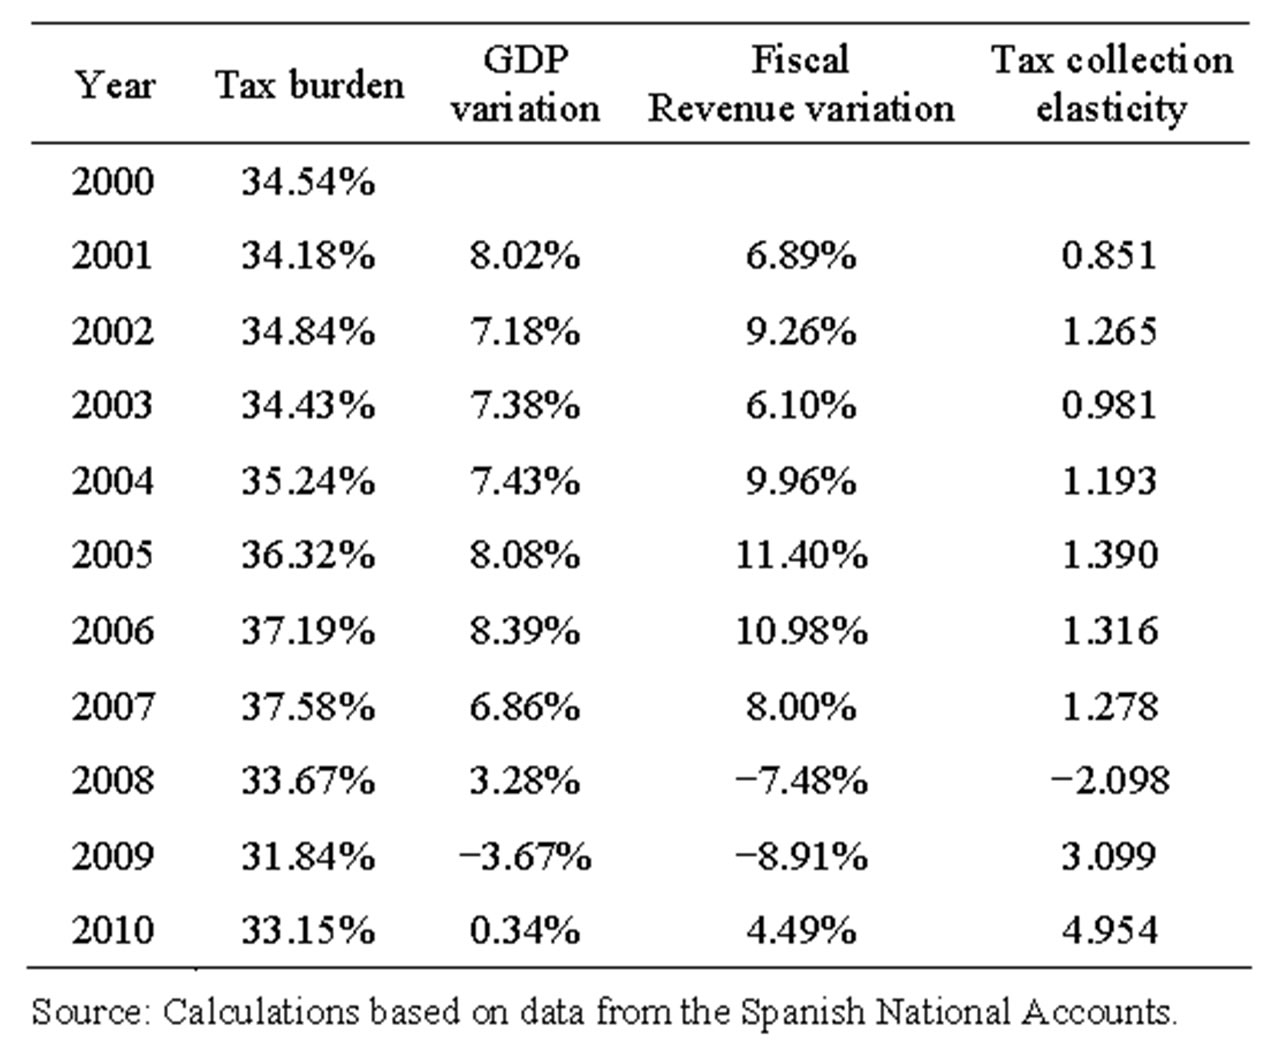
Table 4. Tax burden and variation elasticity in tax revenue with regard to the variation in GDP.
than the variation in tax revenues, especially from 2002, when a recovery cycle began.
However, this same reasoning could not be sustained after 2008: the ratio of the change in tax revenue over the change in GDP (“tax collection elasticity coefficient”) changed direction. In 2008, with GDP growth due to the rise in the consumer price index (CPI), there was a significant decrease in tax revenue (both taxes on production and imports such as the current taxes on income and wealth), which continued declining in 2009, although in 2010, before a slight rebound in GDP, there was a percentage increase, not in absolute terms, much higher than in previous years, mainly due to the behaviour of indirect taxation.
2.3. Final Consumption Investment and Expenditure
With regard to the behaviour of government expenditures (FC), we can see an analysis of the “final consumption expenditure” as a measure of collective consumption as well as corporate transfers of goods and services by the government and “gross fixed capital formation”8 as a measure of public investment (GFCF)—Figure 2—as

Figure 2. The evolution of final consumption and government investment and borrowing in real terms (1995-2010). Source: Calculations based on data from the Spanish National Accounts.
well as how in absolute terms, and in real terms, the trend of the series of final consumption expenditure was increasing throughout the period of 1995-2009, showing a slight change in 2010 due to the start of the path of deficit reduction.
The growth in the years 2008 and 2009 was due in part to the implementation of expansionary measures from expenditures9, in order to boost employment and restructure the financial system. In contrast, public investment altered its upward trend, albeit lower, as of 2008, while the need to finance10 grew further after the 2008, as a result of the significant drop in government revenues.
The growth in the government’s final consumption (FC) is not the only factor in the growth of borrowing (B), since, the increase of final consumption does not correspond to the increase in debit, which changed with the evolution of non-interest revenue (NIR). Additionally, as seen from a different perspective in Figure 3, when analysing the variation from year to year in absolute values from 2007 to 2009 the consumption behaviour (CB) was contrary to the GDP pattern (GDPP) and public deficit (PD).
From another perspective, Figure 4, shows how, the rates of change for final consumption expenditure (RCFCE) exceeded those for GDP (RCGDP) starting in 2002. At the same time, we can see how from 2007 government consumption grew while GDP decreased, although the government investment (GI) had, in the same interval, presented cyclical behaviour with a significant drop in 2010.
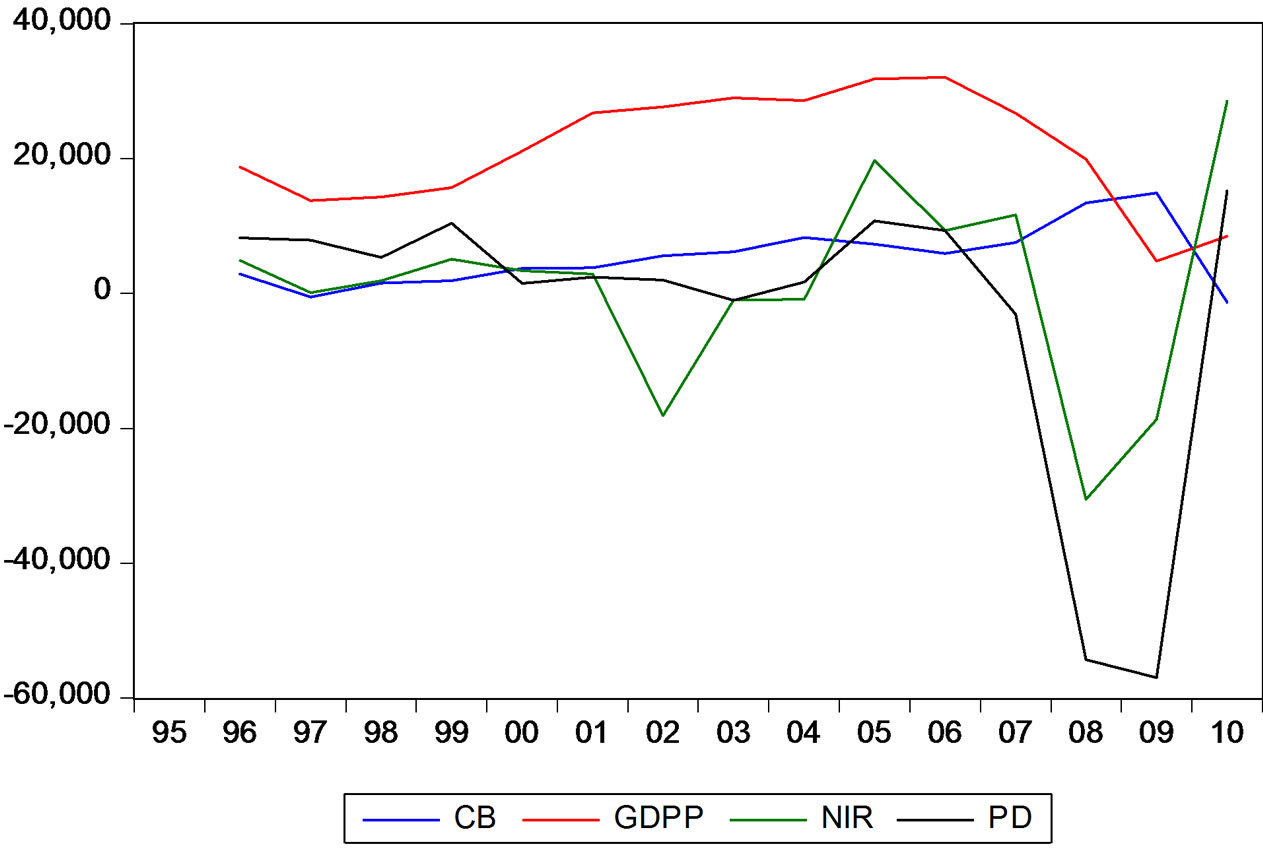
Figure 3. Variation from year to year in absolute values of the government’s final consumption, GDP, non-interest revenue and borrowing (1995-2010). Source: Calculations based on data from the Spanish National Accounts.
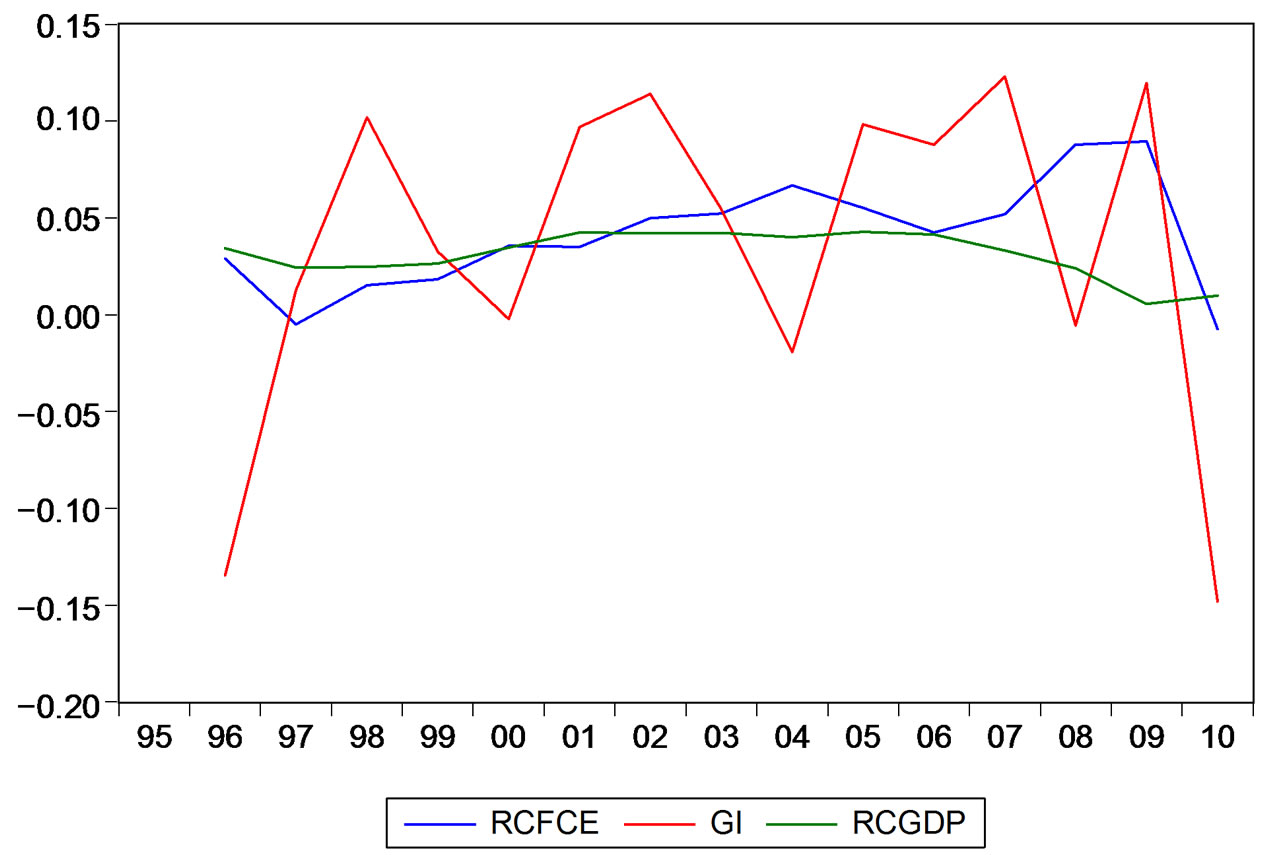
Figure 4. Variation rates for GDP, investment and government final consumption (1995-2010). Source: Calculations based on data from the Spanish National Accounts.
If we divide the time interval analysed in three stages we can observe that (Table 5), first; the average rate of change of final consumption expenditure grew, while the corresponding for the gross fixed capital formation decreased in the third stage, coinciding with the period of crisis, after experiencing a significant increase in the second stage, that is to say, the period of expansion. Secondly, we can also see that the average participation for final consumption expenditure to GDP reached 20.5% in the crisis period.
2.4. Quantification of the Expansionary Measures during the Period of 2007-2010
From 2007 to 2010, the impact on tax revenues from regulatory changes resulted in collecting fewer resources estimated at over 20,000 million euros, as shown in Table 6. In particular, in 2008 the lower revenue (71.8%) were due to both the regulatory changes introduced in 2007 in the structure of the main taxes (income tax,

Table 5. Average rate changes for GDP, final consumption and government fixed capital gross formation in stages.

Table 6. Quantification of regulatory changes (I).
corporate tax and VAT), aimed at injecting resources at both businesses and families (amid falling corporate profits and the contraction in consumption), as well as deferrals for tax debts due to the lack of liquidity in the system.
By contrast, in 2009, as shown in Table 7, most of the revenue loss was due to a sharp decline in economic activity and, consequently, the significant decline in employment as well as profits and revenue, which also negatively impacted the settlements of major taxes from the previous year.
In short, the package of expansionary fiscal measures in the field of revenue not only failed to suit the economic times that were already experiencing a serious deterioration in the labour market but they also were not designed to have a significant impact in a shift of the economic growth pattern, subject to hegemony until then by the property sector. Moreover, in 2008 the tax reforms on direct taxes (income tax and corporate tax) became noticeable, which were adopted in 2007, during an economic expansionary cycle.
The stimulus policies that were deployed for expenditures in 2008 and 2009, estimated at 23,701 million euros —of which 11,150 million correspond to local investment funds and for the revitalization of the economy and employment—aimed at achieving a more balanced growth in the long term11 and to contribute to the restructuring of the financial system.
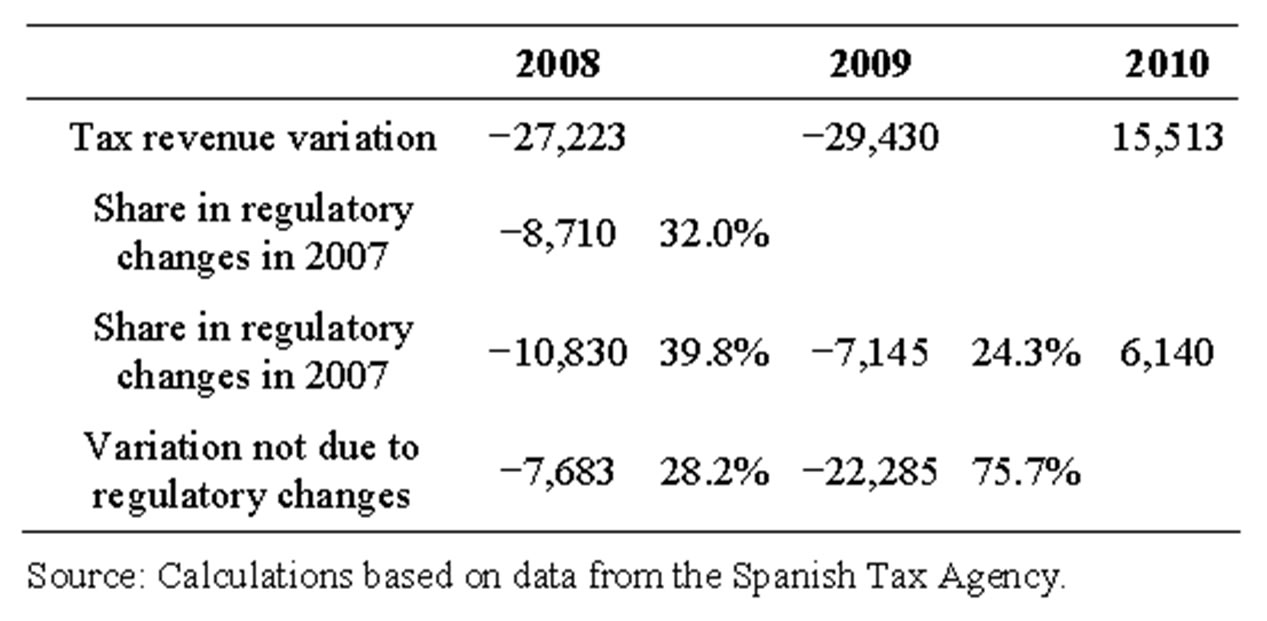
Table 7. Quantification of regulatory changes (II).
In another vein, the determination of its countercyclical effect or otherwise is relevant for determining its nature. Specifically, it is desirable to consider whether in relation to resources for local and revitalization funds, the 60,000 projects carried out can be considered an investment itself, since, as we will see in the modelling for public spending and in line with many empirical studies, the relationship between public spending and GDP is negative, whereas it is positive if we only consider spending on investment.
3. Public Sector Countercyclical Capacity
We can see from the analysis that was carried out that the fiscal policy adopted resulted in a reduction of the tax burden, which did not reverse the economic recovery. However it did result in a rapid increase in the deficit and public debt, as well as prematurely depleting fiscal space to address random cyclical situations.
Seeing this, in the current climate of intensifying sovereign debt crisis and the application of fiscal consolidation policies [11], along with forecasts of decline—by the EC and other international bodies—and facing the difficulties of correcting fiscal dynamics in the economic framework, everything seems to indicate that the recovery of the deficit figures and public debt will continue to require strenuous efforts, especially from the standpoint of public spending. Moreover, if we take in account that the prospects in the short and medium term are based on the development of foreign trade, we can predict that the recovery of tax revenues will be moderate.
Therefore, the design of structural reforms in taxation favouring sectors that stimulate the economy and create jobs is deemed necessary, even if it is another object of detailed discussion [12]. Additionally, these reforms are necessary given the rising unemployment figures, the adoption of mechanisms to equitably distribute the tax burden and not aggravate the tax burden only on employees and middle class12, so as to maintain a dual system of taxation on both labour income and on capital income.
Moreover, given the challenges facing the Spanish economy and, especially, facing the austerity mandate derived from the reform of Article 135 of the Spanish Constitution (SC), which brings about the requirement of adapting public accounts to a stability principle, another necessary debate has surfaced. This debate revolves around the Public Sector, or in other words, around the nature of aggregate public spending. Not surprisingly, this is a major issue, since its varying dimension affects the level of production, employment and welfare and in this sense, there have been many studies that have focused on the impact of the public sector in the economy.
3.1. Public Expenditure and Economic Growth
In order to analyse the effects of public spending on the aggregate growth rate, and in particular, look for evidence of whether the evolution, that changes depending the period, of public consumption items that may have had an impact on economic growth, we have used a multivariate model that enables addressing issues dynamically and feedback between variables (for possible bidirectional links)13. Our decision to use only spending and government investment as explanatory variables is due to the fact that this paper aims to test the suitability of public policies to indiscriminately reduce current public consumption.
Various empirical studies agree that the relationship between government spending and GDP is negative, except if we exclusively consider the investment in public infrastructure and education spending items [13-20]. However, it is true that, in parallel, other authors suggest the opposite, disputing the results obtained on the basis of methodological problems or sample selection (Keefer and Knack (1997)14. Additionally, others who have been inspired by endogenous growth models and focused on productive public expenditure, have analysed and quantified the effects of infrastructure public capital on GDP and the economic growth of a territory using the methodology developed by Aschauer (1989) [13,21-27], consisting of adjustment according to aggregate production, from which we obtain the “total productivity factor” (TPF), which is considered a dependent variable in regression with public capital, facilitates “the quantification of the percentage of GDP variation at constant percentage increases in public capital”.
Be that as it may, what matters is that a difference of opinion persists when it comes to estimating this elasticity, whether due to the series used, or due to specific econometric methodology. So, in other studies that use vector autoregressive models called (VAR) [27], the results in many cases are even contradictory. Studies using general equilibrium models [28-31] reveal elasticity values that show the level of production with respect to public capital that are very different from those obtained from the aggregate production estimate.
Therefore, in the context of that debate, and taking as a measure the public sector size of the “final consumption expenditure of the government according to ESA-95” from the past 15 years, this work seeks to analyse their impact on GDP, as well as determine whether growth and government spending invested through “government fixed gross capital formation”15 presents a different behaviour. On the basis of the results obtained we will not only be able to assess the ability of countercyclical fiscal policy in recent years, but also the possibility of estimating future behaviour.
3.2. Equilibrium Relationship between the Final Consumption of the Government and GDP
From here on, to analyse whether the evolution in the time of public spending has been able to have an impact on economic growth, it is worth studying whether there is, from an econometric point of view, a long term stable equilibrium relationship between government spending and GDP. To accomplish this, we will propose a bivariate relationship model, valid for future predictions. Methodologically, we analyse the presence of cointegration [32] between the two series to estimate a model for error correction for cointegrated nonstationary series.
Thus, based on the data provided by the Quarterly National Accounts, which provides final consumption expenditure quarterly series aggregate of the general government and of the GDP, in real terms for the period of 1995-2010 (base 2000), we see that, by trend, it deals with two nonstationary series in mean and variance (Figure 5). Thus, in order to correct the “nonstationarity”16 in variance, we will work with the series in logarithms17.
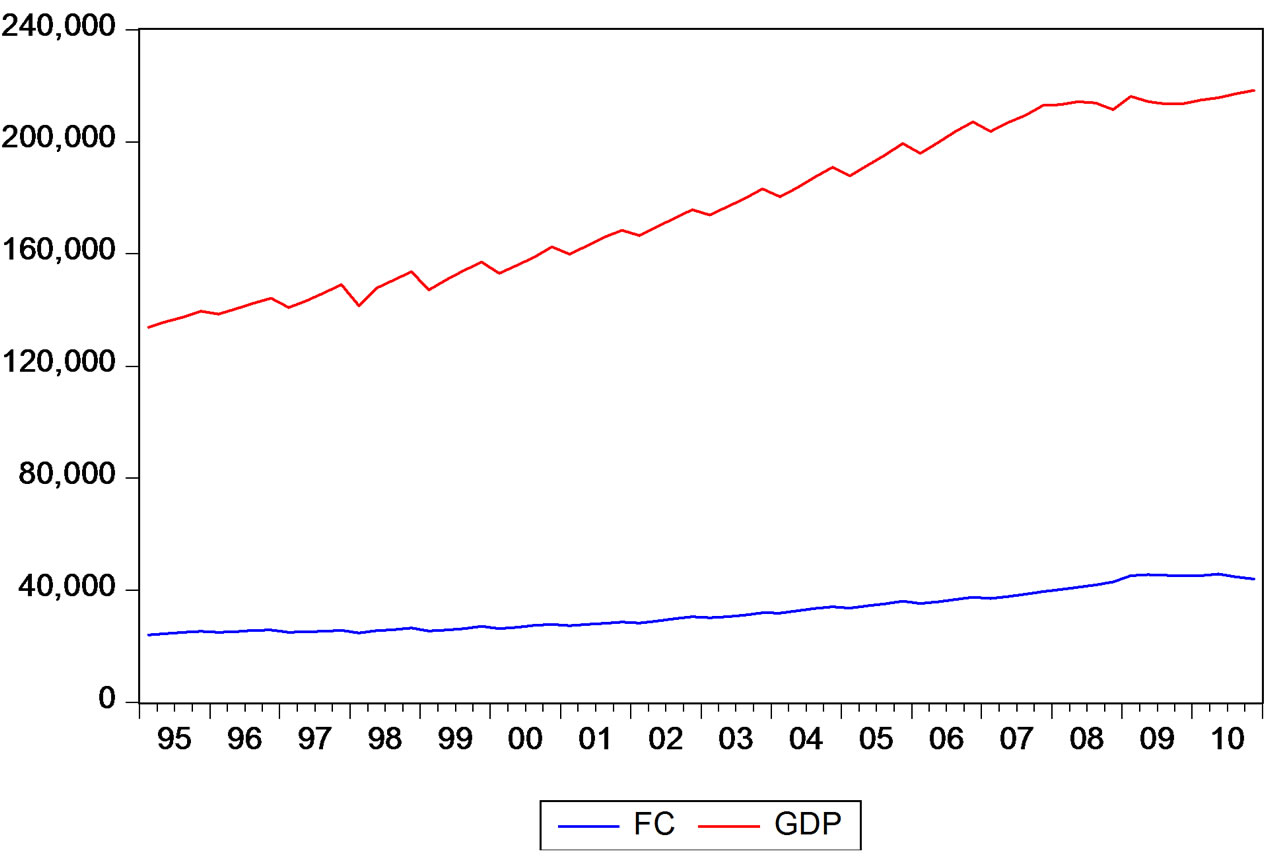
Figure 5. Evolution of general government spending and GDP (quarterly data). Source: Calculations based on data from the Spanish National Accounts.
By means of tests from augmented Dickey-Fuller (1988) and Phillips-Perron18 (1988) [33,34], we contrasted the hypothesis of “non-stationarity” of the series in logarithms. For this purpose, it is necessary to differentiate the series in the regular and seasonal part, concluding that they are integrated from order 2, I (2): 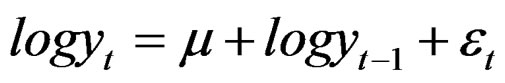 where
where  is stationary, i.e.
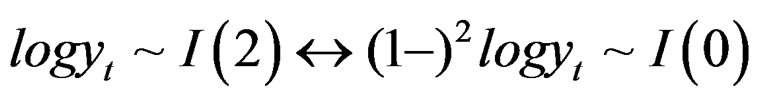 .
.
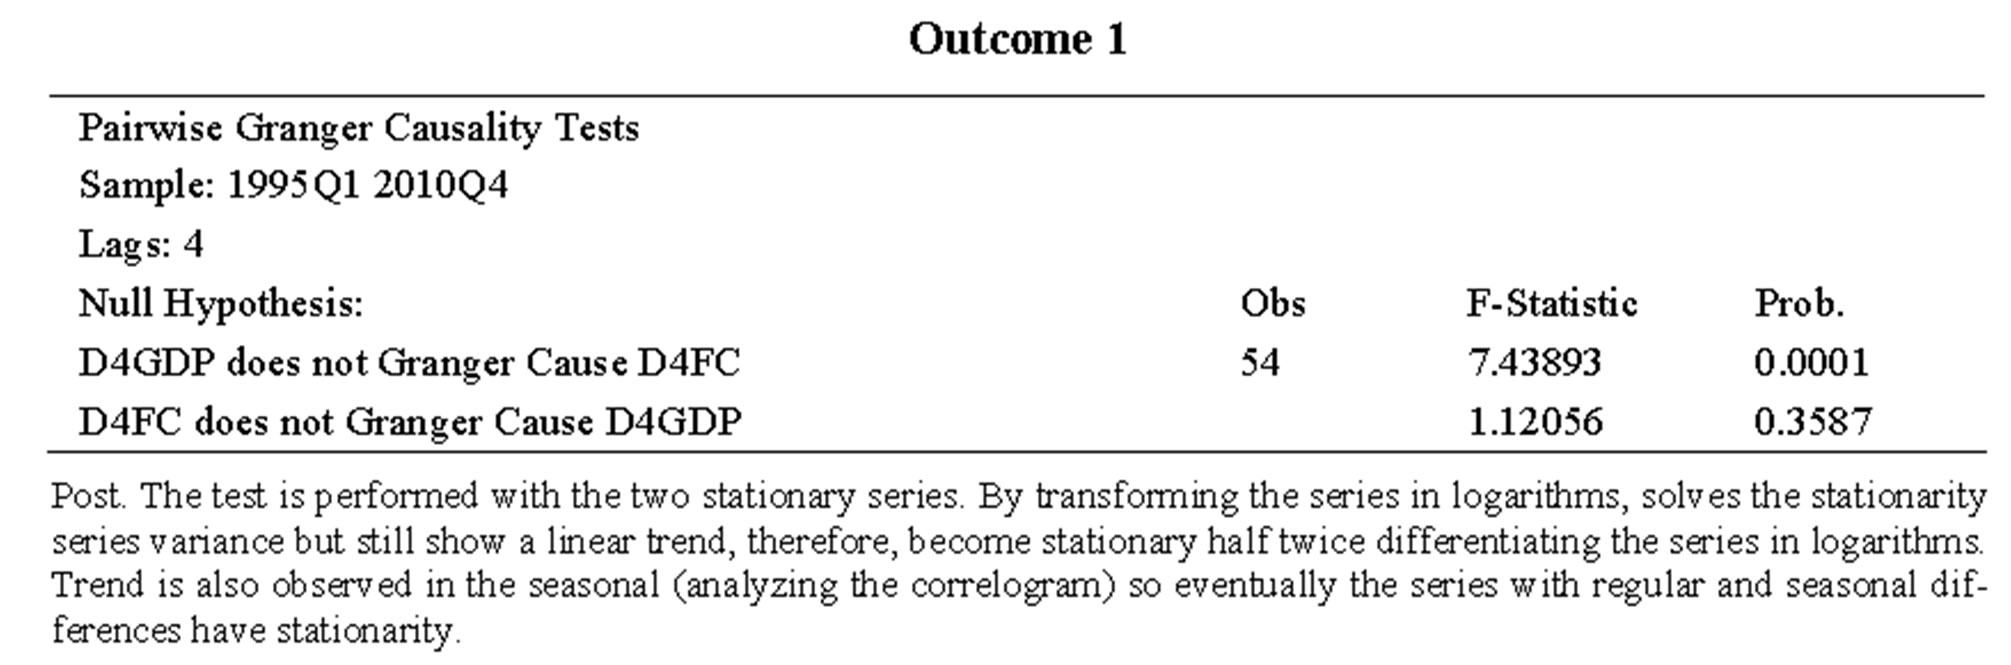
For its part, the Granger causality test (1969) [35-37] (Annex result 1) shows that the hypothesis accepts that “FC does not cause at the Granger at the GDP” and reject the hypothesis that “GDP does not cause FC”. That is to say, delayed values in FC have a significant impact on aggregate output. While it is necessary to consider whether a cointegration relationship exists between the two variables, given that we have to take into account the possible existence of long-term relationships, this test helps establish the endogeneity of VAR variables [38].
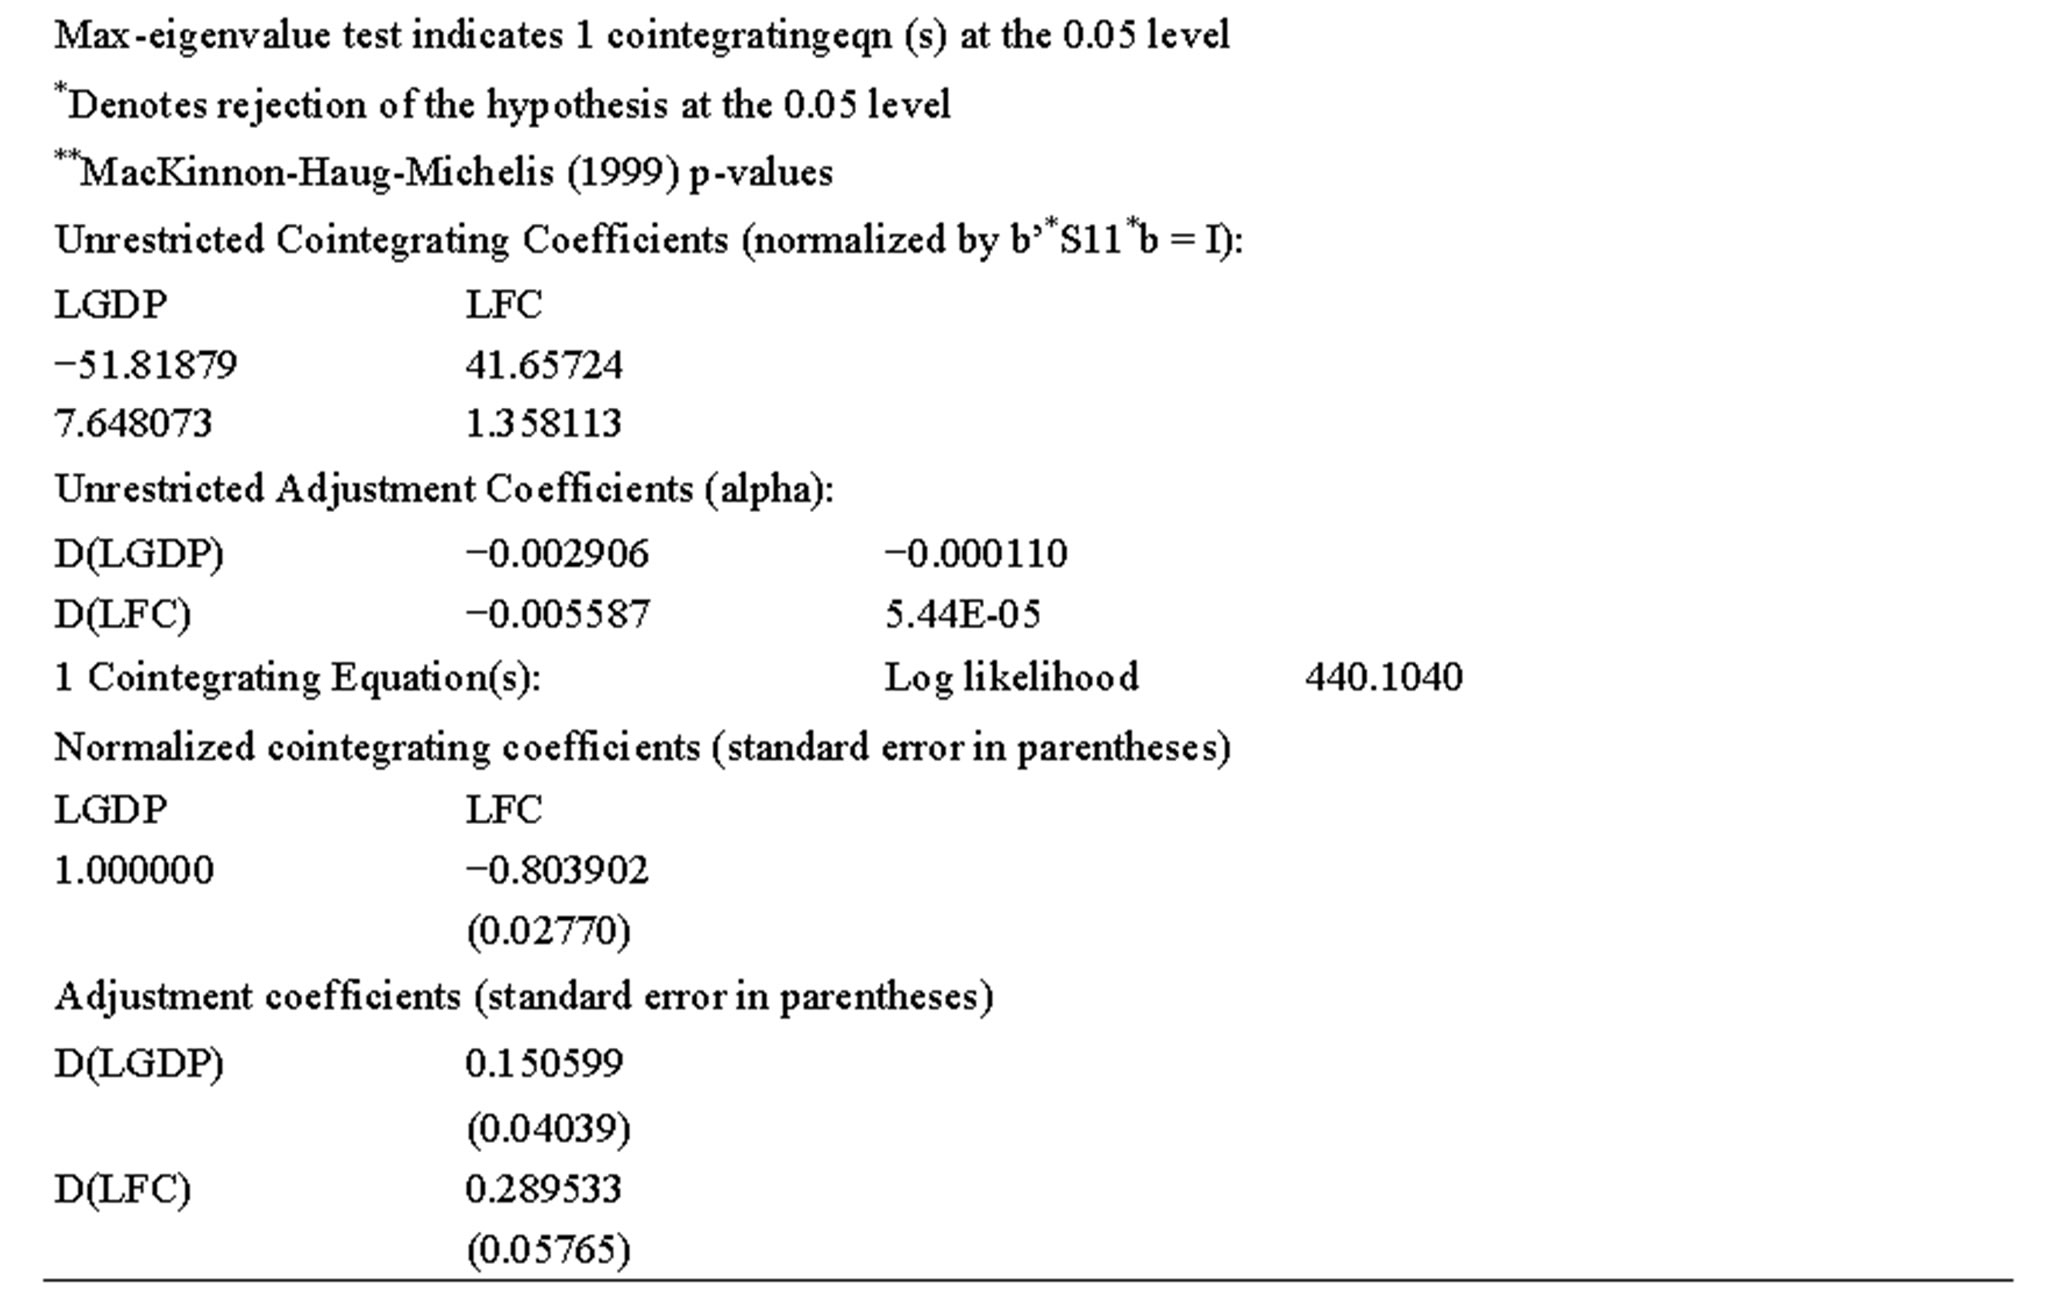
Through a cointegration analysis, as a step prior to series bivariate modelling, the existence of a stable equilibrium relationship is checked between long-term time trends in public spending and GDP. The Johansen test (1988,1991) [35,39-41] (Annex 2 outcome) indicates the existence of a cointegration relationship between the variables, assuming a model with a constant term in the equation of integration and four lags to employ19. Once the cointegrating range is identified the VAR (Vector autoregression) model is estimated with cointegrating vectors (VEC) [21]. This model incorporates three dummy variables20, obtained from the intervention analysis of the series in its univariate modelling process. The result of the joint model21 with the multivariate error mechanism (VAR-ECM)22 indicates that it is significant and bidirectional (as shown in Annex 2 of the result). We must warn that GDP and CF variables are closely linked in the long run and also interact with each other in the short term, as shown in Table 8.
In the estimated model, the cointegration equation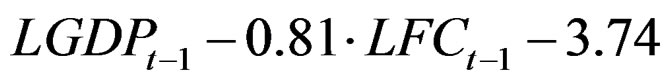 , shows that in the longterm positive sign of FC follows the theoretical postulate and reflects the adjustment of the final spending expenditure, while the estimated and significant coefficients for the speed of adjustment of each of the equations with respect to the relationship of the long-term equilibrium identified a1 = 0.151 and a2 = 0.289, show that the two series are affected by deviations from this relationship.
Then the impulse response functions or the decomposition of the forecast error variance for each series examine the effects of a pulse induced on each of the variables, as well as the percentage that each series contributes to the typical deviation of another. Table 9 shows how that before an increase in the growth rate of FC (0.007225), in the following quarter the effect on GDP growth rate is zero, and how from the second quarter an increasing negative effect is produced (−0.000634), which is extended over the periods. Additionally, with a GDP growth rate (0.005987), in the following quarter we observe a positive effect on FC growth (0.004563). However, the relationship is opposite from the second quarter.
The explained variance of the rate of GDP, according to the results displayed in Table 10, is developed by its own dynamics. From the second quarter it increases its contribution to the standard deviation of the prediction error of the FC rate, exceeding 50% (51.93308) after 8 quarters. As for the rate of FC, the share of GDP rate in the standard deviation of the prediction error decreases as of the second quarter.
The main conclusion given by the model of behaviour for the final consumption expenditure of general government and GDP, which is in line with many studies, is the existence of delayed adverse effects on the rate of growth of public spending on growth rate GDP. By the response function of GDP for a boost in public consumption, we estimate that with a lag of two years, an increase in the growth rate of public consumption is falling in the rates of change of aggregate output of −0.006446 pp. The fiscal policy response is greater the higher the temporal
frequency due to the institutional inertia that exists in the public sector.
By extrapolating these results we would be able to accept that the increase in public spending during the 2008-2009 period is higher than the average of the past 15 years. As shown by the annual growth rates in Table 11, it has not positively affected GDP growth. Thus, concerning aggregate, the discretionary expansionary measures implemented throughout the initial years of the crisis from the standpoint of public expenditure had a dubious role in their stabilizing effect.
3.3. Equilibrium Relationship between Public Investment and GDP
As already noted, studies agree that public investment is a positive factor for economic growth and in this sense,
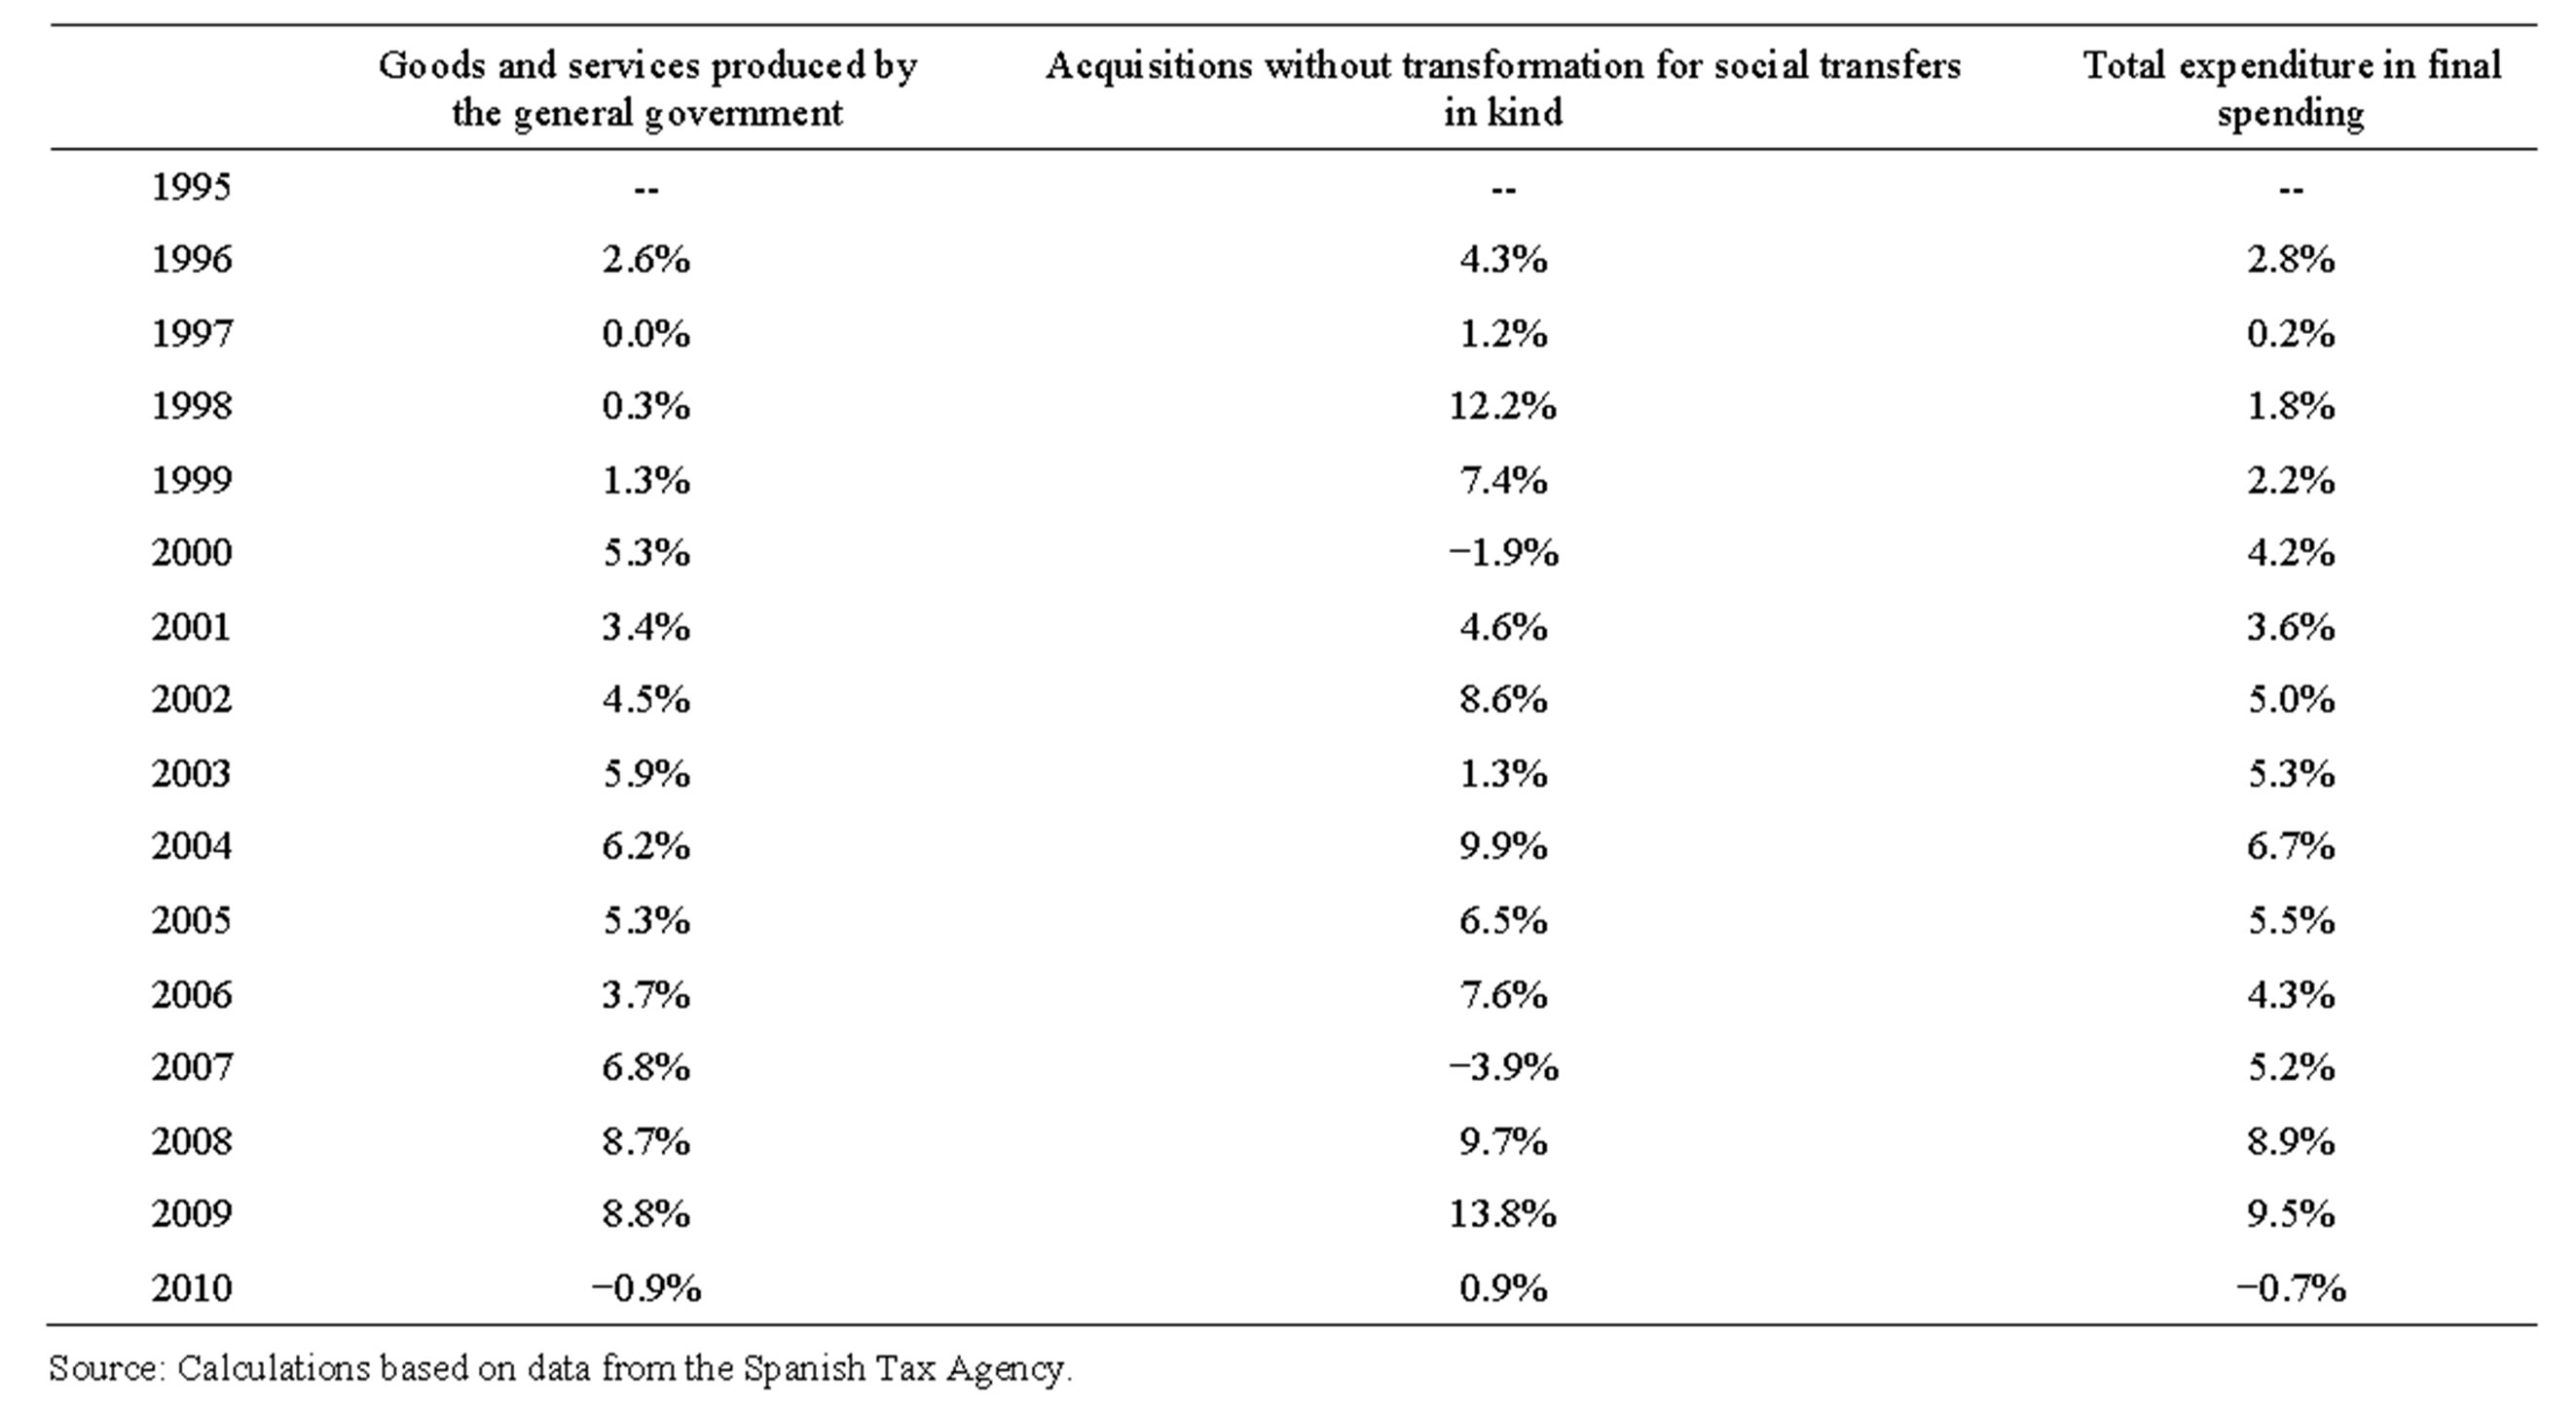
Table 11. General government rates of growth in final consumption expenditure by component, in current terms (1995-2010).
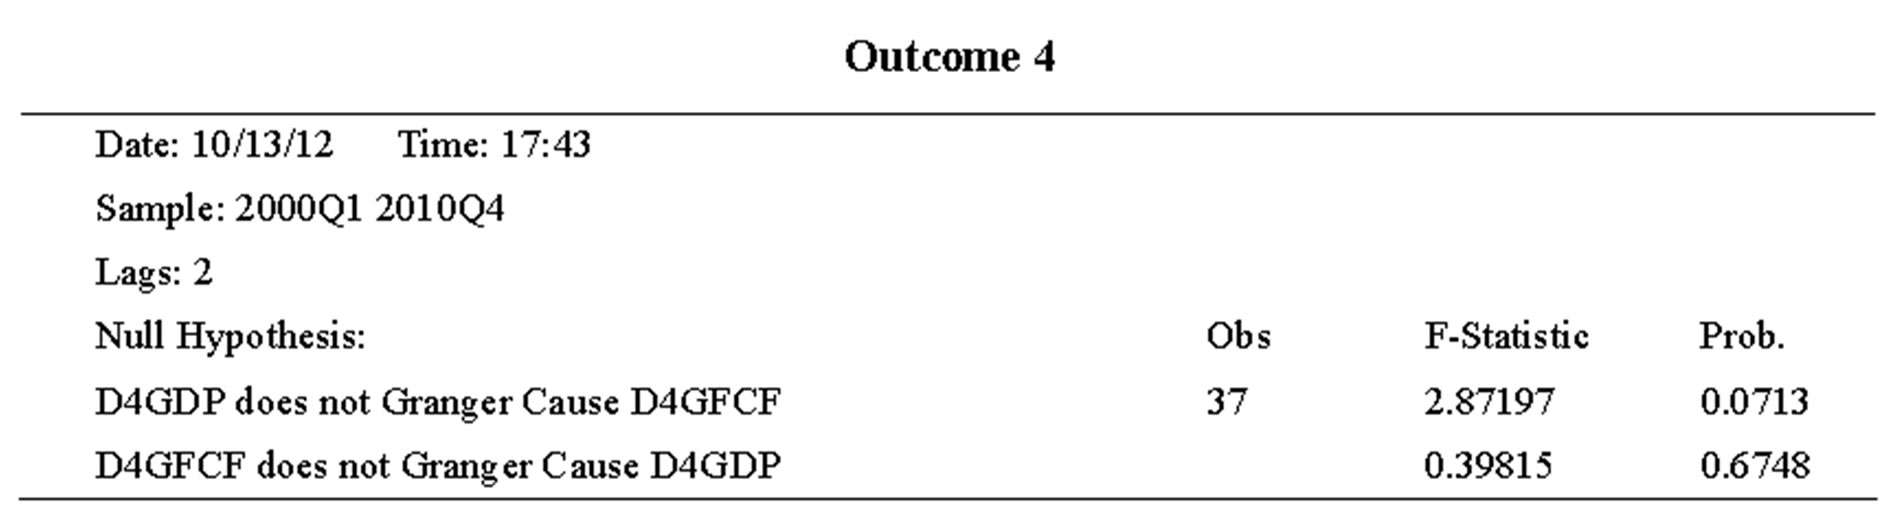
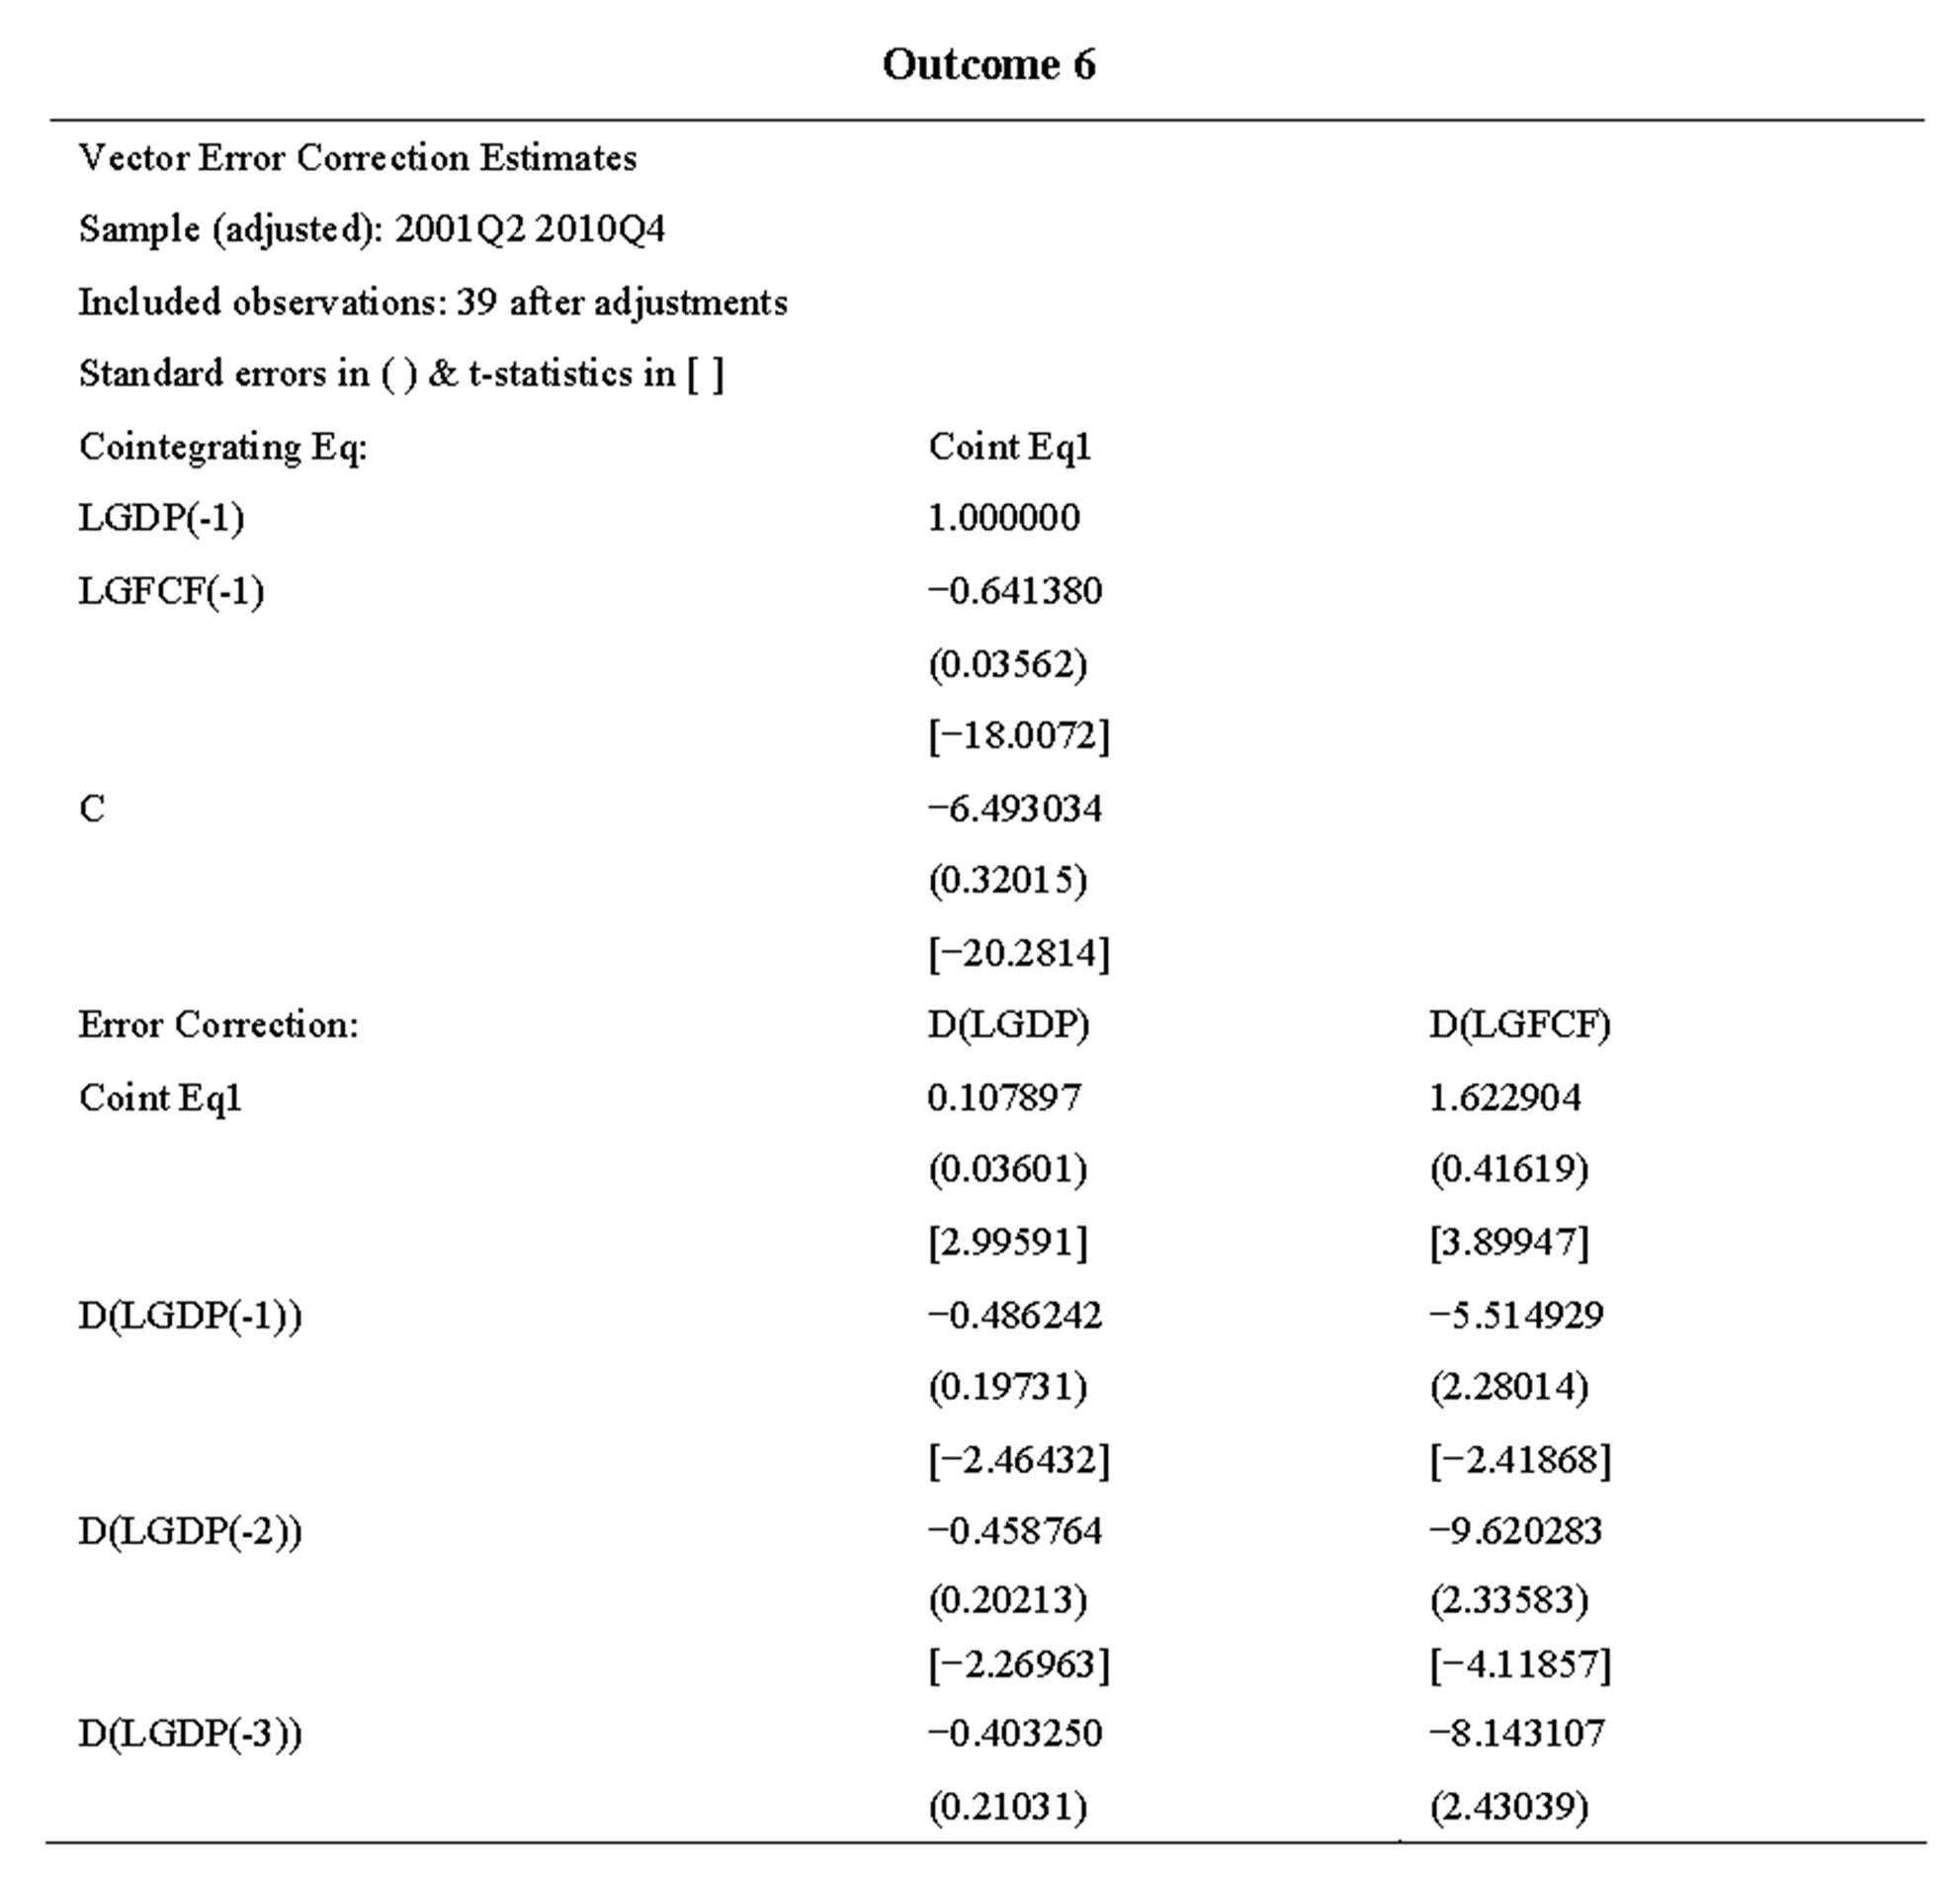
we analysed the impact of public investment by government—gross fixed capital formation by government (GFCF)23—on economic growth through a new bivariate model24. The result of the estimate enables us to assert that GDP and GFCF are closely related variables in the long run, which in turn interact with each other in the short term (Annex 4 - 6 outcome), and therefore it is a model that also allows us to anticipate behaviours. As regards the aggregate level, in line with the results offered by empirical literature, a positive relationship is clearly seen between public investment and economic growth.
Specifically, it appears that the effects of a decline in public investment by government on GDP, debated by the impulse response functions of Table 12, are negative on economic growth. Faced with a reduction in the rate of GFCF, and a lag of two years, a reduction in the rate of change of GDP resulted: −0.005853 pp.
In view of these results we can deduce that the delayed effects of the rate of decline in public investment had a negative impact on economic growth. In this regard, some of the expansionary measures taken during the years 2008 and 2009 aimed at public investment by the government, using the second estimated model, represented a positive effect on future GDP. However, the reduction in GFCF that began in 2010, as a measure of
fiscal consolidation, will have a negative impact on future economic growth. This coupled with the growth of general government final expenditure that occurred in the early years of the crisis, as deduced from the first model estimated, may have negatively affected the growth of aggregate output.
We can affirm that in the process of fiscal consolidation and in future actions, it would be necessary to deepen the analysis of government expenditure items on a more disaggregated level. This would be based, for example, on determining a functional classification to analyse its impact on aggregate output and therefore prioritize the items that generate a positive impact on economic growth. These findings are often used as an argument in favour of restructuring public expenditure to increase the proportion of public investment to the detriment of public consumption.
4. Conclusions
From the analysis of the evolution of revenue and expenditure over the past 15 years, we see that from 2007 the differential growth rates between the two is negative: 1) due to the impact of the economic crisis, which clearly reduced revenues and increased general government consumption in the face of GDP decreases, and 2) a set of measures for expansionary economic policy adopted between 2007 and 2009, estimated at 44,146 million euros.
The use of fiscal policy beyond automatic stabilizers overflowed the deficit and public debt during that period, thus highlighting the existence of weaknesses in institutional performance: 1) to overestimate the scope to implement countercyclical measures and resulting insufficient contexts for fiscal discipline and 2) the existence of faults detected in the analysis of the ability of fiscal policy, due to increased interest payments and the disappearance of the windfall in the real estate sector.
We have analysed the situation that displays the depletion fiscal space, and due to the short-term objective of the Spanish economy to adapt budgetary policy to the stability policy, and once adjudicated the effects of aggregate public spending and its composition as an instrument of fiscal policy. Thus, through the development of two bivariate relationship models that cointegrate (and that anticipate the effect on the evolution of the Spanish economy), we have evaluated the impact of the final consumption expenditure of the general government and public investment on GDP, with the objective of analysing the role of fiscal policy implemented in the early years of the crisis and predict future behaviour, thus we can say that: 1) starting from the first model, the growth of public spending has had a positive impact on GDP, despite some of the measures for public investment by the government, 2) taking the second model, some of these measures have had a positive impact, but, conversely, we should note that a significant reduction in public investment, a result of the tax consolidation process, will have negative effects on future economic growth.
Hence in the future, the focus should be on action by government in production investments that in the medium to long term contribute to a real change of economic growth model, based mainly on industry and value added, and which allows some stability in government revenue. And secondly, it seems advisable to develop efficient mechanisms for monitoring and controlling the budget to focus on efforts to reduce the deficit and public debt in items that minimize their impact on economic growth.
Annex
Outcome 1

Outcome 3
Outcome 4
Outcome 6
NOTES
1Approved by the Council of Europe on 12th December 2008.
2Royal Decree-Law 8/2010, of 20 May, which gives extraordinary measures to reduce the deficit, by the Spanish Government [8].
3Expansionary fiscal measures in the field of revenue and expenditure are described in other sections of the same subsequent study.
4According to data from the Bank of Spain and the Ministry of Economy and Competitiveness [9,10], the savings rate of Spanish households experienced very intense changes: an increase of 7 percentage points (pp) between 2007 and 2009 and a decline of 5 percentage points since early 2010 until today. In turn, the savings rate fell from 10.4% in 2007 and 17.8% in 2009 to 13.1% in 2010.
5Law 35/2007, of 15 November, which establishes the tax credit for birth or adoption in the Income Tax of Individuals and the economic benefit of a single payment by Social Security for birth or adoption; Royal Decree 2/2008, of 21 April, on measures to boost economic activity; Law 4/2008, of 23 December, which abolishes the wealth tax, widens the monthly refund system in the value added tax, and introduces other changes in tax regulations. All of them by the Spanish Government [8].
6Law 35/2006, of November 28, on Personal Income Tax and partially amending the laws on corporate taxes, on the income of non-residents and on capital, by the Spanish Government [8].
7According to the settlement of the Government Budget in 2008 provided by the Ministry of Economy and Finance, revenues from taxes on income suffered a drop of 14,606 million euros with regards to the initial budget [5,6,9].
8As defined in ESA95 (European System of National and Regional Accounts 1995).
9Royal Decree Law 9/2008, of 28 November, which creates a Local Investment Fund and a Special State Fund for the Revitalization of the Economy and Employment as well as extraordinary credits that can be approved to meet their financing; and Royal Decree Law 9/2009, of 26 June on bank restructuring and strengthening the resources of credit institutions, which creates the Fund for Orderly Bank Restructuring (FOBR). All of them by the Spanish Government [8].
10According to National Accounts data provided by the Bank of Spain.
11A reasoning that appeared in the 2010 General State Budget.
12According to Eurostat, the statistical office of the European Commission responsible for producing data on the European Union, the Gini coefficient, a measure of inequality, has grown dramatically in Spain in the last four years. It has increased from 31.3 in 2008 to 34 in the latest data compiled [4].
13This would help us try to overcome the criticism about the possible presence of reverse causality or endogeneity of government spending on aggregate output.
14According to their argument, the selection of the sample and the method can determine the outcome, so that the use of data from rich countries leads to supporting a negative relationship between public spending and growth and the opposite if the sample comes from poor countries.
15The data used are limited to the period from 2000 to 2010, with quarterly periodicity, as available in the National Statistics Institute [7].
16The nonstationarity of the time series is a problem that could generate spurious regressions. This does not allow the use of large sample theory to validate estimation and inference in the linear model. From an economic standpoint, the presence of unit roots means that the effect of a stock last forever, therefore cyclical fluctuations cannot be studied separately from the long-term components, besides the long-term trends not being fixed.
17Previously, we conducted an intervention analysis of the series for aggregate public spending and GDP, modelling data that are considered abnormal or extreme due to its magnitude.
18A more general contrast than the augmented Dickey-Fuller test (Dickey-Fuller 1988) whereby an AR(p) process is followed, although it is not necessarily considered a white noise, but allows it to be an ARMA or a process with heteroscedasticity.
19According to the criteria of Akaike and Schwarz.
20FIC1, is the dummy variable that assigns value 1 for the period 2009Q2-2009Q4, FIC2, to period 2008Q1 and FIC3 to period 1998Q1.
21The model residuals have a white noise structure. From the diagnostic tests to the model errors, we conclude that there is normality in the model (Jarque-Bera test), without autocorrelation problems (Lagrange Multiplier test) and no problems in the heteroscedasticity model (White test for uncrossed terms).
22The error correction model VEC correctly represents the dynamic behaviour of the model series and expresses this change in the depend- ent variable as a linear function of changes in the explanatory variables and the error correction term.
23The period considered begins in the first quarter of 2000, in the ab- sence of previous data on a quarterly basis [7].
24We followed the same procedure used for the previous methodologycal model and checked that the model residuals have a white noise structure.