Groundwater Quality and Identification of Hydrogeochemical Processes within University of Lagos, Nigeria ()
1. Introduction
Ground water is an important source of water supply in many parts of the world and the most important source of drinking water for 70% of Nigerian population. It is widely distributed under the ground and it is a replenishable resource unlike other resources of the earth.
One of the most important crises of the twenty-first century is the scarcity of drinking water. Most freshwater bodies of the world over are becoming increasingly polluted, thus decreasing the potability of water [1]. The University with population of students and staff totaling fifty thousand (50,000) depends on groundwater for water supply. This has led to disproportionate sinking of boreholes by all organs of the University community in a bid to meet the water need of their units. In all, about thirty (30) water boreholes distributed across the campus were located, with at least twenty one (21) of the boreholes functioning as at the time of the research work.
Chemistry of groundwater is an important factor determining its use for domestic, irrigation and industrial purposes. Interaction of groundwater with aquifer minerals through which it flows greatly controls the groundwater chemistry. Hydrogeochemical processes that are responsible for altering the chemical composition of groundwater vary with respect to space and time. In any area, groundwater has unique chemistry due to several processes like soil/rock-water interaction during recharge and groundwater flow, prolonged storage in the aquifer, dissolution of mineral species, etc. [2].
According to world health organization 40% or more of the disease outbreaks are attributed to polluted groundwater consumption. Thus, it is absolutely necessary to ascertain the potability of water before it is used for human consumption. Therefore, in the present study, an attempt is made to determine the chemical characteristics of groundwater within University of Lagos and its suitability for both drinking and irrigation purposes.
2. Study Area
University of Lagos is located within Lagos, Southwestern Nigeria. The campus is nearly encompassed by water bodies with Lagos laggon on the east, swamp in the north and canal in the west curving the southward (Figure 1). Topography is generally low and characterized by torrential rainfall with a shallow water table (as shallow as 0.5 m around the coast). The geology of the area is characterized by two bands of sand separated by silty mud lying within the Dahomey Basin. Dahomey Basin, a combination of inland/coastal/offshore basin that stretches from southeastern Ghana through Togo and the Republic of Benin to southwestern Nigeria has been variously described by many workers like [3-6]. Though there has been a nomenclature problem in the stratigraphy of the Dahomey Basin [6], the age range is from Cretaceous to Tertiary. Lagos mainland is underlain by sediment of Cretaceous through Tertiary to Quaternary. Quaternary sediments are alluvial deposits, covering most part of the Lagos Coastal areas and river valleys.
3. Material and Methods
Twenty one boreholes and one lagoon water were collected at several locations within University of Lagos and analyzed for 73 constituents and physical properties. The samples were taken from boreholes located in different part of the University of Lagos (Figure 2). Several sensitive parameters of water such as total dissolved solids
(TDS), electrical conductivity, temperature and pH were determined during the on the spot sampling using the appropriate digital meters (e.g. water treatment works (WTW)-conductivity metermodel L/92 and WTW-pH meter model pH/91). Water samples of approximately 125 mL were collected for multi-element analysis; pressure filtered through 0.2 mm Nuclepore membranes and 3 mL analytical grade HNO3 was added to bring the water acid solution to a pH ~ 2. The analysis of trace elements and cations in water were carried out using inductively coupled plasma optical emission spectrometry (ICP-OES. All the analyses were carried out at the ACME laboratory, Ontario Canada. To check the accuracy; activation laboratories (Ontario, Canada) employed two internal standards (each run twice) and found that the errors were consistently minimal. Parameters such as Sodium Adsorption Ratio (SAR), Soluble Sodium Percentage (SSP), Magnesium Adsorption Ratio (MAR), Kellys Ratio (KR) were also calculated from the result to determine the suitability of the water for irrigation purpose using the equation in [7]. Results were further compared with recommended standards and pollution index as well as other hydro-geochemical parameters were calculated to determine the water geochemistry and its quality for both drinking and irrigation purposes.
4. Results and Discussion
More than one quarter (20) of the 73 constituents analyzed for were not detected above the laboratory reporting levels (LRLs) in any sample. Result summary of the remaining 53 constituents and physical properties which include range, mean, standard deviation were presented in Table 1 for physical and major elements and Table 2 for trace elements. Analytical results for significant elements
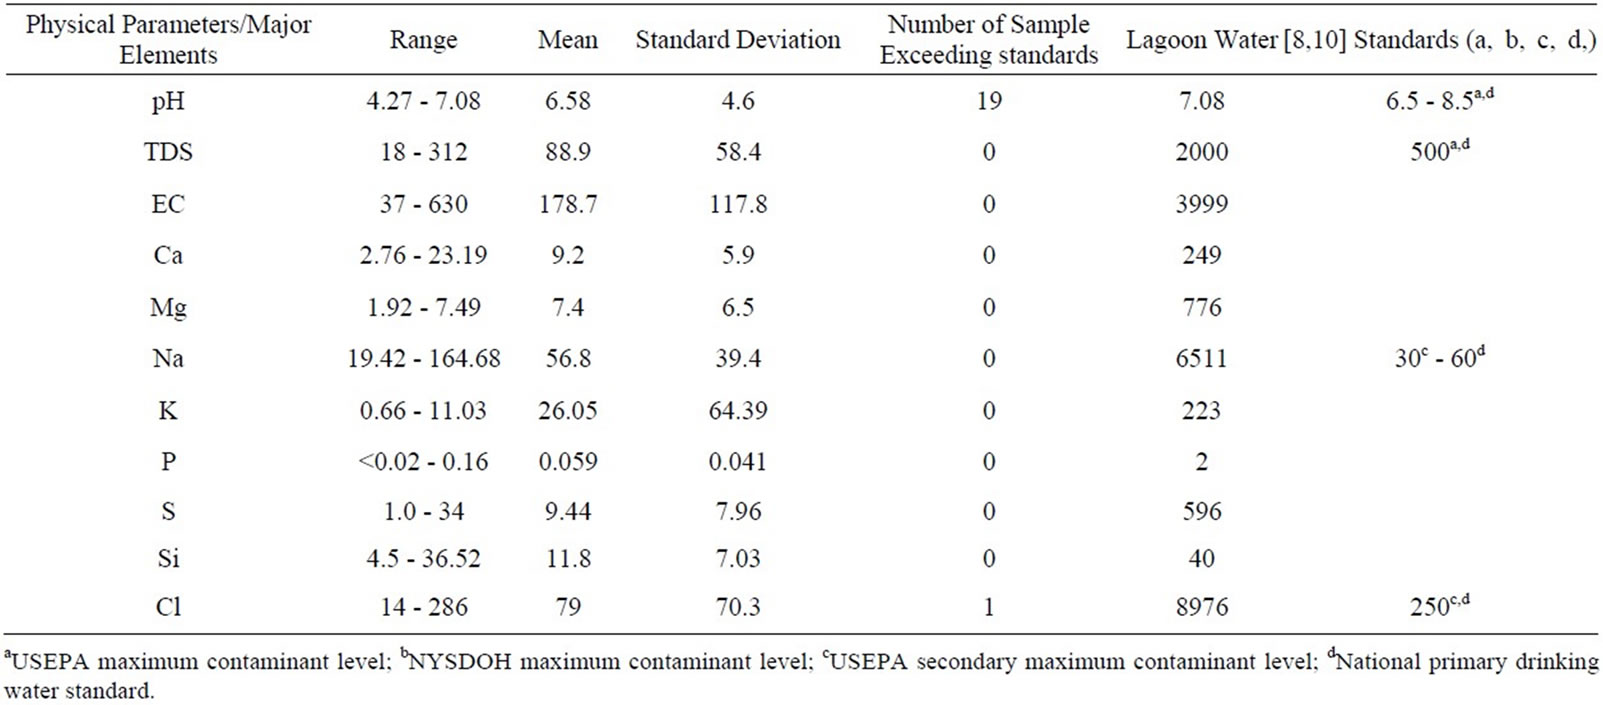
Table 1. Summary of physical/major elements in university of Lagos water.
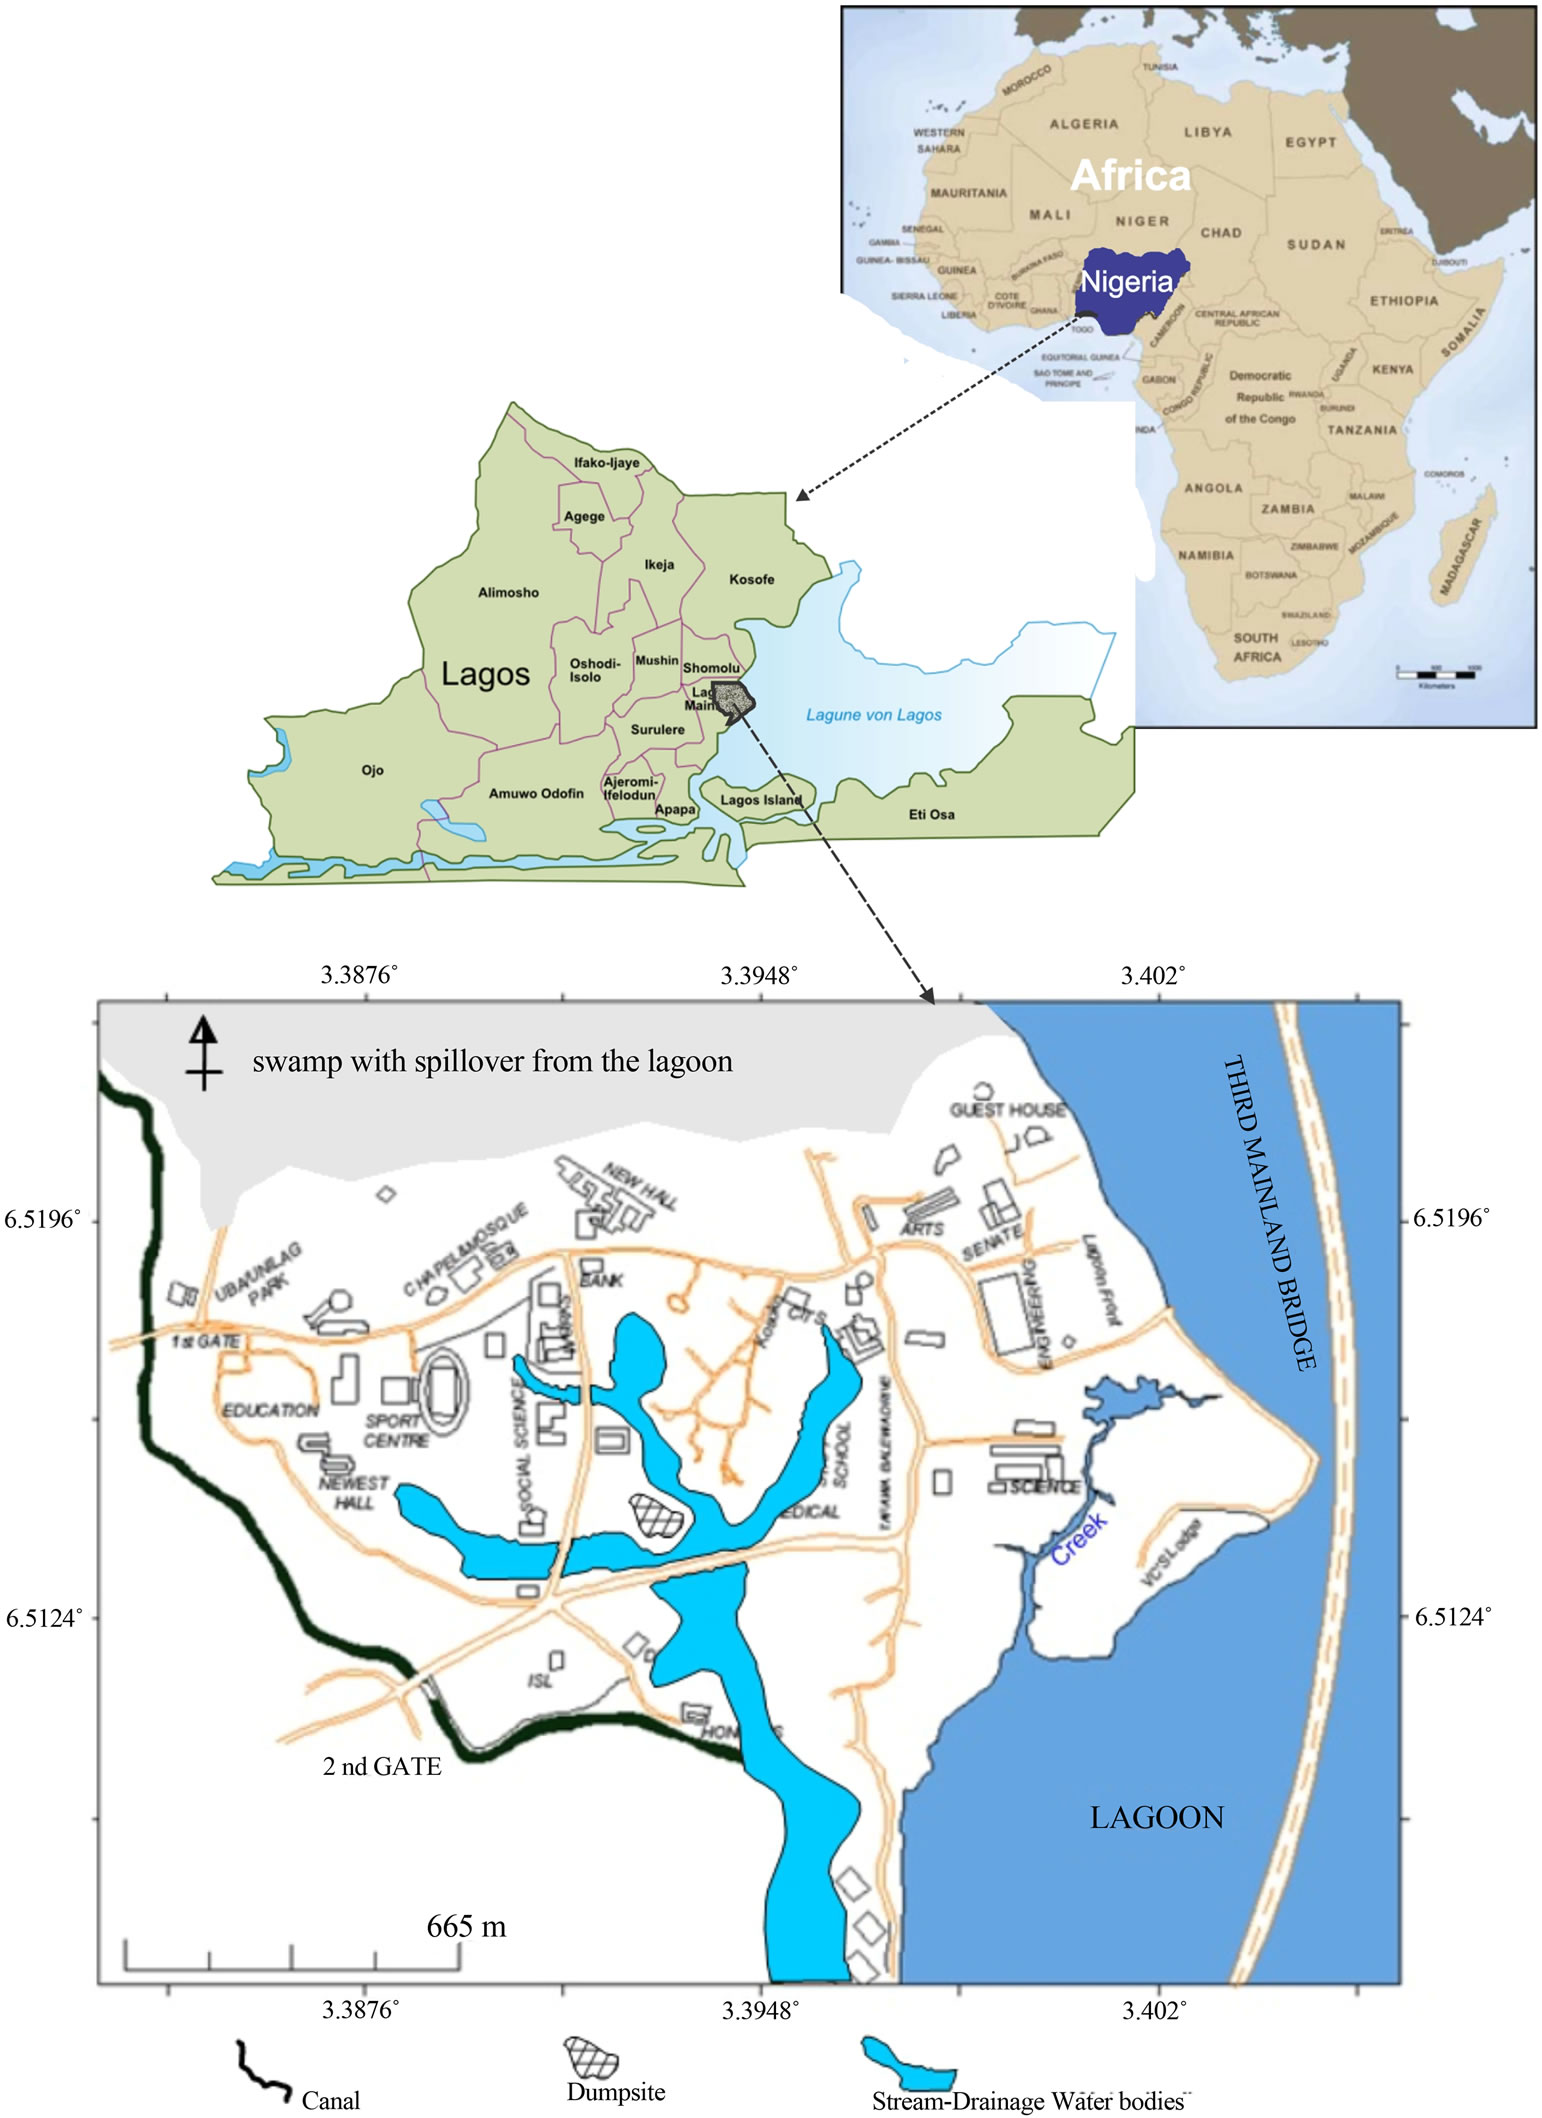
Figure 1. The map of university of Lagos campus.
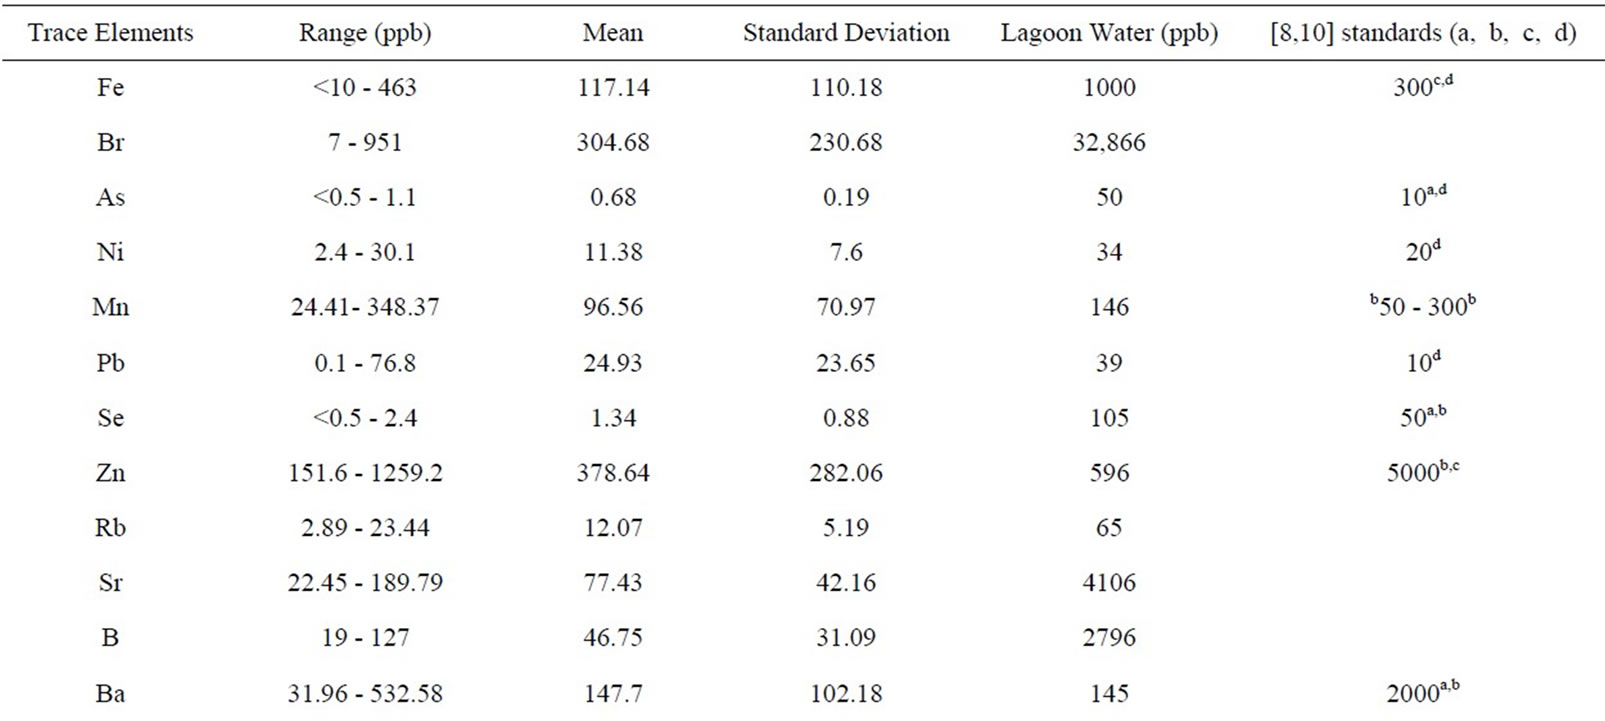
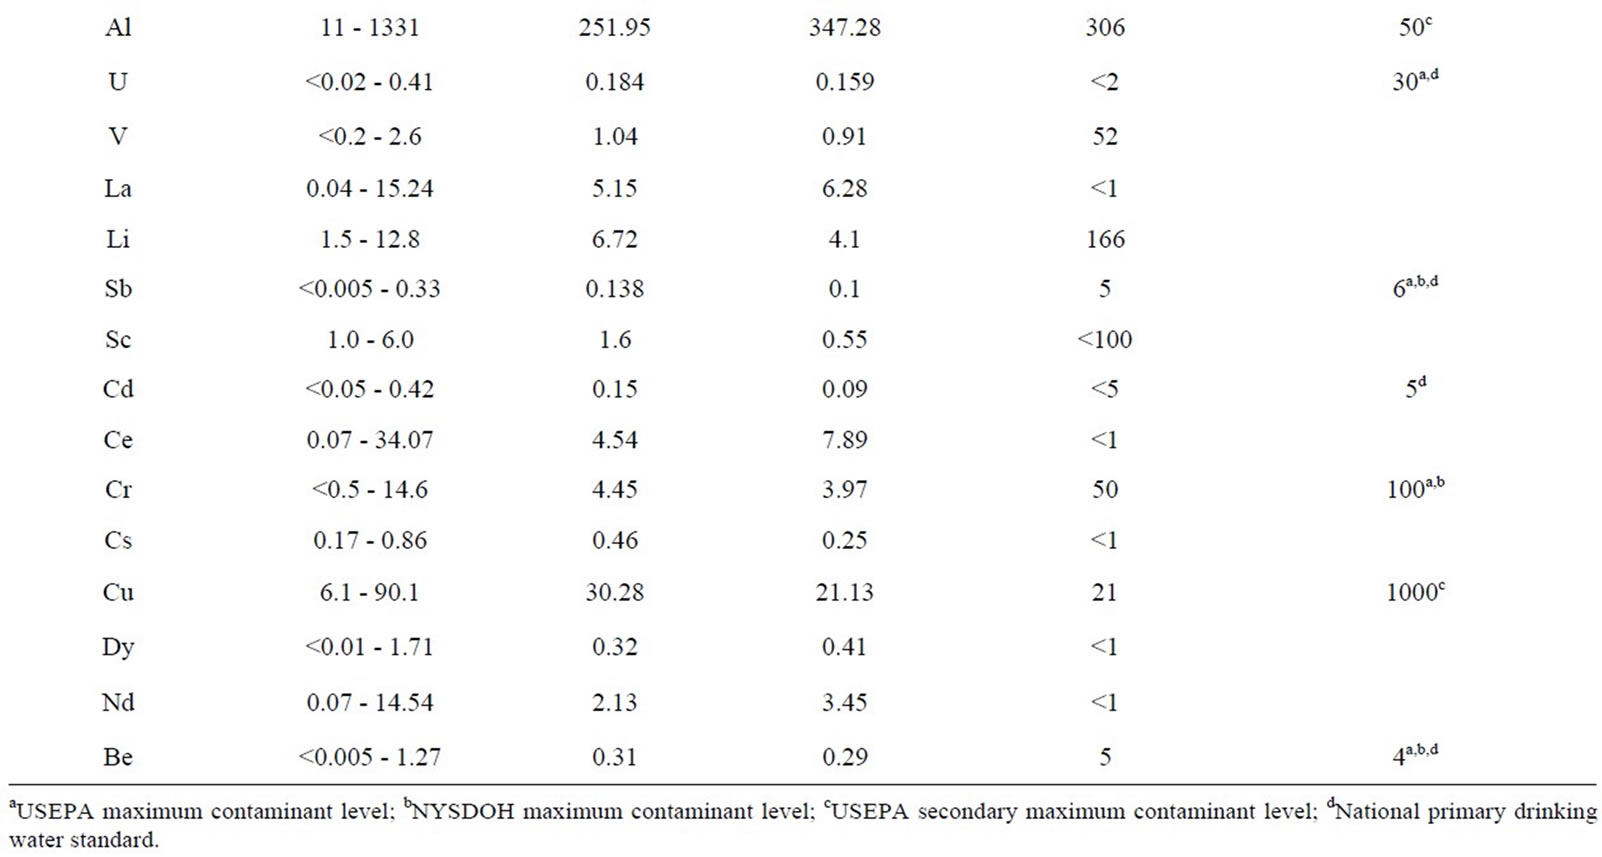
Table 2. Summary of trace elements in university of Lagos water.
were compared with National Primary Drinking water standard and United State Environmental Protection standards (USEPA). The standards include Maximum Contaminant Levels (MCLs), Secondary Maximum Contaminant Levels (SMCLs) established by the [8-11] and [12]. MCLs are enforceable standards that specify the highest level of a contaminant that is allowed in public water.
4.1. Groundwater Geochemistry
Groundwater samples of university of Lagos are both slightly acidic and alkaline with pH ranges between 4.21 and 7.08 and mean of 6.8 (Table 1). 78% of the samples exceeded [11,12] standards. The temperature of the water ranged from 28.9˚C to 31.5˚C; the mean was 30.2˚C. Electrical conductivity (EC) and Total Dissolved Solids (TDS) of the samples ranged from 37 to 630 μS/cm, and 46 to 312 mg/l while the mean values were 117.8 and 88.9 respectively. EC and chloride show large variation between minimum and maximum value and also express high standard deviation. This inference suggests the influences of complex contamination sources and geo-
chemical process as well as inhomogeneous water chemistry in the study area (see Table 1). All the water samples can be classified as fresh water and are within the recommended standards of 500 mg/l for TDS [11,12]. All the samples are also colorless and odorless.
Chloride concentrations ranged from 14 to 286 mg/L and the mean was 79. All the samples except sample W3 taking at the Marine Science department fall within [11, 12] of 250 mg/l as shown in Table 1. The cations that were detected in high concentrations were calcium, magnesium, phosphorus, sulfur, silica and potassium. Their concentrations ranged from 2.76 to 23.19 mg/L, 1.58 to 27.49 mg/l, <20 to 162 mg/l, 1 to 34 mg/l, 5.21 to 36.5 mg/l and 0.66 to 12.5 mg/l while the mean values were 9.72, 7.8, 60.14, 10.12, 11.98 and 6.10 respectively.
Fourteen samples exceeded the USEPA non-regulatory drinking-water advisory taste threshold for sodium which recommends that concentrations in drinking water must not exceed the range of 30 to 60 mg/L [8,10], Table 1. The remaining cations fall within the recommended standards.
4.2. Hydrogeochemical Processes
Water quality is determined by reactions between groundwater and aquifer minerals which are also useful to understand the genesis of groundwater [13]. Since the study region experiences wet and dry climatic condition which promote weathering, this may also contribute to water chemistry in the area. Hence, Gibbs plot is employed in this study to understand and differentiate the influences of rock-water interaction, evaporation and precipitation on water chemistry [14]. Figure 3 illustrates that all the groundwater samples fall in the water-rock interaction field which suggests that the weathering of rocks primarily controls the major ion chemistry of groundwater in this region.
4.2.1. Effect of Silicate Weathering on Water Chemistry
The ratios between total cations and Na + K as well as Ca + Mg are 0.99 and 0.88 respectively (Figure 4). This observation showed the involvement of silicate weather-
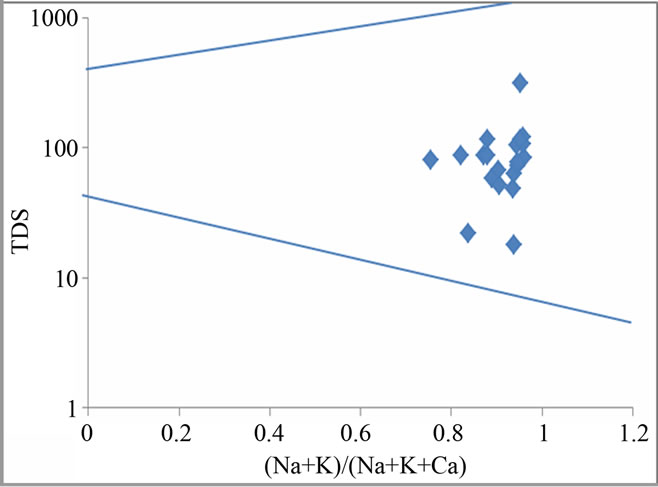
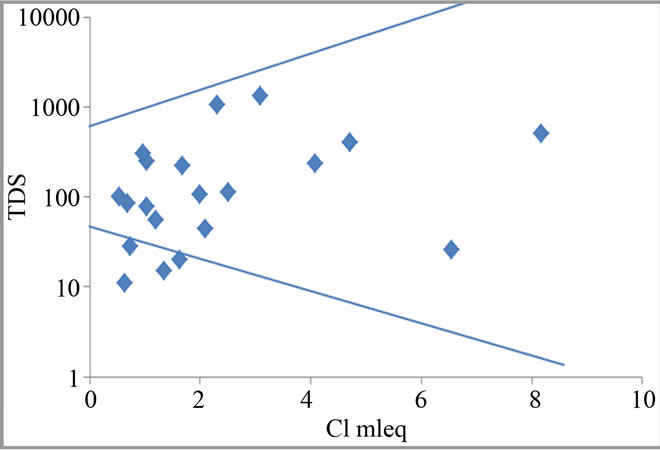
Figure 3. Gibbs plots explain groundwater chemistry and geochemical process in the study region.
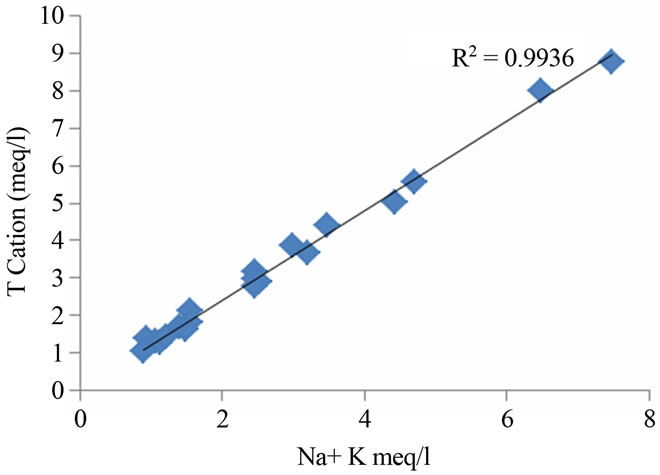
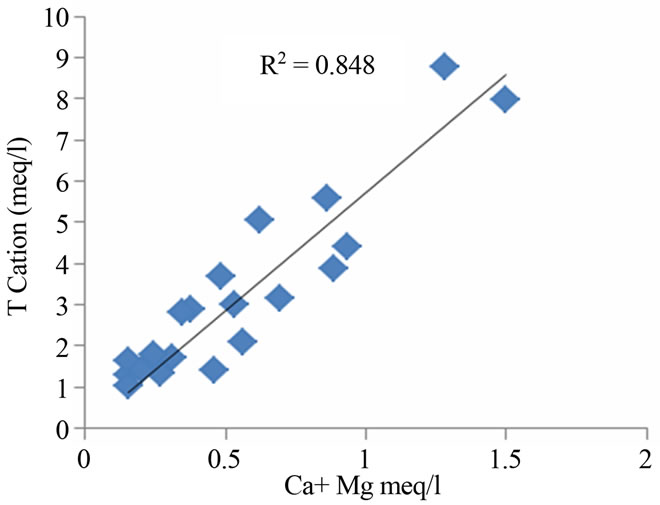
Figure 4. Relation between total cation, Na + K and Ca + Mg in the study region.
ing in the geochemical processes, which contribute mainly sodium, calcium and potassium ions to the groundwater [15,16]. Weathering of soda feldspar (albite) and potash feldspars (orthoclase and microcline), which are common in sand and clay occurring in this area is greatly responsible for the contribution of Na+ and K+ ions to groundwater. Feldspars are more susceptible for weathering and alteration than quartz in silicate rocks. The average Ca2+ + Mg2+/Cl and Na+ + K/Cl− equivalent ratio of 0.27 and 0.88 suggest the influence of the sea water also. The regional geology also implies that the alkali earth silicates occur everywhere in the area (Figure 5).
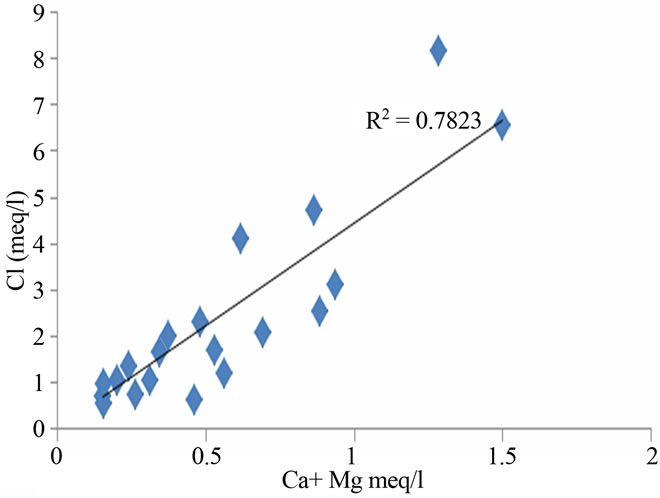
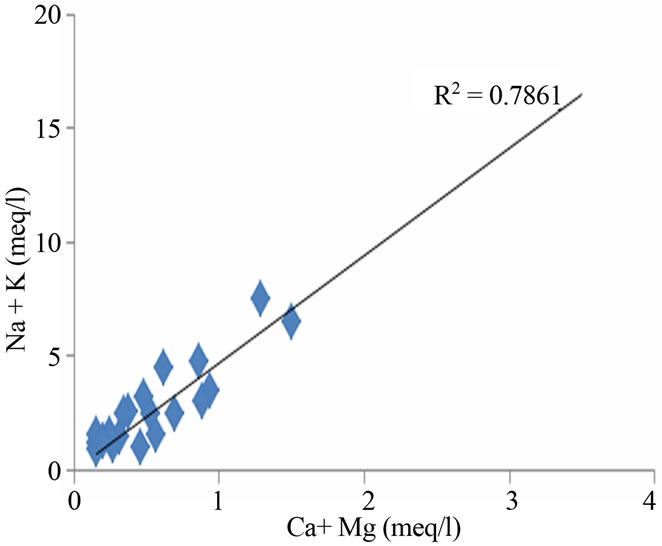
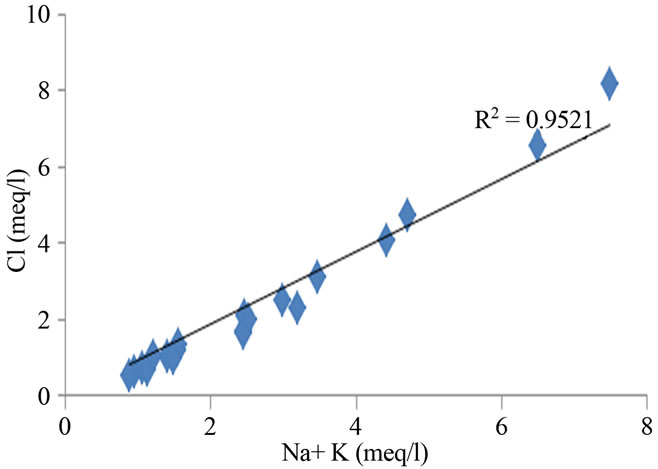
Figure 5. Relation between total cation, Na + K and Ca + Mg in the study area.
4.2.2. Ion Exchange
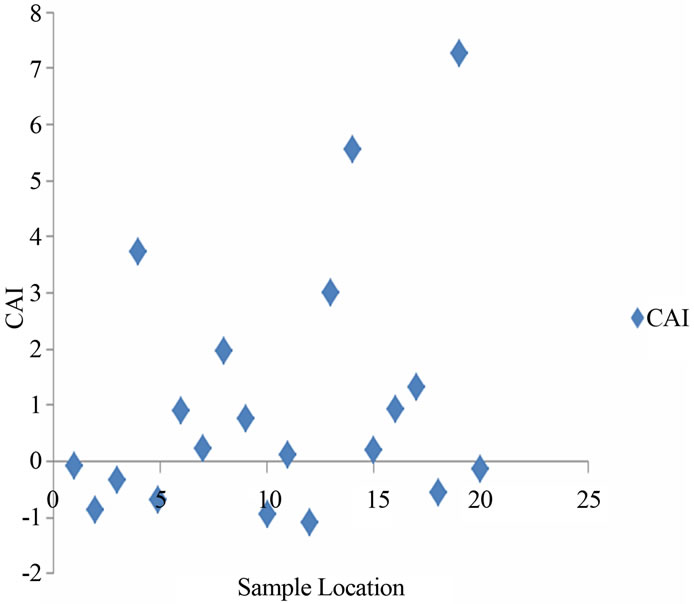
One of the important processes responsible for the concentration of ions in groundwater is ion exchange. Chloro-alkaline index (CAI) calculated for the groundwater samples of the study area strongly suggest the occurrence of ion exchange process.
CAI = C1− − (Na+ + K+)/C1− (All values are expressed in meq/l).
When there is an exchange between Ca or Mg in the groundwater with Na and K in the aquifer material, the above index is negative, and if there is a reverse ion exchange, then the index will be positive [17,18]. CAI values of the study area range between −0.86 to 5.5 (Figure 6(a)). This observation indicates that reverse ion exchange is the dominant process in the groundwater (52%), whereas normal ion exchange is also noticed in 48 % of the water samples.
 (a)
(a)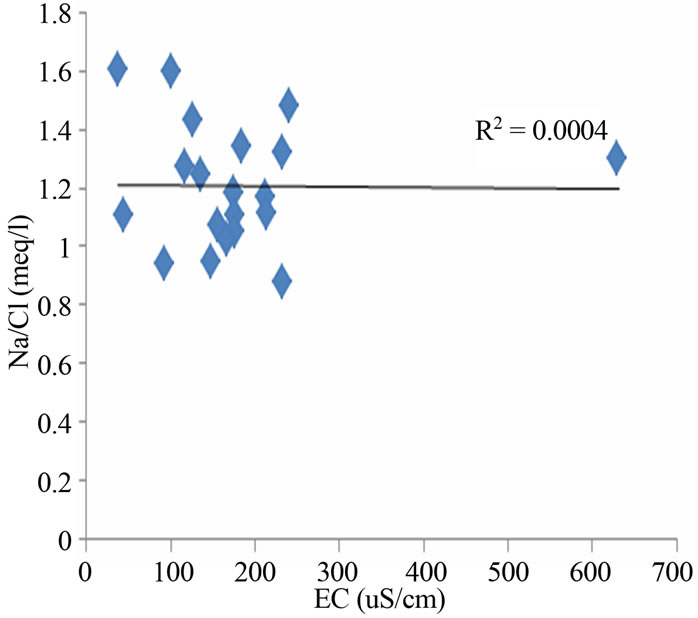 (b)
(b)
Figure 6. (a) Chloro-alkaline index (CAI) indicating ion exchange process in the study area; (b) Relation between EC and Na/Cl in the groundwater.
4.2.3. Evaporation
Na/Cl ratio can be used to identify the evaporation process in groundwater. Evaporation will increase the concentration of total dissolved solids in groundwater, and the Na/Cl ratio remains the same, and it is one of the good indicative factors of evaporation [19]. If evaporation is the dominant process, Na/Cl ratio should be constant when EC rises [20]. The EC vs Na/Cl scatter diagram of the groundwater samples in the study area (Figure 6(b)) shows that the trend line is inclined, and Na/Cl ratio decreases with increasing salinity (EC) for most samples. This observation indicates that evaporation may not be the major geochemical process controlling the chemistry of groundwater in this study region or ion exchange reaction dominating over evaporation. However, the Gibbs diagrams (Figure 4) also confirmed that evaporation is not a dominant process in the study area but water rock interaction.
4.3. Suitability of Water for Irrigation Purpose
4.3.1. Sodium Absorption Ratio (SAR)
Based on the Sodium Absorption Ratio (SAR = Na+/(Na+ + Ca2+)/2) the water samples range from 1.75 - 8.9 and can be classified as excellent and good for irrigation (see Figure 7 [21]. All the values obtained for the Sodium Adsorption Ratio (SAR) during the present study are generally less than 10 and can be classified as excellent.
4.3.2. Magnesium Absorption Ratio (MAR)
The values obtained for the Magnesium Adsorption Ratio (MAR) within the study area vary between 33.46% - 75.72%. Increasing amount of magnesium in water will
increase the salinity of the water and therefore decline the crop yield [22]. The values obtained in only 33% of the samples are less than 50% considered suitable with no hazardous effects to the soil according to [23], Figure 7.
4.3.3. Soluble Sodium Percentage (SSP)
SSP is frequently used in the determination of the suitability of water for irrigation purpose. In this work, the values obtained for the SSP parameter range between 67.3% - 90.43% According to [24] (Figure 7), 33% of the water samples fall within fair classification of 80% and the remaining samples fall within poor (>80%) for the purpose of irrigation. Also, the ranges of values for the Kelly’s Ratio (KR) obtained for the water samples are 1.82 - 9.17 meq/l. The values obtained are higher than the permissible limit of 1.0 recommended by [23] in all the water samples.
4.4. Trace Elements in Water
Al, Fe, Pb, Mn, Br and Ni exceeded recommended standards in 60.87%, 4.35%, 65.2%, 18.78%, 100% and 13.04% of the total samples respectively. Aluminum concentrations ranged from 11 to 1331 mg/l; the SMCL (50 μg/L) was exceeded in fourteen samples (Table 2). Iron concentrations ranged from <10 (the Laboratory Reporting Level (LRL)) to 463 mg/l; the Federal SMCL and the New York State MCL for iron was exceeded in one sample W5. Lead concentrations ranged from 0.1 to 76.8 μg/L; the [12] (10 μg/L) was exceeded in fifteen samples (Table 2). Manganese, Bromate and Nickel concentrations ranged from 24.41 to 348.87 μg/L, 72 to 95 μg/l, and 2.4 to 30.1 μg/L while the MCLs of 50 μg/L, 10 μg/L and 20 μg/L were exceeded in eighteen, twenty-three and two samples respectively (Table 2).
Some trace elements, Ge, Gd, Ho, Pr,Lu, Tb, Tl and Tm were detected less frequently or at lower concentrations (Table 2) than other constituents. The MCLs for antimony (6 μg/L), arsenic (10 μg/L), beryllium (4 μg/L), barium (2000 μg/L), cadmium (5 μg/L), chromium (100 μg/L), selenium (50 μg/L), zinc (5000 μg/L), and uranium (30 μg/L), and the SMCL for copper (1000 μg/L), Mercury (2 μg/L ), silver (100 μg/L) and thallium (2 μg/L) were not exceeded in any sample. Co, Li, C, Cs, Dy, Er, Nd, Y, Yb, Zr, Lu, Rb and V were detected, but no MCLs have been established for them while W, Th, Ti, Te, Ag, Au, Ga, Hf, In, Nb, Pd, Re, Rh and Ru were below laboratory detection limit for all the samples.
Na showed very weak correlation with Al, Fe, Pb, Ni, Mn and very strong correlation with Br which are significant trace elements in the water samples (Figure 8). This indicates possible anthropogenic sources for all the significant trace elements except Br which could be geogenic.
4.5. Pollution Index (PI)
The pollution index was used in this study to evaluate the degree of trace metal contamination in water samples [25-30]. The tolerable level is the element concentration in the water considered safe for human consumption [31,32]. The [10] were used as tolerable level for water and the pollution index can be calculated by the formulae below;
PI = (Heavy metal concentration in water/Tolerable Level)/Number of Heavy metals.
The PI among all sites varied from 0.26 to 2.86 (Table 3 and Figure 9). Water sample with Pollution index greater than 1 is regarded as being contaminated. 50% of the water samples showed pollution index above 1 (Figure 9) with W5, W11and W18 showed high values of 2.43, 2.86 and 2.13 respectively. Samples W10, W12, W13, W17. W20, W21 and W23 were above 1 with the following values 1.21, 1, 10, 1.40, 1.06, 1.37, 1.56 and 1.29 respectively. Pollution index for samples W1, W2, W4, W5,
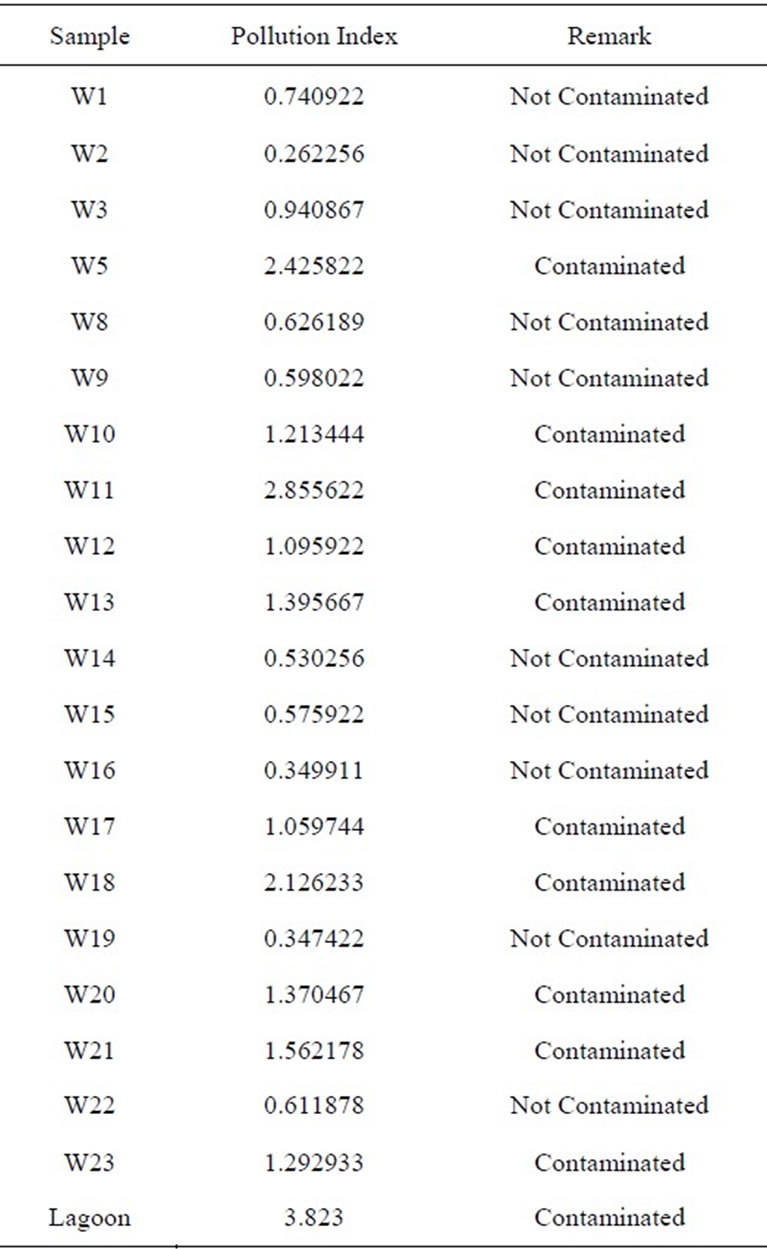
Table 3. Polution index values per location for the study area.
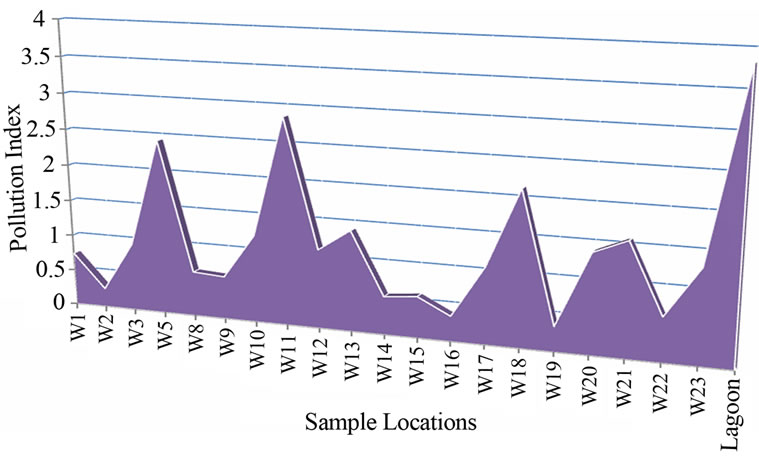
Figure 9. Polution index plot for borehole and lagon water in the study area.
W8, W9, W14, W15, W16 and W19 respectively were below 1 (Table 3 and Figure 9). Lead contributed the highest percentage (37.8%) to the pollution index. This was followed closely by Mn which contributed 29.3%. Al, Ni, Fe and As contributed 19.13%, 8.66%, 4.25% and 0.82% respectively (Figure 10).
5. Conclusions
In 2011, an assessment of groundwater quality in the University of Lagos was carried out 21 groundwater samples were collected from boreholes from August through September 2011. Water samples were analyzed for physical properties and other constituents, including inorganic major ions, nutrients and trace elements. Groundwater samples of university of Lagos are both slightly acidic and alkaline with 78% of the samples exceeding the standards used for the water evaluation. All the water samples can be classified as fresh water and are
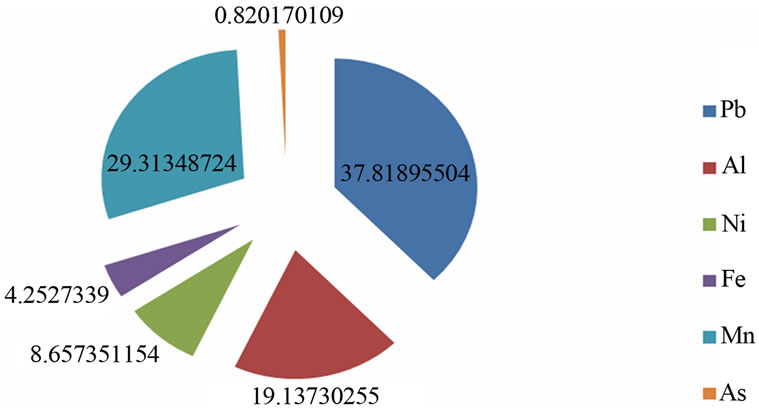
Figure 10. Polution index percentage contributions by significant metals.
within the recommended standards of 500 mg/l for TDS. Based on Gibbs classification, all the groundwater samples fall in the water-rock interaction field which suggests that the weathering of rocks primarily controls the major ion chemistry of groundwater in this region. The relationship between total cation, Na + K, Ca + Mg and Cl also confirmed the effect of silicate weathering and influence of sea water on water chemistry.
SAR for all the water samples are <10 and excellent for irrigation purpose. Only 33% of water samples are suitable based on SSP and MAR while for KR all the water samples are >1 and not good for irrigation purpose. Each borehole sampled had at least one constituent that exceeded USEPA drinking-water standard, Maximum Contaminant Levels (MCLs) or Secondary Maximum Contaminant Levels set by the US Environmental Protection Agency (USEPA) for major and trace elements. Al, Fe, Pb, Mn, Br and Ni exceeded recommended standards in 60.87%, 4.35%, 65.2%, 18.78%, 100% and 13.04% of the total samples respectively. The sources of the trace elements except Br in the study area could be anthropogenic. Some trace elements, Ge, Gd, Ho, Pr, Lu, Tb, Tl, Tm were detected less frequently or at lower concentrations than other constituents while Sb, As, Be, Ba, Cd, Cr, Se, Zn, U, Cu, Hg, Ag and Ta were within USEPA maximum contamination level for all the samples. Co, Li, C, Cs, Dy, Er, Nd, Y, Yb, Zr, Lu, Rb and V were detected, but no MCLs have been established for them while W, Th, Ti, Te, Ag, Au, Ga, Hf, In, Nb, Pd, Re, Rh and Ru were below laboratory detection limit for all the samples. 50% of the water samples showed pollution index above 1 and lead contributed the highest percentage (37.8%) to the pollution index. This was followed closely by Mn which contributed 29.3%. Al, Ni, Fe and As contributed 19.13%, 8.66%, 4.25% and 0.82% respectively.
NOTES