Working Capital Management, Liquidity and Profitability of the Manufacturing Sector in Palestine: Panel Co-Integration and Causality ()
1. Introduction
The industrial sector is the engine of the sustainable development in the Palestinian economy, and it has been recorded as the second sector after the services sector in terms of the value added and employment in 2011. In addition to the value added for industry, which was increased by 7.6% in 2011 and the number of the employees increased by 18.6% compared with 2010. It also contributed to 12.6% in GDP in 2011 [1]. These facts clarify the vital contribution of the industrial sector in the national economy, and the need to focus on the profitability of the firms in this sector.
The primary goal for any firm is to maximize its profits and thereby, the shareholders’ wealth, thus factors that affect profitability have been in concern continuously over the years, working capital management and liquidity are two factors that have a direct effect on profitability, working capital management deals with management of current assets, current liabilities and tries to reach the optimal level of each component, via managing inventory, cash, account receivables and accounts liabilities [2].
Managing inventory means maintaining inventory at the optimum level [3], which is keeping up the financial and operational objectives of the firm through the efficient use of capital, minimizing costs, availability of materials, and production efficiency. Obviously managing inventory affects profitability directly by increasing the sales of the firm and/or by saving costs such as the cost of opportunity cost for inventory investment, expensive storage costs, and lower purchases prices. Managing accounts receivables means maintaining the account receivables at the optimum level [3], it is the level at which there is a trade-off between profitability and cost. Costs of debt collection and short collection period affect sales badly, thereby profitability. Managing account receivables is supposed to include establishing a credit policy, establishing collection policy of concern, and controlling the accounts receivables.
The importance of accomplishing the optimal level of current assets and current liabilities lays upon management in its trial to balance between liquidity and profitability [2]. Excessive level of current assets especially the account receivables and inventory leads to inefficient use of cash. Moreover it threats the operating process within the firm causing lower profits; as a result, lower market value of the firm will be caused. Low level of current assets notably creates a liquidity problem for the firm, corollary problem with the settlement of its obligations, and inability to grow in business; this manner threatens the operating process, and lower profits nonconformity with profit maximization aim.
To sum up, the forgoing firms manage their working capital in order to generate more profits, taking into consideration that they manage their working capital to produce liquidity to the firms [4,5], but such firms need to keep an adequate level of liquidity in order to meet its day to day operations. Moreover, excessive or short level of liquidity will harm profitability [2]. Thereof this paper, aims to present the source of causation for profitability by testing the causal effect between working capital management and profitability, and between liquidity and profitability in the manufacturing firms in Palestine over the period 2007-2012.
The causal relationship between working capital management and profitability as well as liquidity and profitability has not been investigated in depth in previous studies, most of the previous empirical work tested the impact of working capital management (liquidity) and its components on profitability. In fact, Palestine in this field of investigation has not been started yet. This study is likely to enrich the empirical work widely in Palestine by providing an investigation about detecting the causality relations between working capital management and liquidity on profitability.
The overall objective of this study is to provide, for policy makers and upper management of manufacturing firms in Palestine, an idea about the directional effect of working capital management and liquidity on profitability and vice versa. The specific objectives are:
1) To predict the direction of causality between working capital management and profitability;
2) To predict the direction of causality between liquidity and profitability;
3) To provide policy makers and upper management of the firms with recommendations regarding the tradeoff between liquidity and profitability through managing working capital.
Hypotheses
To meet the study objectives stated above, this study undertakes two main hypotheses:
1) Efficient working capital management leads to higher profits in manufacturing firms in Palestine.
2) Higher liquidity level leads to higher profits in manufacturing firms in Palestine.
The following sections in this study are organized as follows: section two displays a discussion of previous researches, section three illustrates the data and econometric techniques being used to test the hypotheses, section four exhibits the empirical results, and the last section draws the conclusions and recommendations regarding the results.
2. Literature Review
Recently the relationship between working capital management efficiency and profitability became an imperative concern for many researchers, this due to the importance of working capital management in its influence on profits, and therefore market value of the firm. Causality relations between working capital management and profitability as well as liquidity recently begin to be tested by researchers. A few studies found in literature, provide empirical results regarding causality relationships, most studies test the relationship between working capital management and its components on profitability.
In the same pattern of this paper [5] investigates if there is a long run relationship between working capital measured by cash conversion cycle and profitability, and what is the direction of the causality between those variables in 66 firms in Nigeria for the period 1999-2007. He applied LLC, IPS and Hardi panel unit root test to insure the stationary of the data, which was found stationary at first difference. Then he run the Pedroni (1999) panel regression to detect the long run relationship, the result revealed that there is a long run steady state relationship between working and profitability for a cross section of firms after allowing for a firm specific effect. Finally he used a panel based error correction model to account for the long run relationship using the two step procedure from Engle and Granger (1987). The results show that there is long run and short run causal relationship moving from working capital to profitability. This result confirms the importance of working capital management, in consequence of that, if mangers manage working capital inefficiently, that’s will lead to a reduction in profits.
Also, [6] primary aims to investigate the influence of working capital management and its components on the profitability, then to establish a relationship between firms’ management of the liquidity-profitability trade-off for of big four world leading beer brewery firms over a period of 2000-2011. Return on assets (ROA) used as a measure of profitability considered the dependent variable, cash conversion cycle (CCC), current ratio(CR), debt ratio (DR) , and sales growth (SGR) were the independent variables in their study. Augmented dickeyfuller test (ADF) was applied to test the order of integration for the data, all data found integrated of order one, Johansen co-integration test result exists a co-integration relationship between the measure of profitability ROA and the explanatory variables, multiple linear regression indicates that there is a significantly positive and direct effect of cash conversion cycle on profitability. The Pair wise Granger causality test discovers that ROA causes CCC and CR while DR and SGR causes ROA. That is working capital management not only has a positive relationship with profitability, but also has a significant impact on profitability, this result is consistent with the findings of [5].
Reference [7] established a relationship between working capital and profitability based on a sample of 25 Pakistani manufacturing companies listed on Karachi stock exchange over a period of 2001-2010. They used Augmented Dickey Fuller test to check the stationary of the data, and Johansen’s co-integration test to find the long term relationship. Then they established a linear regression model with OLS techniques to analyze the data, which the analysis reveals that quick ratio , days inventory outstanding ,debt equity ratio and return on equity have a positive association with return on assets as a measure of profitability, whereas current ratio , and days sale outstanding show a negative association with return on assets. This indicates that firms must have adequate current assets in order to keep daily business operations in work, which does not affect profits. This means that cash levels resulted from working capital management have a vital impact on the level of profitability.
Study [4] attempts to explain the necessity of firms optimizing their level of working capital management and maintaining enough liquidity as it affects the profitability, through examining four cement companies of Dhaka Stock Exchange over the period 2005-2009. The results of simple and multiple regressions confirm the negative relationship between working capital management and profitability, in addition it indicate there is a positive relationship between profitability and liquidity of the firms. Those findings are consistent with the findings of [7].
In another study, [3] investigates the relation between working capital management and profitability for a sample of 1009 large Belgian non financial firms for the periods of 1992-1996. He used Pearson correlation, fixed effect model and plain OLS model to analyze the data, he concludes that managers can create more profits by reducing number of days account receivables and inventory, and less profitable firms wait longer to pay their bills. He suggests that profitability affects accounts payable policy and not vice versa.
Study [2] relies upon a sample of 94 Pakistani firms listed on Karachi Stock Exchange for a period of 6 years from 1999-2004 in order to specify the effect of working capital management variables on profitability, using Pearson’s correlation and the pooled regression type of panel data analysis, the results assures the negative relationship between profitability and working capital management’s components, those components were exhibited by average collection period, inventory turnover, average payment period and cash conversion cycle as a comprehensive measure of working capital management. They also found a negative relationship between liquidity and profitability of the firm, those results assures that firms should balance between liquidity and working capital in order to increase profitability. This result supports the findings of [3].
In Nigeria, [8] provides an empirical examination for the efficiency of working capital management and its effect on the market valuation of a firm in Nigeria for the period of 1995-2009, they applied Pearson correlation and multiple regression technique to analyze the data. They considered Tobin Q as a measure of market value, ROA and ROI as indicators to firms’ profitability as the depending variables. Five financial ratios were used as independent variables which are: cash conversion cycle; current ratio; current asset to total asset ratio; current liabilities to total asset ratio and debt to asset ratio, their findings confirm that there is a significant correlation between working capital management’s components and profitability and consequently market valuation, this conclusion attests the rule that maximizing profits will maximize the stakeholder’s wealth. They also found a strong negative relationship between working capital management measured by cash conversion cycle and profitability that is a reduction in cash conversion period will lead to maximize profits. This certifies the findings of [2,3].
In the same pattern, [9] study which aims to distinguish the relationship between methods of working capital management and company profitability. They examine the relationship between working capital management and profitability on a sample of 101 firms listed on Tehran Stock Exchange (TSE) during the period of 2004-2008. Like other researchers they used gross operating profit as dependent variable and cash conversion cycle and its components as independent variables, and they also added firms’ size, fixed financial assets ratio, financial debt ratio and a dummy variable for the industry type as control variables. Results obtained from multiple regression confirm that there is an inverse relationship between the cash conversion cycle, debt settlement period and the period of collection of receivables with profitability but insignificant and negative relationship between the average period of inventory and profitability unlike [2,3,8], whom found significant negative relationship between the average period of inventory and profitability.
In Vietnam firms, [10] investigates the relationship existing between profitability, the cash conversion cycle as a measure of working capital management and its components for 130 firms listed in Vietnam stock market for period of 2006-2008, correlation and multiple regressions were used to test the relation between variables. They used gross operating profit as dependent variable measuring profitability. Cash conversion cycle, average collection period, average payment period and inventory turnover were their independent variables; including company size, fixed financial assets ratio and debt ratio as control variables. They find a strong negative relationship between profitability and cash conversion cycle, average collection period for account receivables, and inventory turnover. The results suggest that managers can create value for their shareholders by reducing the cash conversion cycle to a reasonable range. On the other hand, they also find a positive relationship between profitability and average payment days for account payables, this implies that more profitable firms wait longer to pay their bills, this result in contrary with the findings of [2,3,9] who concludes that less profitable firms wait longer to pay their bills.
In Sri Lanka, [11] tests the relationship between liquidity and profitability for 31 listed manufacturing firms in Sri Lanka over a period of past 5 years from 2007 to 2011. The relationship was tested by using the correlation matrix between variables of the study. And the result was that there is no significant relationship between liquidity and profitability among the listed manufacturing firms in Sri Lanka.
Reference [12] in their investigation about the liquidity management efficiency and liquidity-profitability relationship for FMCG companies over the year of 2001 to 2010, by applying the multiple regression they have found first; liquidity position and solvency position have a significant impact on Profitability, second; they found there is a significant relationship exists between liquidity and profitability. Accordingly, they recommend that mangers should concern on working management efficiency in order to create wealth to shareholders. The abovementioned results are the opposite of [11] results.
Literature Review Discussion
The relationship between working capital management and its components on profitability were tested by many researchers, [2,3,8-10] confirm the negative relationship between working capital management measured by cash conversion cycle and profitability, that is a reduction in cash conversion period will lead to maximize profits.
According to the relationship between cash conversion cycle components and profitability, there are differences in the researchers findings. Reducing inventory turnover in days can create more profits to the firm was confirmed significantly by [2,3,10] unlike [9] whom found insignificant and negative relationship between the average period of inventory and profitability. The inverse relationship between average collection period and profitability was assured by [2,3,9,10]. Debt settlement period relationship with profitability was found by [10] to be a positive relationship, this implies that more profitable firms wait longer to pay their bills, this result in contrary with the findings of [2,3,9] who concludes that less profitable firms wait linger to pay their bills.
Liquidity and profitability relationship wasn’t absent for the researchers while studying working capital management, for instance, [7] stated that cash levels resulted from working capital management have a vital impact on the level of profitability. This was assured by [12] whom found a significant relationship exists between liquidity and profitability. Accordingly, they recommend that mangers should concern on working management efficiency in order to create wealth to shareholders, but [11] stated that there is no significant relationship between liquidity and profitability among the listed manufacturing firms in Sri Lanka. In addition [2] found a negative relationship between liquidity and profitability of the firm, those results assures that firms should balance between liquidity and working capital in order to increase profitability. Whereas [4] indicate there is a positive relationship between profitability and liquidity of the firms.
3. Methodology
3.1. Data and Study Sample
The study uses annual data and covers the period of 2007 to 2012, because the data availability for the chosen companies, this period was undertaken. The data are obtained from an audited financial statement of the manufacturing firms which published in the Palestine security exchange (PEX). The sample is made of eleven big manufacturing firms that consists the Palestinian manufacturing sector.
3.2. Variables Measurement
As aforesaid the overall objective of this study is to investigate the directional effect of working capital management and liquidity on profitability and vice versa. Toward that end, the empirical work is divided into two groups, the first one tests the effect of working capital management on profitability, and the second one examines the effect of liquidity on profitability. The first group identifies gross operating profit as dependent variable, cash conversion cycle as independent variable, and uses firm’s size, debt ratio, and financial ratio as control variables. The second group of work identifies gross operating profit as dependent variable, liquidity as independent variable, and uses firm’s size as control variables. Variables definitions and measures are displayed below.
Previous studies use different measures as proxies to profitability. For instance, return on assets and investment, earnings before interest and taxes and gross operating profitability. In this study, gross operating profitability (GOP) will be used as a proxy for profitability; whereby this ratio measures profitability without the contribution of any financial activity for the financial assets on overall profitability, and measures it as operating activities for the assets. Gross operating profitability is defined by sales minus cost of goods sold and the result divided by total assets minus financial assets.

According to previous studies that identify cash conversion cycle (CCC) as a comprehensive measure of working capital management. Cash conversion cycle (CCC) is the average days that sales turned into cash. CCC is calculated by adding the average collection period (ACP) to inventory turnover in days (ITD) then subtracting the average payment period (APP).

The components of cash conversion cycle are defined as follows:
Average collection period (ACP): the average days that account receivable collected and turned into cash, which is calculated by dividing the average accounts receivables by sales and multiplying the result by 365 days. This ratio used as a proxy for the collection policy in the firm.

Inventory turnover in days (ITD): the average days that inventory sold and turned into cash, which is calculated by dividing the average inventory by the cost of goods sold and multiplying the result by 365 days. This ratio used as a proxy for the inventory policy in the firm.

Average payment period (APP): the average days that account payables paid and consuming cash, which is calculated by dividing the average accounts payables by the cost of goods sold and multiplying the result by 365 days. This ratio used as a proxy for the payment policy in the firm.

Current ratio (CR): measures the ability of the firm to repay its short term debt through liquidating its term assets, current ratio used as indicator to the liquidity of the firm, which is current assets divided by current liabilities.

In addition to those independent variables, control variables will be included. These variables comprise; 1) the firm’s size (SZ) measured by the natural logarithm of sale; 2) debt ratio (DR) measured by dividing total debt by total asset; and 3) the fixed financial ratio (FR) which is the financial assets divided by total assets.

3.3. Econometric Methods
In accordance with the overall objective and the empirical work adopted in this study; it will highlight the approach taken to determine the presence of co-integration and the resulting error correction terms to be used in formulating the error correction models for each group mentioned in previous section. The test for causality between cash conversion cycle and profitability and between current ratio and profitability will be performed in three steps. First, it will test the order of integration in the variables and implement the panel unit root tests proposed by [13,14], to determine the order of integration of the six variables. Second, conditional on finding that these variables are integrated of order one I(1) , using the suggested approach by [15] to test the panel co-integration, to test for the long run relationships between the variables in question included in the two groups. Third, to test Granger’s causality that is between cash conversion cycle, profitability and the current ratio. Panel Granger causality will be used to assess the short run co-integration and the direction of causality between the two variables in each group. The panel vector error correction model is used to describe both long run relationships and short run dynamic adjustments between cash conversion cycle and profitability, and between current ratio and profitability of the 11 Palestinian manufacturing companies over the period of 2007-2012.
3.3.1. A panel Unit Root Test
Before starting with causality procedure, we will examine if all the interested variables in this study are stationary. In other words, we will determine if both series are stationary or not (don’t show unit root). As DickeyFuller (DF) and augmented Dickey-Fuller (ADF) tests are designed mainly for investigating the stationary of the variables in time series data, in this study, especially our data are panel, tow different tests are employed aiming at detecting the presence of unit roots, both are mainly designed so as to examine the stationary of panel data, and these are the most famous ones that serve in small samples. See [16,17].
We can use both tests which suggested by [13] and [14]. The researchers in paper [13] assume that the autoregressive root is homogeneous for all the individuals of the panel. Afterwards, [18] proved that the above hypothesis is incorrect leading to the rejection of null hypothesis of the presence of unit root in many cases. Therefore, [14] have suggested a new framework for the unit root testing on panel data allowing the heterogeneity on the lagged level term.
In order to test the stationary of the data, Levin, Lin and Chu Test (LLC) was employed. This panel based unit root test provides a good approximation results than a separate unit root test for each individual time series, serving in small samples. On the other hand, this test has two limitations. First, it works under the assumption that the cross-sectional data are not correlated. Second, the assumption that all individuals are identical with respect to the presence or the absence of a unit root is somewhat restrictive [13].
LLC test based on the following model:
 (1)
(1)
where, dmt is used to indicate the vector of deterministic variables and αm is used to indicate the corresponding vector of coefficients for a particular model m = 1; 2; 3. Thus, d1t = Ø (the empty set); d2t = {1} and d3t = {1; t}.
After that Im, Pesaran and Shin (IPS) unit root test was employed, this test like LLC test based on the augmented Dickey-Fuller (ADF) regressions for each cross-section (Equation (1)), although they suggest an alternative testing procedure based on averaging individual unit root test statistics. In small samples; Monte Carlo experiments revealed that IPS t-bar test is reasonably satisfactory and generally better than the LLC test.
3.3.2. The Panel Co-Integration Test
If two time series are respectively non-stationary, some linear combination of them is a stationary process then the two time series are said to be cointegrated. A time series is said to be covariance stationary which means that variance and covariance are all invariant with respect to time, in which case it is integrated of order zero, or I (0).
Recently a co-integration panel test has the concern of many researchers where many researchers proposed models in order to test co-integration. For instance, McCoskey and Kao (1998) derived a residual-based test for the null of co-integration rather than the null of no co-integration in panels. On the other hand, [15] proposed DF and ADF-type unit root tests for residuals for the null of no co-integration (Residual-Based DF and ADF Tests). Beside [19] who also proposed several tests for the null hypothesis of co-integration in a data model panel that allows considerable heterogeneity. Larsson, Lyhagen and Lothgren (2001) presented a likelihood-based (LR) panel test of co-integrating rank in heterogeneous panel models based on the average of the individual rank trace statistics developed by Johansen (1995). See [17].
Based on the sample size for this study, which consists financial ratios of 11th manufacturing firms during the period 2007-2012, residual-based DF and ADF tests proposed by [15], seems to be the most adequate test for co-integration. [15,17].
Kao developed four DFand one ADF-test for testing the null hypothesis of no co-integration. It starts with the regression:
 (2)
(2)
where,  is the dependent variable,
  the independent variable for each cross section observation and i time t,
  is the intercept and
  the error term, and
  and
and  are assumed to be integrated of order one (I (1)), The fixed effect residuals
  can be calculated by:
 (3)
(3)
In order to test the null hypothesis of no co-integration, the null can be written as H0: . The OLS estimate of
  and the t-statistic is given:
 and,
and,

The four DF-type tests proposed by Kao are:
 ,
,
 ,
,
 , and
, and
 .
.
where,  and
and  are the consistent estimates for
 and
and . While
  and
and  are based on the strong exogeneity of the regressors and errors,
  and
and
 are for the co-integration with endogenous relationship between regressors and errors.
ADF test is based on the following regression;
 (4)
(4)
This regression is the correction for serial correlation in the estimates of OLS estimates and t-statistic in DF regression (3), thus the residuals  are serially uncorrelated. Now we test the null hypothesis of no co-integration H0:
  by the ADF test statistic which is:
 .
.
3.3.3. Granger Causality Test
The co-integration test results show a long-term causality existence while it does not indicate the direction of this causal relationship. The next step is to examine the direction of this causality relationship between variables. With an affirmation of a long run relationship among the models’ variables, and since our sample is small and especially the data are panel, we test Granger causality in the long run relationship at the third and final step of estimation using the two-step procedure from [20]. The first step relates to the estimation of the residual from the long run relationship, that is the residuals from running Equation (2) to be ECTit. Incorporating the residual as a right hand side variable, the short run error correction model is estimated at the second step.
After defining the error term as ECTit , granger causality test will be based on the following regressions; testing the causality relation between profitability and working capital management, and liquidity with profitability:
 (5)
(5)
 (6)
(6)
 (7)
(7)
 (8)
(8)
where  is a difference operator; ECT is the lagged error-correction term derived from the long-run co-integrating relationship; the
  and
and  are adjustment coefficients; k is the lagged length (taking into account the relatively short time period covered by the data we shall assume that k = 1 in the analysis that follows); and
  and
and  are disturbance terms assumed to be uncorrelated with mean zero.
Sources of causation can be identified by testing for significance of the coefficients on the lagged variables in Equations (5)-(8). First, testing the short run causality by testing H0:  for all i in Equations (5) and (7) or H0:
 for all i in Equations (6) and (8).
Another possible source of causation is the ECT in Equations (5)-(8). In other words, through the ECT, an error correction model offers an alternative test of causality. The coefficients on the ECTs represent how fast deviations from the long run equilibrium are eliminated following changes in each variable. Testing the null hypotheses  or
or  for all i in the previous equations indicate the long run granger causality.
It is also desirable to check whether the two sources of causation are jointly significant, in order to test Granger causality. This can be done by testing the joint hypotheses H0:  and
and  for all i in Equations (5) and (7), or H0:
  and
and  for all i in Equations (6) and (8). As all variables enter the model in stationary form, a standard F-test is used to test the null hypotheses.
4. Empirical Findings
4.1. The Panel Unit Root Test Results
The analysis starts by testing the stationary of all variables in the study; to determine the order of integration of the six variables I applied LLC test and IPS test based on Equation (1) as discussed previously. For estimating purposes, I choose a maximum lag length according to Schwarz info criterion, a Bartlett kernel and we specify the exogenous variables as individual effects.
The LLC unit root test works under the null hypothesis that each individual time series contains a unit root, and the alternative hypothesis that each time series is stationary.

The IPS works under the null hypothesis that each series in the panel contains a unit root, and the alternative hypothesis that some of the individuals’ series (but not all) have a unit root.

Table 1 shows the unit root tests results. According to LLC test all variables except CR found to be stationary at their levels, and CR found to be stationary at its first difference. Whereas IPS test results differ, for the reasons previously explained in Section 3.3.1, CCC and DR stationary at their level with a 5% of significance, FR is stationary at level with a 1% of significance and the other three variables do have a unit root at their levels. With 1% level of significance CCC, CR, SZ and DR are stationary at first differences, and GOP is stationary at first difference with 10% of significance.
To summarize, I conclude that FR is stationary at a level will be excluded from the panel co-integration model and granger causality model, because; 1) previous studies defines FR as control variable and possibly do not has a causal impact on the dependent variable; 2) the nature of the manufacturing firms in Palestine, which comprise our sample, during their operating process do not depend heavily on the financial investments. The rest

Table 1. Results for panel unit root test.
Notes: 1. The numbers in parentheses denote P-values. 2. ***, **, * denotes rejection of null hypothesis at the 1%, 5% and 10% levels of significance respectively. 3. D denotes first differences.
of variables is stationary at their first difference with 1% level of significant except GOP stationary with 10% level of significant. In the coming stage of empirical work is to test whether there is a long-run equilibrium relationship among GOP and CCC, controlled for SZ, DR, and FR for the first group, then testing a long-run equilibrium relationship among GOP and CR controlled for SZ for the second group
4.2. The Panel of Co-Integration Test Results
Now after detecting the independent variables stationary at 1% level of significance, and the dependent variable stationary at 10% level of significance, all variables except FR are stationary at the first difference. This means that those variables are integrated to the order one I(1), therefore we construct two models to examine the long run equilibrium among the models’ variables using [15] test for testing the null hypothesis of no co-integration between variables as mentioned previously.
Tables 2 and 3 show the results of co-integration results.
The results indicate to reject the null hypothesis of no co-integration between variables in the two models. There is a long run relationship between profitability, working capital management, size of the firm and debt ratio. Also there is a long run relationship between profitability, liquidity and the size of the firm where those variables are moving together in long run.
4.3. The Granger Causality Results
Although the existence of a long-run relationship between the variables suggests that there must be Granger causality in at least one direction, it does not indicate the direction of causality between the variables. The study used a panel-based error correction model to account for the long run relationship using the two-step procedure from [20] as discussed earlier. Table 4 below identifies the results of panel causality test between working capital management and profitability based on Equations (5) and (6), whereas Table 5 shows the results of panel causality test between liquidity and profitability based on

Table 2. Panel co-integration test. Group 1 (GOP, CCC, SZ, and DR).

Table 3. Panel co-integration test. Group 2 (GOP, CR, and SZ).
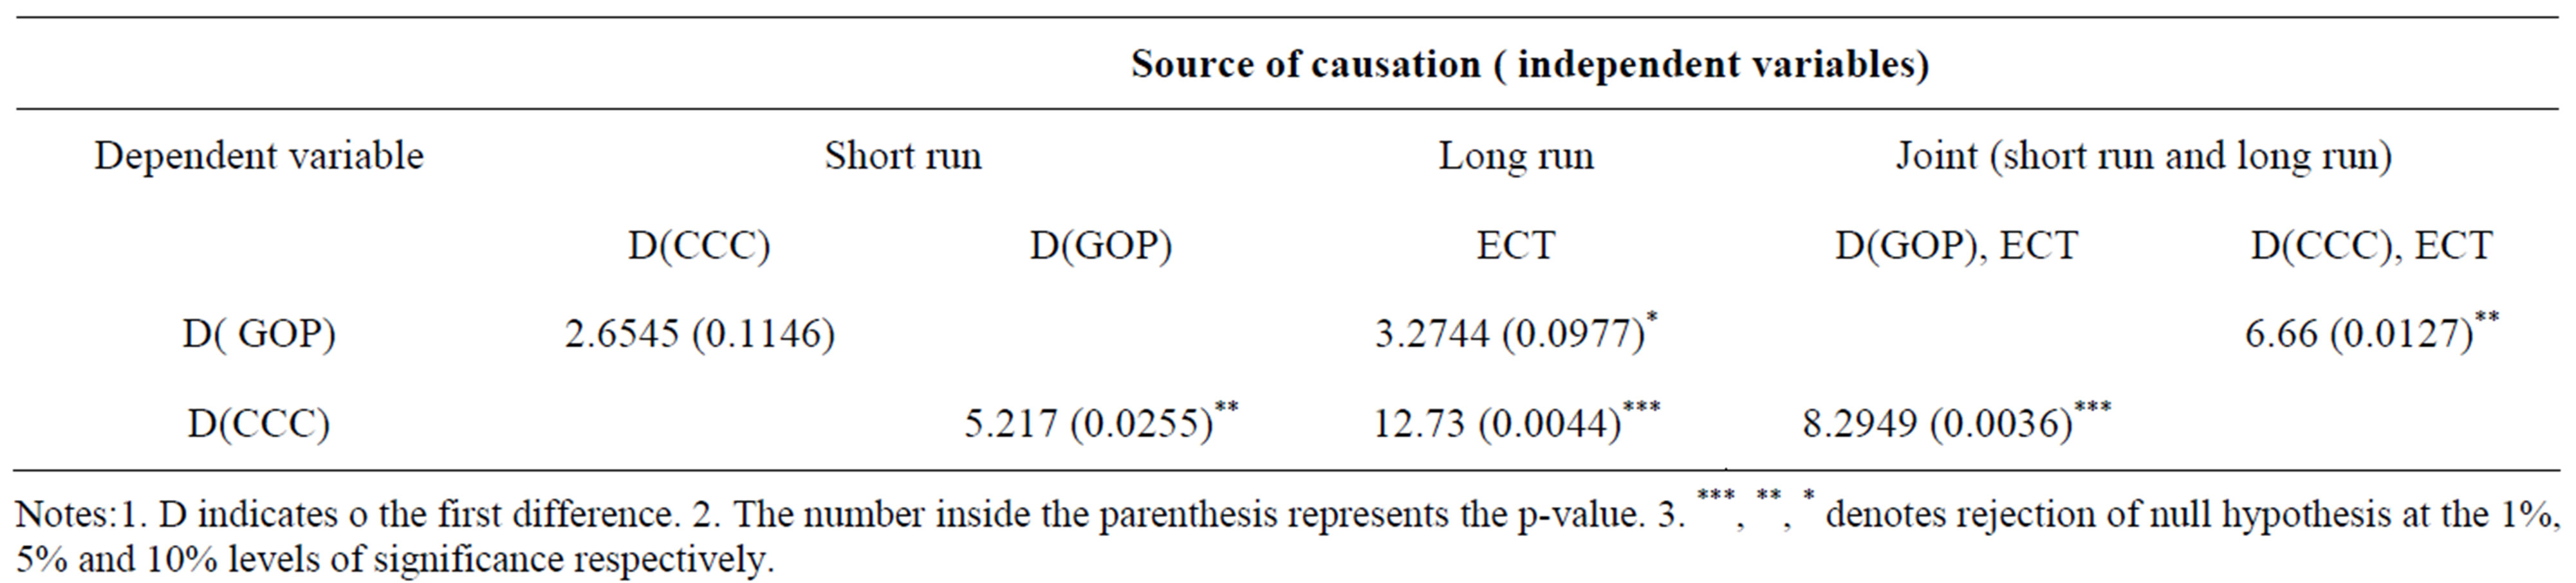
Table 4. Panel causality test: profitability (GOP) and working capital management (CCC).
Notes:1. D indicates o the first difference. 2. The number inside the parenthesis represents the p-value. 3. ***, **, * denotes rejection of null hypothesis at the 1%, 5% and 10% levels of significance respectively.

Table 5. Panel causality test: profitability (GOP) and liquidity(CR).
Notes: 1. D indicates o the first difference. 2. The number inside the parenthesis represents the p-value. 3. ***, **, * denotes rejection of null hypothesis at the 1%, 5% and 10% levels of significance respectively.
Equations (7) and (8).
The results reported in Table 4 show the F-statistics on the independent variables in Equation (5) indicate a significant long run and joint causation effect running from working capital management to profitability, but there is no short run causality from working capital management and profitability. The results reported in Table 4 show the F-statistics on the independent variables in equations 6 indicating a significant short run, long run and joint causation effect running from profitability to a working capital management. The results show that there is bidirectional Granger causality between working capital management and profitability during the period of 2007-2012 under study; this assures the importance of working capital management in order to generate more profits.
The results reported in Table 5 show the F-statistics on the independent variables in Equation (7) which indicate a significant short run, long run and a joint causation effect running from liquidity to profitability. This means that firms need to generate cash in order to increase their profits. Moreover, the results reported in Table 5 show the F-statistics on the independent variables in equations 8 indicate a significant long run causation effect running from profitability to liquidity, but there is no short run or joint causation effect between profitability and liquidity, this profitable firm causes firm’s liquidity just in short run. The results show that there is unidirectional Granger causality between liquidity and profitability during the period of 2007-2012 under study; this assures that liquidity causes profitability not the opposite.
5. Conclusions and Policy Implications
The purpose of this study was to present the source of causation for profitability by testing the causal effect between working capital management and profitability, and between liquidity and profitability in the manufacturing firms in Palestine over the period 2007-2012. The result of a unit root test for all variables in this study stated that all variables except financial ratio were stationary at first difference, thus five variables out of six were included in panel co-integration test. A co-integration panel test revealed that there was a long run relationship between variables. It didn’t provide the direction of this relation. Therefore a panel-based error correction model was constructed using the two-step procedure from [20], the granger causality test indicates that there is a bidirectional causal relationship between working capital management and profitability and this isn’t in conformance with the study of [5,6], and a unidirectional causal relationship running from liquidity to profitability unlike [6] who found that profitability caused liquidity.
According to the findings of this paper, we expect that managers of manufacturing firms in Palestine will concentrate on efficiency of working capital management and liquidity level of the firm in order to maximize the firm’s profits and thereby stakeholder’s wealth, since these two measures are considered to be the cause of the profitability of the firm. In the reverse direction managers of firms with high level of profits tend to manage their working capital efficiently in order to generate liquidity which eventually leads to more profits.
In conclusion, the study confirms the importance of working capital management and its effect on profitability and liquidity of the Palestinian manufacturing firms. In the future, we ask researches to enrich the Palestinian literature with more studies on efficiency of working capital management, tradeoff between liquidity and profitability, and directional relationship of components of working capital management on profitability. In particular such studies are likely to provide policy recommendations to both, researchers and policy makers, which is necessary for improved the Palestinian manufacturing sector.