Location of Large-Scale Concentrating Solar Power Plants in Northeast Brazil ()
1. Introduction
The Solar Electric Generation Systems (SEGS) power plants became the most mature example of thermoelectric solar technology with the usage of parabolic cylindrical concentrators. Nine SEGS power plants were built in three different sites in the Mojave Desert, in California (USA), between 1984 and 1991.
The SEGS are still in commercial operation today, with 354 MW of installed capacity, demonstrating their technical and commercial reliability. Following a halt in the production of this type of system that lasted approximately 15 years, there was a vigorous reintroducetion of this technology in the beginning of the last decade. In 2010, the total amount of thermoelectric solar power plants installed worldwide was 941 MW, with a predominance of parabolic cylindrical concentration technology (95%). The distribution per country was 46.0% for the USA, and 51.3% for Spain. Estimations of thermoelectric solar power plants under construction or publically announced exhibit discrepancies due to the usage of different criteria, such as different periods of consideration and a lack of updates on project modifications in terms of potency. In 2011, 1934 MW were under construction, and 17,539 MW were announced: 9659 MW in the USA, 1080 MW in Spain, and 6800 MW in the rest of the world [1]. Considering these numbers with caution, it is perceivable that the trend of growth, the experience accumulation rate and scale savings in the next years will be spectacular. Thus, according to the learning curve elaborated by [2], it is possible to predict that, in the next five years, the cost of thermoelectric solar energy will be in parity with conventional networks.
The Northeast Region of Brazil has already used nearly all of the large hydraulic resources available for generating electricity, leaving the options of importing energy, exploiting other local renewable sources (wind and solar) or relying on conventional thermoelectric generation with oil fuel or coal or nuclear. The main obstacles to energy importation and conventional thermoelectric and nuclear generation are as follows: 1) the costs of transmission of the Amazon’s hydroelectricity, which are much larger than the costs of generation, not to mention the environmental problems that aggregate uncertainties for such ventures; 2) fossil fuels, which exhibit rising prices, environmental problems and “invisible” subsidies (externalities) that are progressively put into question by society; and 3) the risk of catastrophic accidents with regards to nuclear energy.
With the perspective of commercial and technologic maturity for large scale thermoelectric solar energy on the 10-year horizon (2020), it would be appropriate for the Brazilian electric system to follow the evolution of this technology, carry out R&D and assess in detail the potential of the resources available in the Brazilian Northeast. In addition to the renewable aspect and low environmental impact, the implantation of thermoelectric solar power plants is regionally important for the following reasons: 1) They improve the generation “mix” of the Brazilian electric sector and therefore improve the safety of the electric system; 2) Solar resources are more intense in the dry period of the region and thus have a complementary character to the regional hydroelectric system; 3) Solar resources are in phase concurrently with the time period of greatest consumption (summer); 4) Thermoelectric solar energy characteristically has a distributed generation, providing yet another safety factor for the electric system; 5) Thermoelectric solar power plants should be installed in semi-arid regions with low population densities and lands that are not competing for other nobler usages (agriculture, for instance); Finally, 6) such plants would lead to the creation of jobs and income.
The use of GIS in renewable energy began in the 1990s and has gone through considerable development. As a result, various decision support tools have been developed [3]. The pioneering study regarding GIS usage for Concentrated Solar Power (CSP) is that of [4], who analysed Northern Africa and provided a rank of sites with respect to the potentiality and cost of solar thermal electricity for a particular power plant configuration. Recently, this type of study has become widespread: [5] for the Southwest USA, [6] for South Africa, [7] for Oman, [8]for Burkina Faso, [9] for Australia, and [10] for India. In Brazil, this type of study has not yet been conducted; however, country possesses extensive areas with normal and high-intensity direct irradiation and low seasonality factors, particularly in the semi-arid region of the Brazilian Northeast. Hence, in this study, identification and mapping of the most promising sites in the Northeast of Brazil were conducted so that the country can quickly initiate the process of implanting large scale CSP solar technology.
2. Location of the Solar Power Plants
The renewable energy is a good candidate for rapid and widespread transformation, because renewable power technologies (especially solar) are well-developed and commercially available, and electricity is a versatile energy carrier capable of displacing fossil fuel in other sectors.
Making the best use of renewable resources requires that this “spatiotemporal” complexity be explicitly incorporated into modeling and analysis of alternative energy futures. Toward that end, this paper provides approach for optimized location of the solar thermal power plants. Solar thermal power plants use concentrated solar in order to generate high pressure steam for electricity generation in conventional steam turbines. Thermal storage allows excess heat generated during the day to be stored and utilized later.
Installations are best placed on flat, open terrain free from obstructions, settlements, or dangerous land features. Additionally, solar power plants have a relatively big area demand. The Specific area demand for a parabolic trough power station is ~1 km2 per 50 MW of installed electric capacity. Typical sites are hot, dry regions like deserts or semi-deserts. Surface waters, forests, settlements, arable and cultivated lands are considered unsuitable for the construction of such plants. Sand deserts are not considered to be criteria for exclusion, but may elevate the cost [4].
The quantity and type of solar radiation are key determinants of overall plant performance. PV technology can utilize all radiation falling on the cell: both the direct sunlight component and diffuse radiation scattered by clouds and aerosols (together, global horizontal irradiance or GHI). CSP utilizes only the direct beam perpendicular to the receiver (direct normal irradiance or DNI).
For CSP configurations, minimizing the cost of production requires optimizing the size of the mirror array (“solar multiple”). For CSP without storage, the optimal solar multiple is ~1.4 for representative sites; In the case of thermal storage, true maximization of profits depends on daily and seasonal variation in the price of electricity since plant operators can somewhat control the timing of sales to the grid. In the absence of extensive electric grids with excess capacity, solar power must be transmitted from a substation near the site of generation to a substation connected to the desired distribution grid [11].
The general procedures used for selecting a site for installing a CSP follow the sequence below:
• Identification of the most promising places;
• Visiting the identified places and their priority;
• Conceptual project;
• Production estimation and sensibility study;
• Final selection.
Identification of the best places for installing largescale solar electric power plants, whether thermoelectric or photovoltaic requires following the procedures: the first step of the procedure is performed basically with the existing documental information, multiple criteria analysis and a GIS. GIS is a valuable tool for evaluating and developing the usage of renewable energy resources in large regions because it is a tool specially capable of analysing the spatial variability of resources and resolving management and planning problems regarding the installation programs of decentralised systems, which are characterised by great spatial dispersion. The result is a list of potentially attractive sites. The next step is an insitu visit of the pre-identified places and a reduction and ranking of the previous list.
The next step is setting up solarimetric stations to measure direct solar irradiation, which is performed because solar radiation is the most relevant variable in determining the feasibility of future ventures. If the region is relatively homogeneous from a phytogeographic perspective, each station will be able to cover a radius of 150 km.
3. Methodology
3.1. Equipment and Resources Used
The equipment and resources used for realising this research were 1) a Pentium 4 - 2.80 GHz, 1.0 GB RAM computer; 2) Arc GIS Software version 9× ESRI; 3) vector files of the shape file (shp) type referring to the IL; and 4) images of the SRTM (Shuttle Radar Topography Mission).
3.2. The Northeast Semi-Arid Region
According to [12], the Brazilian semi-arid region is located in parts of the states of the Northeast region and in Minas Gerais and Espírito Santo, occupying an area of 974,752 km2, where approximately 17,000,000 people live. The semi-aridregion in the Northeast, Figure 1, entails parts of the states of Pernambuco, Paraíba, Alagoas, Sergipe, Bahia, Piauí, Ceará and Rio Grande do Norte, occupying 86.48% of the area of all semi-arid regions in Brazil. It is an area where the pluvial regime is irregular, with an annual average that varies between 400 and 800 mm. The predominant climate is hot and dry, with an average annual temperature of 27˚C and low thermal amplitudes (of approximately 3˚C - 5˚C). Its vegetation is deciduous tropical forest (caatinga), which develops in a complex mosaic of soils resistant to long drought periods. According to [13], the annual mean daily value of normal direct solar irradiation is approximately 6.0 kWh/m2.
3.3. Definition of the Spatial Database
A location study of thermoelectric solar power plants for the Northeast semi-arid region required knowledge of the following ILs: soil usage and occupation, solar resources, water supply, terrain topography, connection with the electric network, fuel availability for backup, and access. The ILs indicated for evaluating the viability of implanting solar power plants in the Northeast semi-arid region were selected based on their relevance to the process of defining suitable areas for implantation.
To define the Spatial Database (SD), the ILs were duly evaluated and conformed to avoid cartographic inconsistencies resulting from the conversion between CAD and GIS platforms and to make the ILs compatible in different scales or using documents from distinct Geodesic Reference Systems (GRS). In Brazil, the SIRGAS2000 GRS constitutes the Official System for the Brazilian Geodesic System (SGB) and for the National Cartographic System (SCN). Thus, the ILswere geo-referenced to this GRS. After geo-referencing, a work scale that was compatible for the data presentations as well as their projection system was determined.
3.3.1. Soil Usage and Occupation
In setting up a solar power plant, permissions and restrictions regarding soil usage must be considered. Permissions refer to matters of contractual relations established between land owners and project developers, whereas restrictions refer to the destined utility of the soil.
Regarding restrictions, it is possible to verify that areas protected by legislation (environmental conservation units —integral protection and sustainable usage, indigenous territories, Afro-Brazilian population settlement (quilombola) territory and Atlantic Forest reserves, for instance), urban and urban expansion areas and areas of great agricultural potential are not considered suitable for implanting solar power plant.
In this research, due to the work scale of 1:10,000,000, only restrictions regarding soil usage and occupation were considered. However, it should be highlighted that on larger scales (for example, 1:100,000 or larger) in which terrains can be visualised, questions related to permissions must also be approached. Permissions referring to soil usage are contractual relations established between land owners and project developers.
Urban and urban expansion areas were also not considered on the 1:10,000,000 scale, because in this scale,
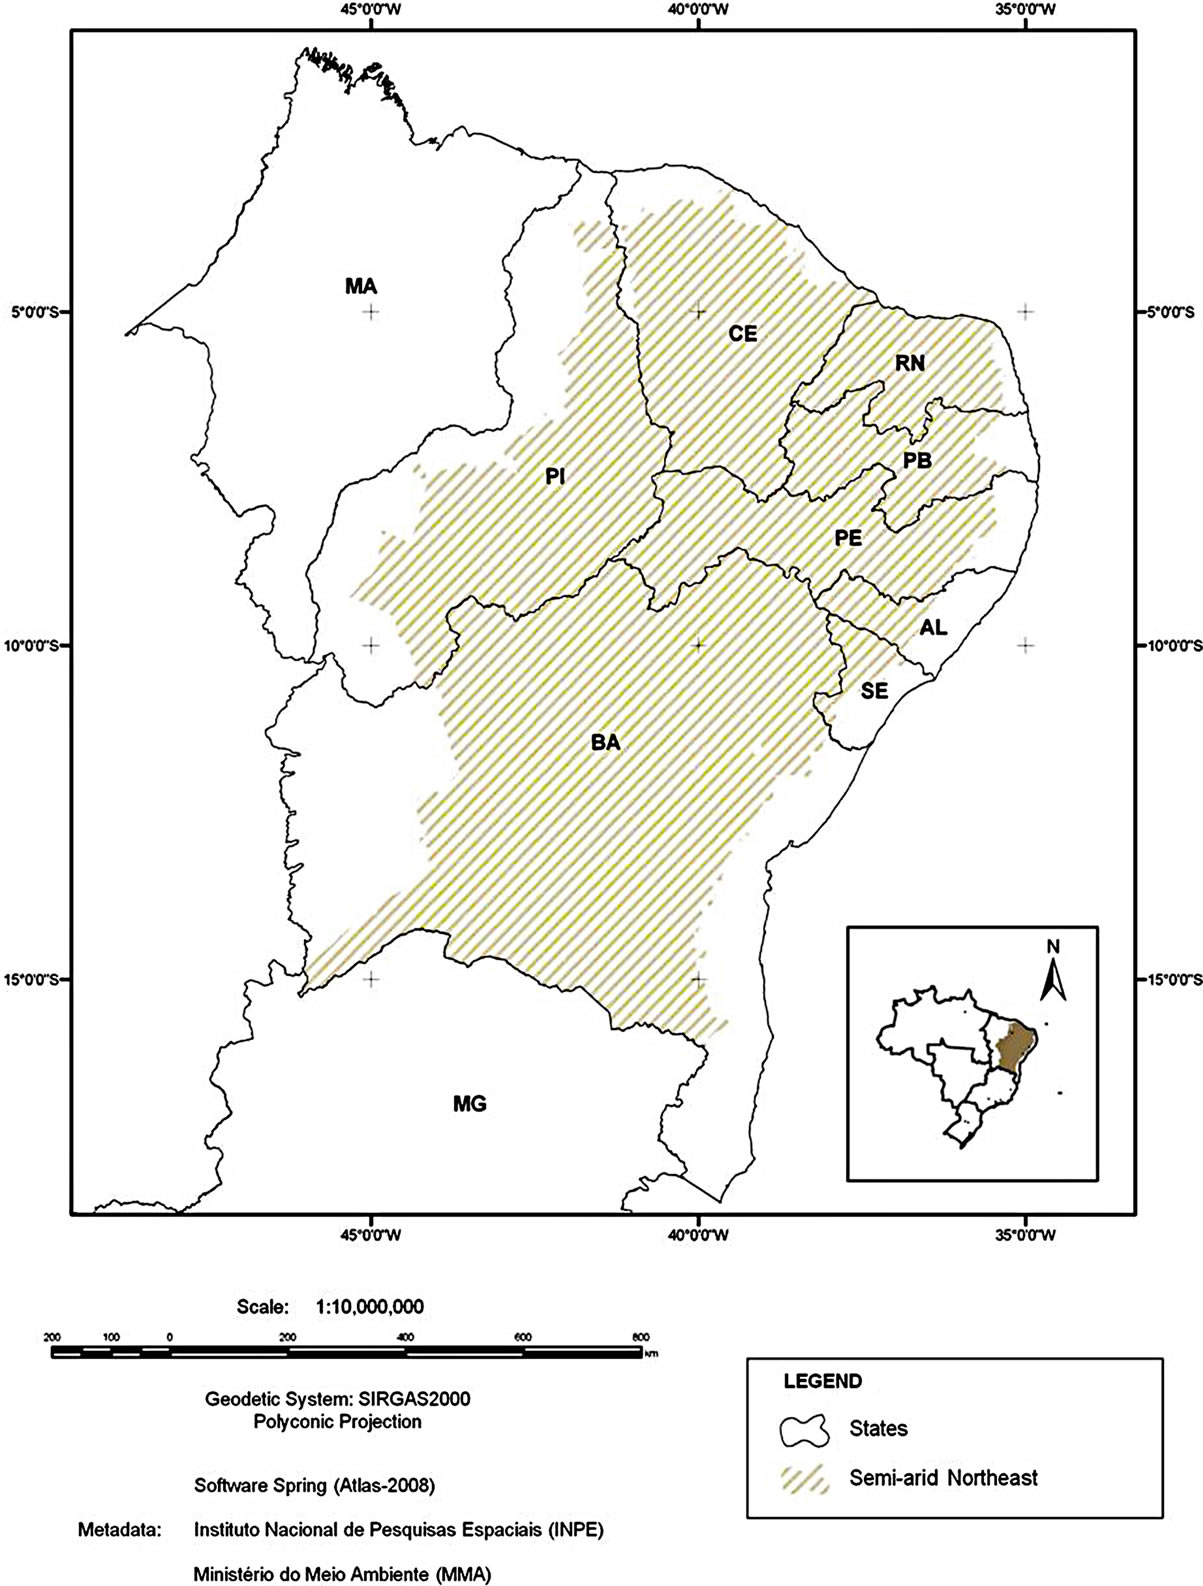
Figure 1. Location map of the semi-arid in the Northeast.
representation of these areas is not thematically visible. The quilombola territories were also not considered in this study due to a lack of available information such as spatial data in the Brazilian territory. Nonetheless, in specific studies, for example, on a municipality scale, these region restrictions must be analysed and considered.
3.3.2. Solar Resource
A parabolic cylindrical concentrator practically uses the direct portion of solar irradiation that hits its surface. Therefore, in locating areas suitable for the installation of SEGS solar power plants, knowledge of normal direct solar irradiation is crucial. Normal direct solar irradiation data generally are obtained from measurements made with specific equipment (pyrheliometer) or with mathematical models dealing with global irradiation (direct and diffuse portion). Meteorological satellite data have also been used to provide this information.
The ideal situation for a possible site for a power plant would be the existence of solar resource measurements for a period of at least five years, which would make it possible to perceive annual and seasonal variations. However, very few places have solarimetric stations, and, when they are available, they are insufficient (short temporal series) or low quality; therefore, normal direct solar irradiation data were used, modelled with satellite images. The resolution of the maps used was of 40 km, and they were modelled in the project known as Solar and Wind Energy Resource Assessment [14].
The values correspond to the annual mean daily values. For the semi-arid region in the Northeast, they were divided into three groups: irradiation from 4.0 to 5.0 kWh/m2, irradiation from 5.0 to 6.0 kWh/m2 and irradiation from 6.0 to 7.0 kWh/m2. For a more detailed approach, ILs must be crossed with seasonal data for solar irradiation (values referring to Summer and Winter).
3.3.3. Water Supply
An SEGS solar power plant (80 MW) operating with an annual capacity factor of 0.27 uses approximately 725,000 m3 of water [15]. This water quantity is necessary for the cooling towers (approximately 90%), vapour generation in the potency cycle (8%) and cleaning the mirrors (2%). The typical flux for the refrigeration tower is 320 m3/h. Water must be a proper quality to avoid incrustations and oxidation of the equipment. In the semi-arid region of the Northeast, water availability is a very important and crucial question given the shortness of surface hydraulic sources and that underwater water is normally brackish and has a low flow rate.
3.3.4. Area Availability and Terrain Topography
An 80 MW SEGS power plant requires an area of approximately 2 km2, of which approximately 500,000 m2 are for the collector set. The scale factor derived from SEGS experiences shows that it is advantageous to install several adjacent plants. Thus, the minimum required area availability is 8 km2 for a generation complex of 320 MW. In addition, terrain topography will determine site acceptability according to its impact in the cost relative to terrain preparation. Thus, the site must be as flat as possible, except for a declivity that allows natural terrain drainage.
The data used for determining the declivity were the images from the SRTM (Shuttle Radar Topography Mission) sensor. The images have a spatial resolution of 90 m, are in the Geo TIFF (16 bits) format and are geo-referenced to the Geodesic Reference System (GRS) WGS84, which is compatible with the SIRGAS2000 GRS for the applied work scale.
3.3.5. Connection with the Electric Network
The requirements for connection with the electric network of a solar power plant that uses parabolic cylindrical collectors are similar to those of other vapour plants. Because the construction costs of new transmission lines are, in general, very high and depend on the level of voltage and length of the line, solar power plants must be positioned as closely as possible to transmission lines. According to [16], a power plant that produces 80 MW of potency must have transmission lines of 230 kV potency for transporting the energy.
In the semi-arid region of the Northeast, existing transmission lines are from 230 kV to 500 kV. The 230 kV lines cover all the states of the region, whereas the 500 kV ones cover only the states of Ceará, Piauí, Pernambuco, Alagoas, Bahia and Sergipe.
3.3.6. Fuel Availability for Backup
Backup fuels are necessary for hybrid operation of the power plants. In SEGS plants, natural gas is used as a backup. In the semi-arid region of the Northeast, it is necessary to consider, in addition to natural gas, biodiesel and diesel oil. In addition to fuel availability for backup, the plant’s proximity to sources of this fuel is a determining factor. Hence, large distances can make hybrid operation economically unfeasible. In this study, be it due to the insignificance of the implantation of biodiesel power plants or the need for land transportation (because the railroads are precarious) for diesel over considerable distances, it was decided that hybrid operation of the solar power plants would not be considered.
3.3.7. Access
Site access is relevant due to the need to transportlargescale and fragile equipment (glass mirror). The criteria for classifying access are the width of highways, the quality of the road surface and the possibility of manoeuvringglarge-scale vehicles. Thus, for defining the access issue, a map of the road system of the semi-arid region, with the main federal and state highways that cross the region, was used.
4. Results and Discussion
4.1. GIS Application for the Location Study of Solar Power Plants
Once the Spatial Database (SD) was defined, the ILs were managed in the GIS to provide information that could give support to decisions about the power plant locations. This management was performed in two steps:
First Step: The IL crossings on the 1:10,000,000 scale aiming to provide a pre-location of the most promising areas for installing solar power plants;
Second Step: With this pre-location, more specific and detailed (on scales greater than 1:10,000,000) analyses were conducted for a case study, the state of Piauí.
4.2. Soil Usage and Occupation
Presentation of the result starts with one of the most important crossings between the ILs in this study: an analysis of the available areas for setting up a solar power plant considering only the usage and occupation of the soil in the region.
For Soil Usage and Occupation in the semi-arid region of the Northeast, the following ILs were considered:
• Integral protection conservation units and sustainable usage conservation units, both obtained from the Instituto Brasileiro do Meio Ambiente e dos RecursosNaturaisRenováveis [17];
• Atlantic Forest reserves, obtained from the Instituto Brasileiro do Meio Ambiente e dos Recursos Naturais Renováveis [17];
• Indigenous territories, obtained from Ministério do Meio Ambiente [18];
• Areas with agricultural potential, obtained from Empresa Brasileira de Pesquisa Agropecuária [19].
Urban and urban expansion areas were not considered on the 1:10,000,000 scale given that the representation of such areas would not be thematically visible. Similarly, the quilombola territories were not considered in the study due to the lack of information. However, in specific stud - ies (on larger scales, for instance municipalities), urban and quilombola areas must be considered in the analysis of soil usage and occupation.
With the ILs numbered above (the first three ILs), an environmental restrictions map was generated for the semi-arid region of the Northeast according to Figure 2.
The map in Figure 3 shows the classification of areas regarding the agricultural potential of their soil. This classification is presented in the spatial data attribute table and has the following categories: 1) very high; 2) high; 3) medium high; 4) medium; 5) medium low; and 6) low. For the spatial analysis, the objects of this research, the agriculturally suitable areas classified as “very high” and “high,” were considered unfit for setting up solar power plants.
Using the maps from Figures 2 and 3, Table 1 was generated, which presents, in quantitative terms, the areas occupied for each information plane regarding the semi-arid region of the Northeast.
Observing Table 1, it is possible to see that the areas considered unfit for solar power plants amount to 153123.67 km2 (18.40% of the area of the semi-arid region of the Northeast). Of this percentage, 9.30% are areas with restricted usage by Brazilian legislation (Conservation Units, Indigenous Territories and Atlantic Forest Reservation). The ILs that integrate the Soil Usage and Occupation group (indicated in Table 1) were crossed with the IL of the geographic region of the semi-arid region of the Northeast according to Boolean logic (punctual operations of field algebra). The ILs that integrate the Soil Usage and Occupation group were given a “zero” value in a specific field created in the attributes table.
For the IL that represents the semi-arid region of the Northeast and the areas with agricultural potential between “medium high” and “low,” a value of one was attributed in the generated field. In this crossing, the following criteria were used: If the semi-arid region of the Northeast is also one of the areas of the Soil Usage and Occupation group, classify as zero. Otherwise, classify as one. The result of this crossing is the map in Figure 4, which shows potentially available areas for inserting solar power plants according to soil usage and occupation. It is observed that there is area availability in all of the states in the semi-arid region of the Northeast, constituteing an enormous area: 694910.33 km2.
4.3. Direct solar Irradiation in the Northeast Region of Brazil
The IL crossings of the semi-arid region of the Brazilian Northeast with the IL from normal direct solar irradiation hitting the region are represented in Figure 5 (for annual direct solar irradiation between 4.0 and 5.0 kWh/m2), Figure 6 (for annual direct solar irradiation between 5.0 and 6.0 kWh/m2), and Figure 7 (for annual direct solar irradiation between 6.0 and 7.0 kWh/m2).
The annual average of daily direct solar irradiation has significant values in important parts of the Northeast region of Brazil, as can see on Figure 8.
The intensity of solar irradiation reaches very high values between 6.0 - 7.0 kWh/m2 (2190 - 2555 kWh/(m2∙year) for approximately 1/3 of the semi-arid region (Table 2). In the current international literature, the threshold for

Figure 2. Environmental restrictions usage map for the semi-arid region of the Northeast.
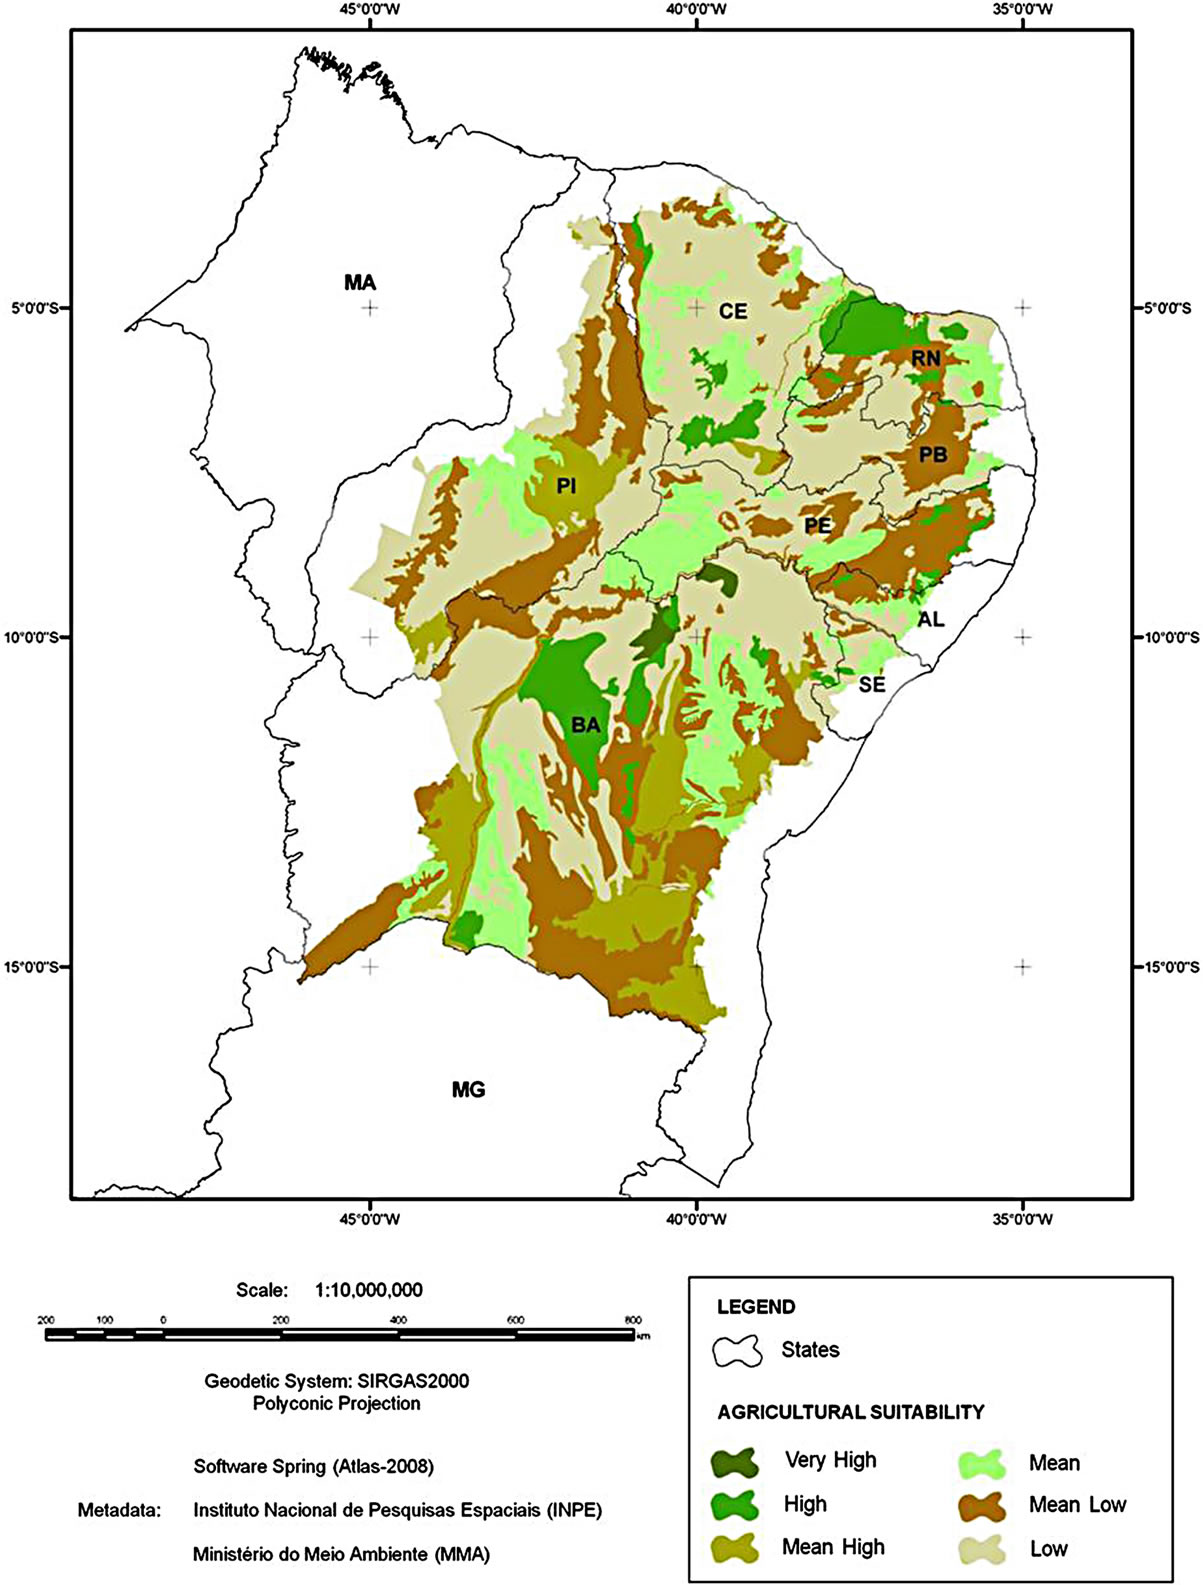
Figure 3. Agricultural potential map for the semi-arid region of the Northeast.

Table 1. Area distribution according to the attributes of the information plane that integrates the soil usage and occupation group.
evaluating sites for future concentration solar centrals is that direct solar irradiation should be greater than 1900 kWh/(m2∙year) and preferably greater than 2100 kWh/ (m2∙year). The discussed region meets those criteria easily. It is also important and interesting to highlight that the maximum seasonality factor in this region is of approximately 1.3, that is, for a solar central to generate constant annual potency, the collectors’ field must be scaled 30% larger to meet the demand for the worst period.
4.4. Pre-Location of the Areas Fit for Setting up Thermoelectric Solar Power Plants
Finally, a crossing of the IL of potential areas was performed, on the Soil Usage and Occupation group with normal direct solar irradiation IL, and the most adequate areas in the semi-arid region of the Northeast for installing thermoelectric solar power plants were identified. The criteria used were that the areas suitable for implanttation should have solar irradiation between 6.0 and 7.0 kWh/m2 and not occupy any of the areas of the Soil Usage and Occupation group (identified in Table 2).
The result is displayed in Figure 8, where it can be seen that the large areas that fulfil these criteria are found in Bahia, Piauí, Pernambuco and Paraíba.
After this spatial macro-analysis, smaller spatial regions were detailed on a state level. For this more specific study, other additional criteria were defined, such as terrain declivity, availability and proximity of hydraulic resources, access and transmission lines. The ILs used for the crossings in larger scales (state level) were the same as those used in the 1:10,000,000 scales given that with these data, it is possible to work on a scale of 1:1,000,000, according to the Class A Cartographic Accuracy Standard (CAS).
4.5. Pre-Location of the Areas Fit for the Set up of Thermoelectric Solar Power Plants
The state of Piauí occupies an area of 251529.186 km2, divided in 223 municipalities (Figure 9). The population estimative in 2009 was 3,145,325 inhabitants, according to [20].
Its declivity is shown in Figure 10 on the scale of 1:8,000,000. Observing the map, it is possible to verify that the relief is relatively flat with only slight inclinations. Most of the regions display a declivity less than 8%.
A significant portion of the territory of the state is covered by solar irradiation in the interval between 6.0 kWh/m2 and 7.0 kWh/m2. This region is located in the municipalities in the Southeast region of the state. Buffers in relation to hydraulic resources were generated at distances of 5 km to 20 km. Analogously, a buffer map was made for the access paths that cut through the state. 5 km to 20 km distance buffers were also used. The goal was to identify their proximity to areas with solar irradiation spots.
For transmission lines (230 kV), however, 5 km to 30 km buffers were used. The state is cut by 230 kV and 500 kV lines.
A superposition of the IL was made, as shown in Figure 11. It is observed that the region with solar irradiation between 6.0 and 7.0 kWh/m2 is cut by several main access roads (highways), hydraulic resources and 230 kV and 500 kV transmission lines. Finally, Figure 12 is the result of the crossing between Figure 10 and the declivity map, Figure 11. After analysing the results, it was observed that seven municipalities possess suitable conditions for setting up large-scale solar power plants.
This region occupies 8797 km2, has a population of 67,362 (a demographic density of 6.7 inhabitants per km2)
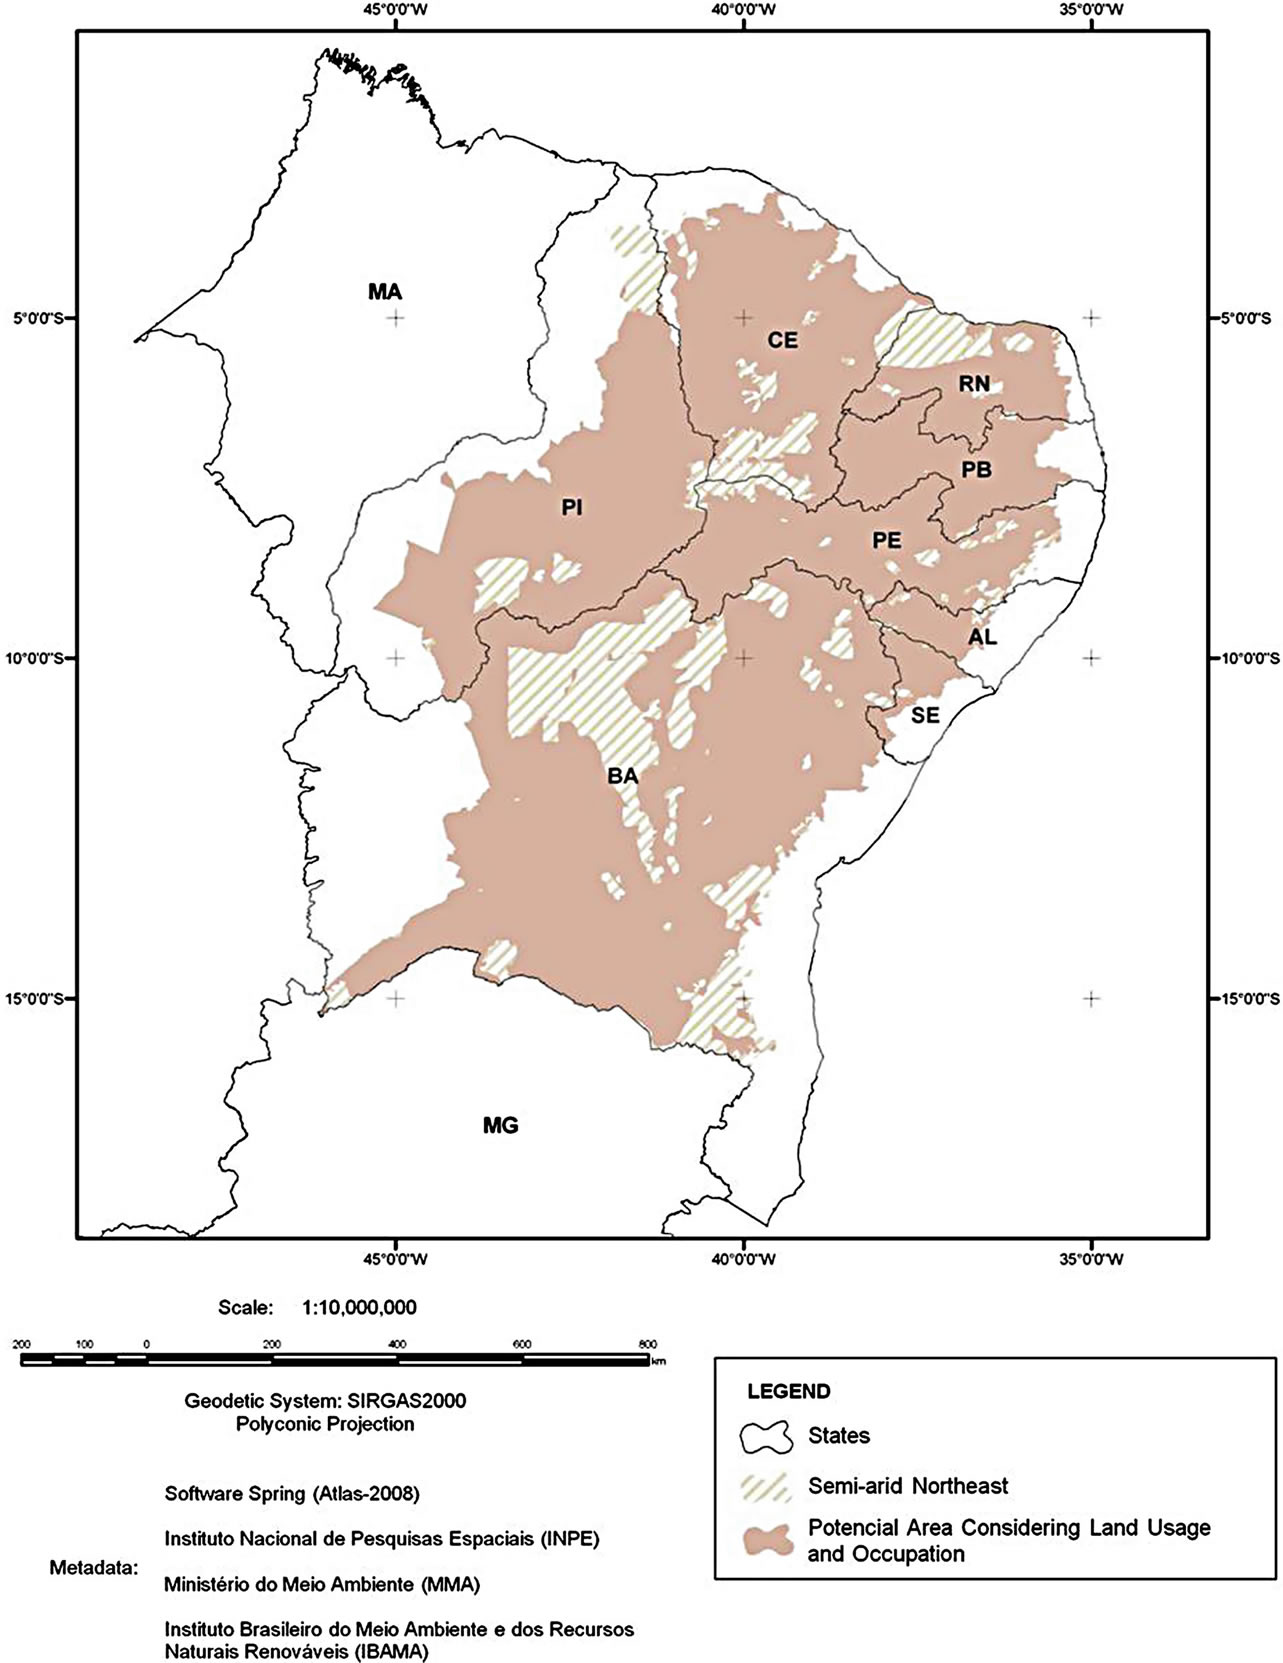
Figure 4. Potentially available areas for inserting solar power plants according to soil usage and occupation in the semi-arid region of the Northeast.

Figure 5. Potentially available areas with annual solar irradiation between 4.0 and 5.0 kWh/m2.

Figure 6. Potentially available areas with annual solar irradiation between 5.0 and 6.0 kWh/m2.
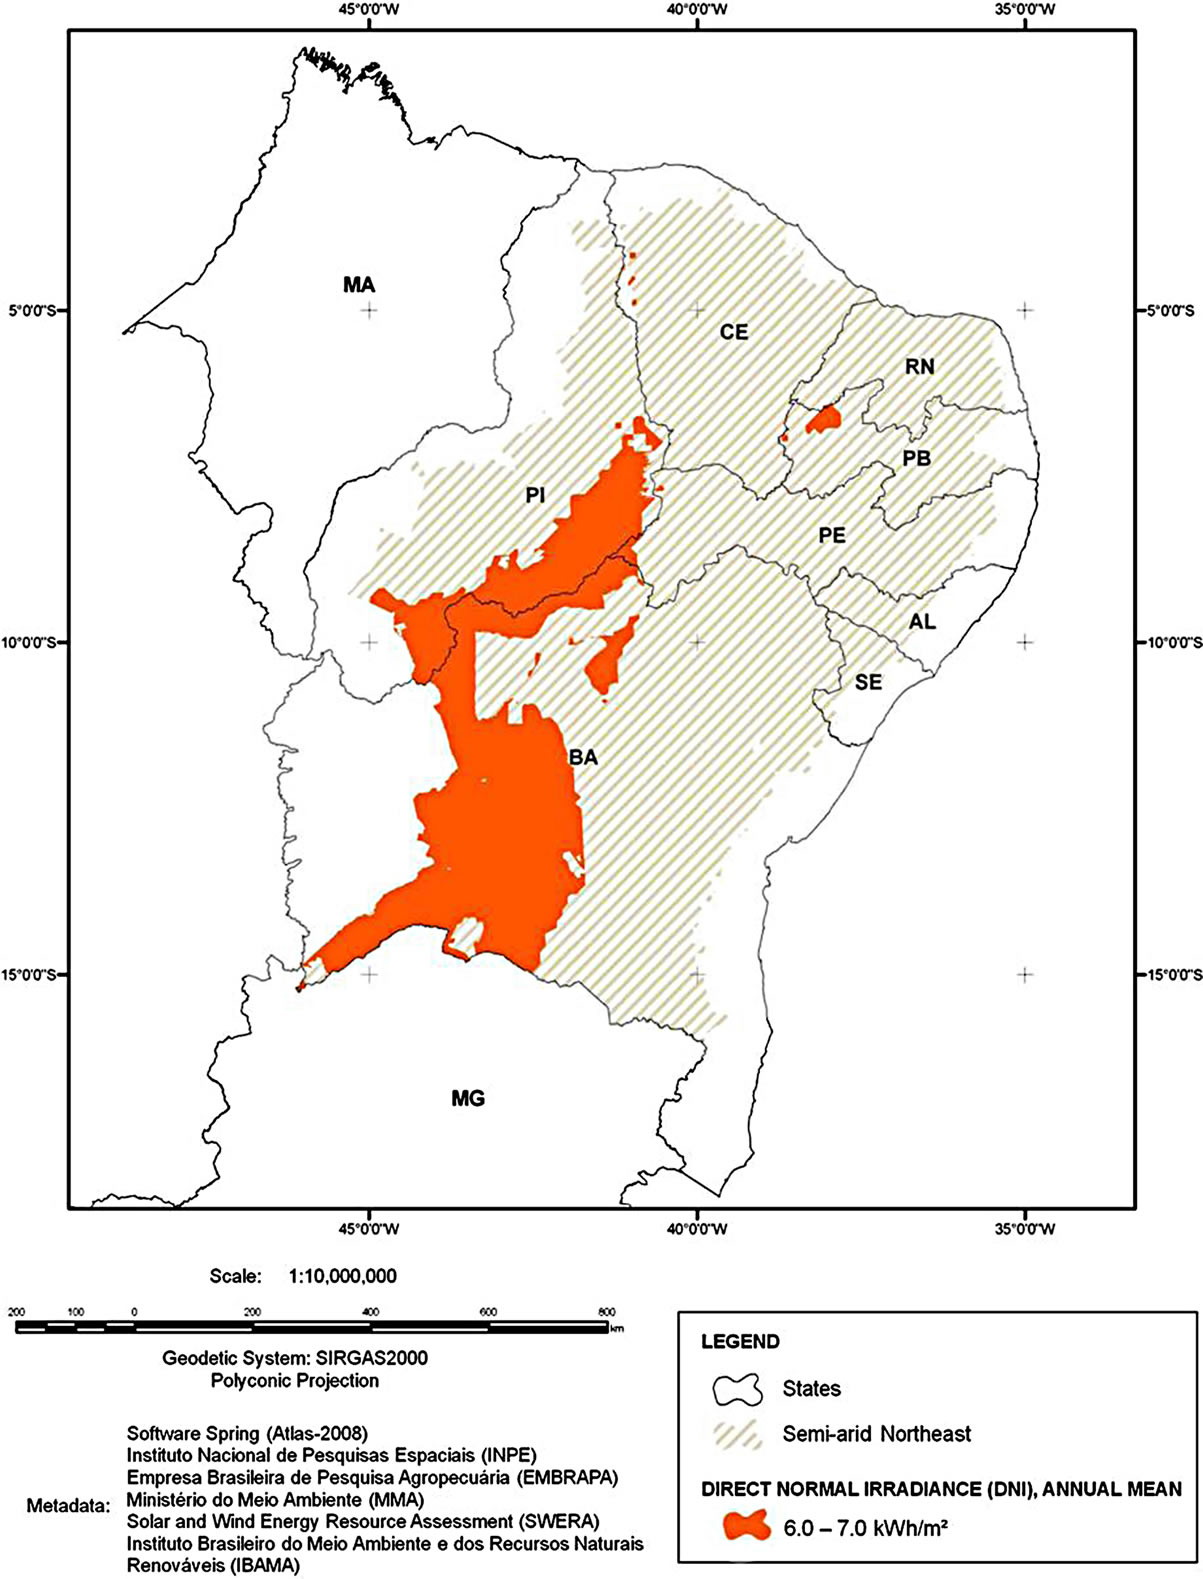
Figure 7. Potentially available areas with annual radiation between 6.0 and 7.0 kWh/m2.

Figure 8. Potentially available areas with annual solar irradiation between 6.0 and 7.0 kWh/m2.

Table 2. Potential area availability in the semi-arid region of the Northeast, according to the level of annual direct solar irradiation.
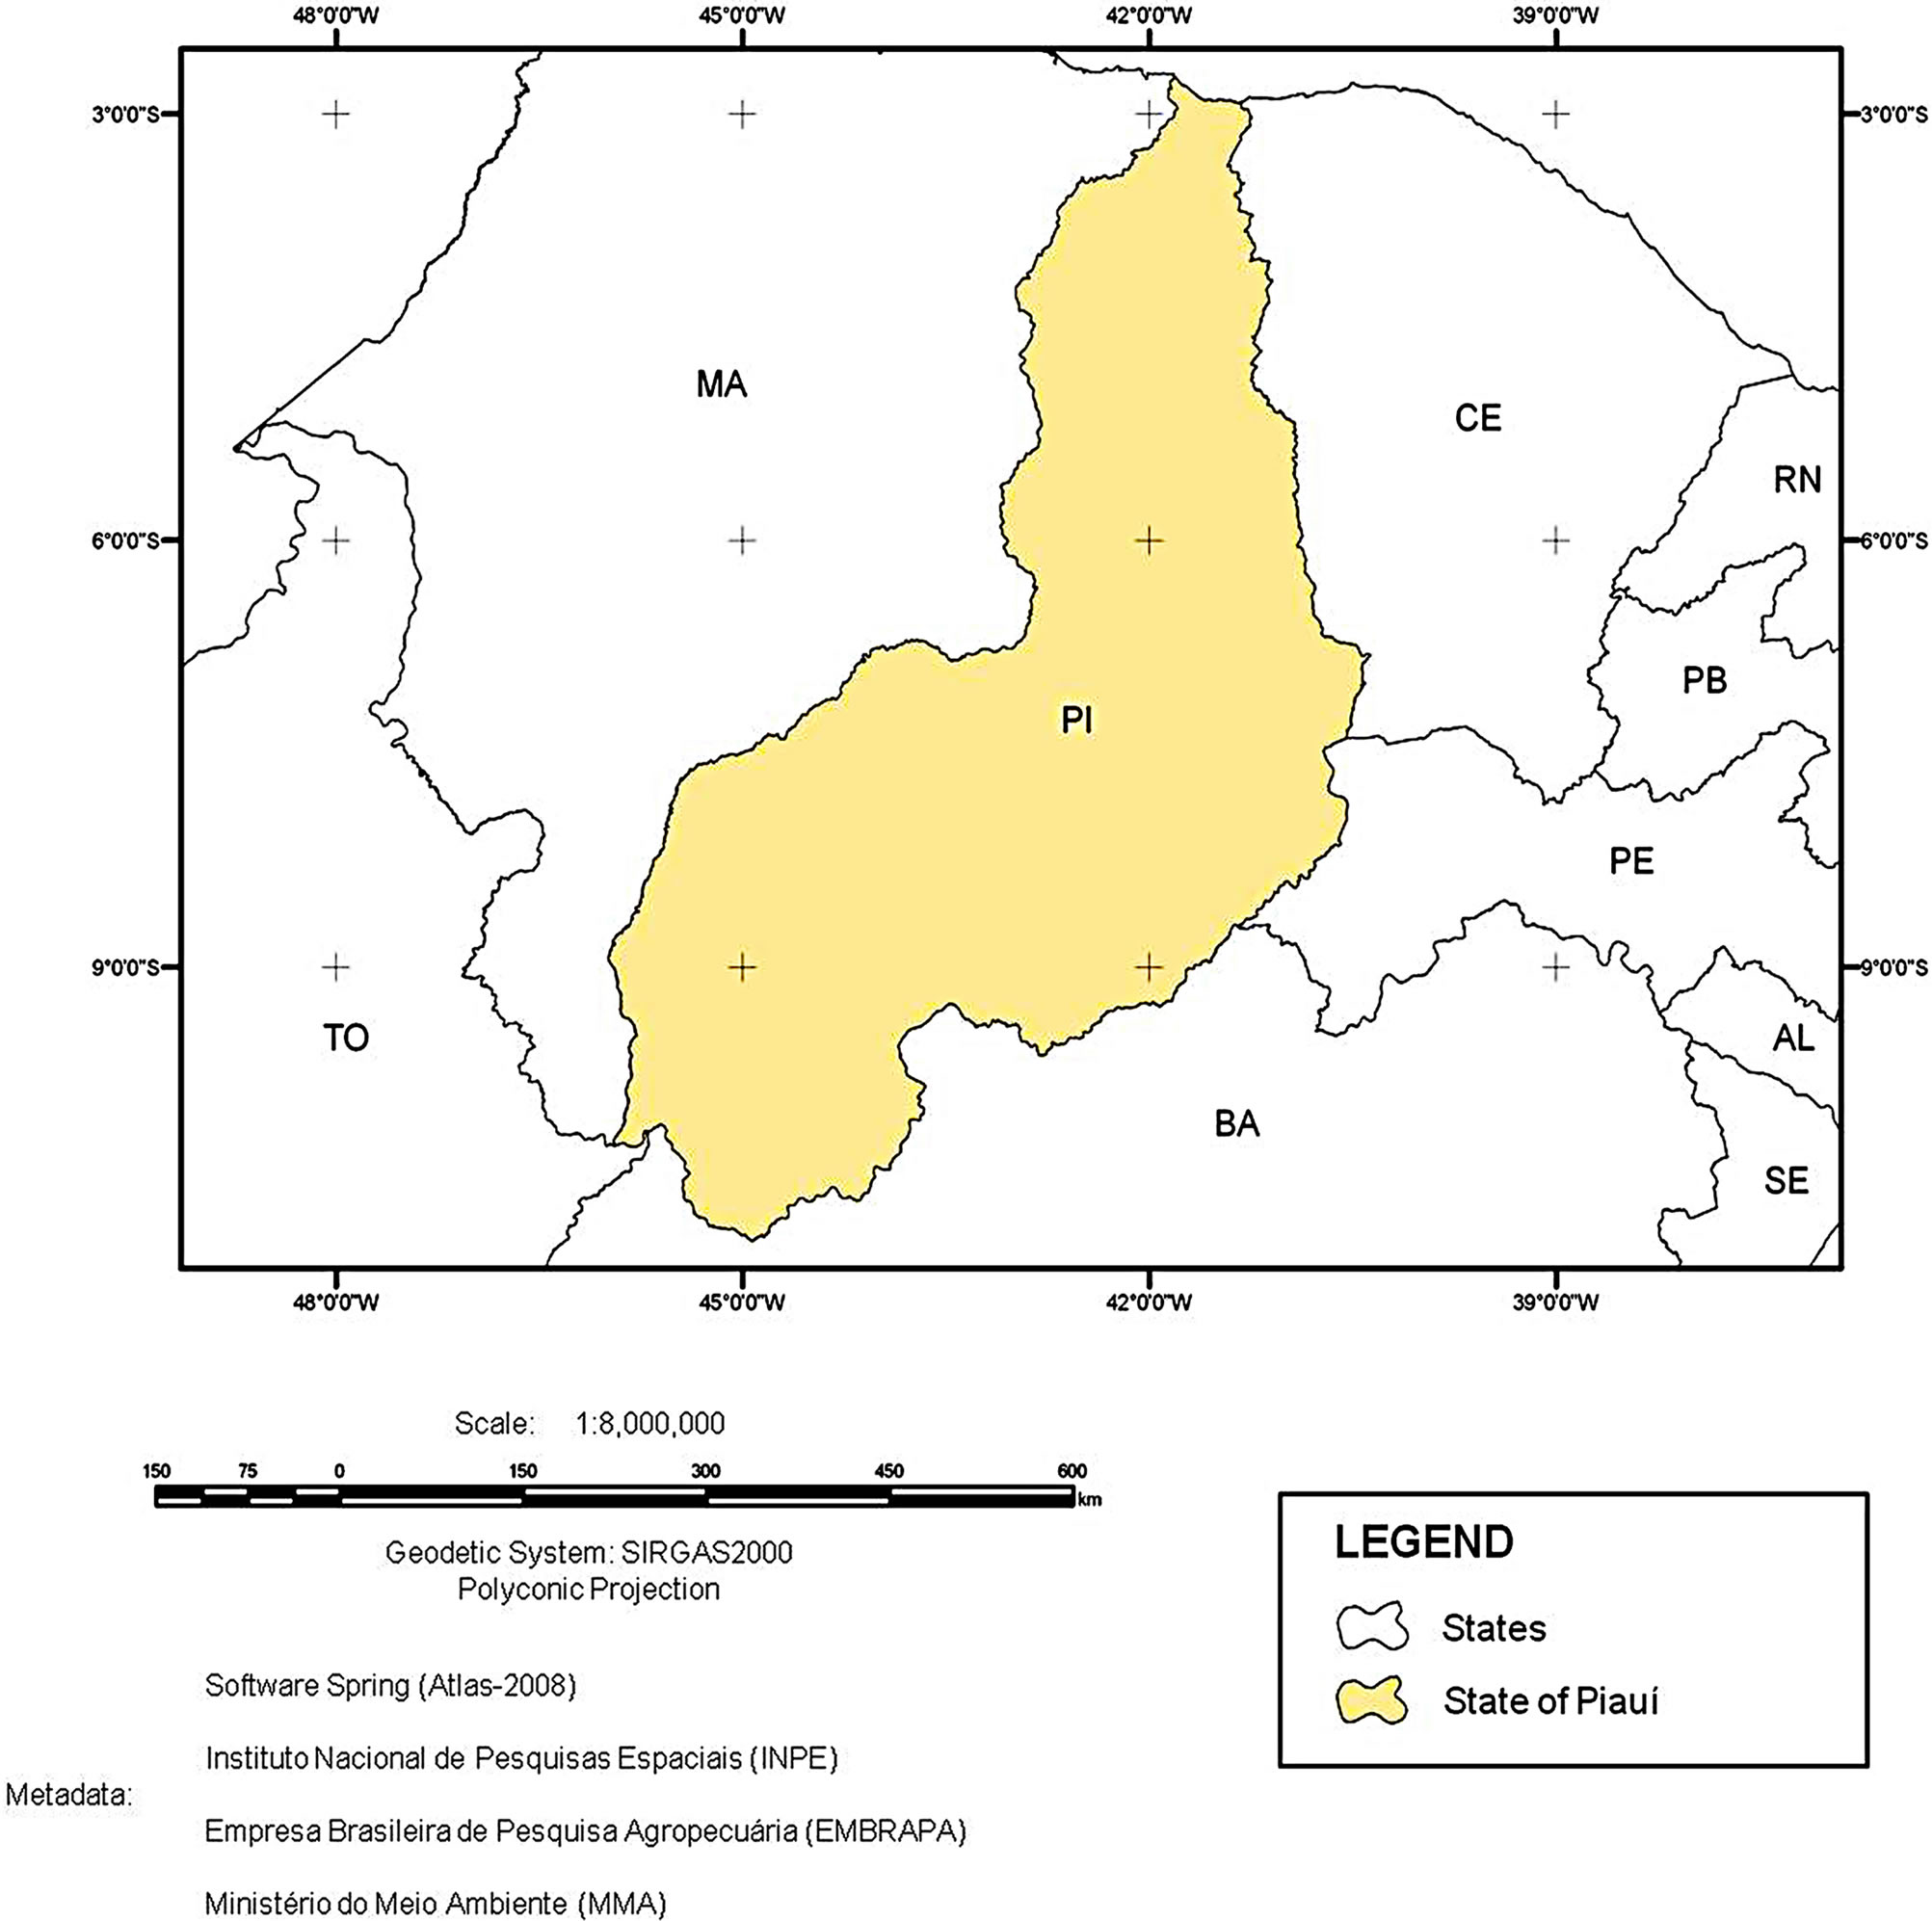
Figure 9. Map location of the Piauí State.
and has an average HDI of 0.555. Its predominant activity is agriculture and farming [20,21]. In addition, it is a region with no environmental reserves or other social restrictions. The low demographic density indicates that there is no need to remove people or excessive competition over soil usage.
5. Conclusions
Site evaluation and identification procedures using GIS are innovating decision-making procedures around the world and are contributing decisively to the quick growth in the implantation of CSP technology. Hence, in this study, identification and mapping of the most promising sites in the Northeast of Brazil were conducted so that the country can quickly initiate the process of implanting large-scale CSP solar technology.
The analysis performed in this study consisted of two steps: the first step was a macro approach (small scale—
1:10,000,000—semi-arid region of the Northeast) in which regions that were promising and fit for installation were identified, and the second step was a large-scale approach on the level of the Piauí state.
Very specific regions were outlined so that, in the sequence of this process, they might be visited and prioritised.
According to [22], for California, the installed capacity of parabolic cylindrical concentrators in terrains with a declivity of less than 1% is 43.26 MW/km2 for systems without storage and 30.82 MW/km2 for systems with 6

Figure 11. Crossing of the IL of solar irradiation, access paths, hydraulic resources and transmission lines in Piauí State.
hours of storage. For the first step, considering these values are valid for Brazil, the potential for the southeast region of Piauí alone is enormous. Given an absence of information regarding urban areas, terrain continuity, and other variables, we considered that only 10% of the potential area identified above would be adequate for the installation of solar thermoelectric power plants. Still, that area would amount to 879.7 km2 and had an installed capacity of 38.1 - 27.1 GW. This value corresponds to over 1/3 of the electric potency of the current Brazilian electric system. If the same calculation was done for the semi-arid region of the Brazilian Northeast, its capacity would be greater than 1000 GW. The considered area corresponds to approximately 3% of the semi-arid region of the Brazilian Northeast.
6. Acknowledgements
We hereby thank the ConselhoNacional de Pesquisa (CNPq), Centrais Elétricas Brasileiras S.A. (ELETROBRAS), Companhia Hidro Elétrica do São Francisco (CHESF) and Coordenação de Aperfeiçoamento de Pessoal de Nível Superior (CAPES) for their support to the

Figure 12. Crossing of solar irradiation, declivity, access paths, hydraulic resources and transmission lines IL in Piauí State.
solar energy research projects, which have provided the material means and the scientific environment for the execution of this research.