Climate Change and Variability in Southeast Zimbabwe: Scenarios and Societal Opportunities ()
1. Introduction
The occurrence of climate change in Zimbabwe and all over the world is no longer debatable [1,2]. Recent reports produced by the Intergovernmental Panel on Climate Change (IPCC) conclude not only that green-house gas emissions are already beginning to change the global climate, but also that Africa will experience increased water stress, decreased yields from rain-fed agriculture, increased food insecurity and malnutrition, sea level rise, and an increase in arid and semi-arid land as a result of this process [3]. Extreme weather events, notably floods, droughts and tropical storms are also expected to increase in frequency and intensity across the continent. These projections are consistent with recent climatic trends in southern Africa, including Zimbabwe. The effects of this exposure to changes in climate are exacerbated by the high levels of sensitivity of the social and ecological systems in the region, and the limited capacity of civil society, private sector and government actors to respond appropriately to these threats [2].
Zimbabwe is particularly vulnerable to climate change due to its heavy dependence on rain-fed agriculture and climate sensitive resources [4]. Agriculture’s sensitivity to climate induced water stress is likely to intensify the existing problems of declining agricultural outputs, declining economic productivity, poverty and food insecurity, with smallholder farmers particularly affected. Extreme weather events, notably drought, flood and tropical storms, are also likely to threaten development gains across a variety of sectors and intensify existing natural hazard burdens for the vulnerable populations in both rural and urban areas [5]. Consequently, climate change presents risks to lives and livelihoods at the individual level and to the economy and infrastructure at the regional and national levels and impacts on the ability to achieve sustainable development [6]. Climate change adaptation is therefore a principal development challenge in Zimbabwe.
The potential societal consequences of climate change over time in Zimbabwe are clearly game-changing. Adapting to a changing climate ought to be viewed as a business and development opportunity. While the threat posed by climate change through droughts, cyclones, heat waves and other severe weather events seem overwhelming, it presents unique opportunities for innovation, development and employment creation. To reduce the economic and social impact of climate change in Zimbabwe the focus has to be on adaptation to the changes that are necessary to thrive in changing climatic conditions. Adaptation to climate resilient smart initiatives such as reforestation, renewable energy use, recycled water for agriculture, rainwater harvesting, water use efficiency, and improved environmental planning and enforcement requires funding and implementation and should be promoted to provide opportunities to market innovations, generate employment and build climate resilient communities [4, 6].
Investment in alternative environmental practices that are resilient to climate change, will not only address the challenges presented by the climate change crisis, will but also help the economy, which is currently beset by high rates of unemployment and a growing debt to GDP ratio [6].
It is against this background that there is now a realisation that climate change opportunities to affected communities can be exploited to help adaptation [7]. Research has shifted to concentrating on the opportunities and potentialities that could be derived from extreme weather events [8]. What is now important is to focus on how people can sustain their livelihoods in the face of climate change and variability [9].
The major objective of this study is therefore to focus on the positives that can be exploited by farmers as a result of climate change. Specifically, the study analyses the climate change scenarios for south eastern Zimbabwe. Secondly the opportunities offered by these climate change scenarios to local farmers will also be explored.
1.1. Study Area
The area of study comprises the whole southeastern parts of Zimbabwe were mainly Masvingo province is located. The region is found in the south-eastern parts of Zimbabwe comprising of seven districts Bikita, Chiredzi, Chivi, Gutu, Masvingo, Mwenezi and Zaka. The region is 56,566 km2 in area with a total population of 1,318,705 of which 616,243 are male and 702,462 are female [10-12]. The main economic activities in the region include farming of mainly maize, groundnuts, roundnuts and small grains, commercial sugar plantation agriculture at Hippo Valley and Triangle Estates, cattle ranching and animal, tourism and a bit of mining [11]. The drainage of the region is dominated by the Save, Runde, Mwenezi, Mutirikwi, Tokwe and Limpopo Rivers [12]. The region has a number of dammed rivers which pass through it as it straddles the Save-Limpopo Catchment. The countryside is dotted by kopjes, hills and mountain ranges. The area is dominated mostly by sandy soils and the rich basaltic soils of the South Eastern Lowveld. Miombo woodlands dominate the wetter parts while Mopani trees, which are drought tolerant and sturdy, are found throughout the region. Figure 1 shows the study area of the research.
1.2. Climate of Southeastern Zimbabwe
The region is located in the south-east low veld of the country where rainfall is minimal and uncertain. The southern parts of the region are drought prone and occur in agro-ecological region 5 of Zimbabwe’s climatic regions. The area receives an average of 620 mm of rainfall per annum and average potential evapo-transpiration between 600 - 1000mm which by far exceeds the available water supply. The area has got an aridity index of between 0.2 - 0.5 and means that the region is semi-arid. Figure 2 shows the average temperature of the region [11,13].
The average temperature of southeastern Zimbabwe is 19.4˚C. The range of average monthly temperatures is 9.5˚C. The warmest average max temperature is 34˚C in October. The coolest average min temperature is 5˚C in July. Temperatures in parts of southeastern Zimbabwe, especially Chiredzi have risen by 0.6˚C since 1966 [9, 14]. Both the maximum and the minimum temperatures

Figure 1. Southeastern Zimbabwe showing the surface water characteristics within the districts of the region.

Figure 2. Average temperatures of southeastern Zimbabwe.
have increased. In some instances the temperature increase has surpassed the average global temperature increase of 0.4˚C [6,15]. Tentatively while the summer temperatures have become warmer the winters have also become warmer. Table 1 shows the relative humidity, hours of sunshine and precipitation of southeastern Zimbabwe.
Southeastern Zimbabwe receives on average 622 mm of precipitation annually or 52 mm each month. On average there are 75 days annually on which greater than 0.1 mm of precipitation occurs or 6.3 days on an average month. The month with the driest weather is July when on balance 1 mm of rain, drizzle and hail falls across 2 days. The month with the wettest weather is December when on balance 153 mm of rain, sleet and hail falls across 13 days [11].
Rainfall variability has become markedly wide in the country. The onset of the rains has been changing with the rains coming in late most of the times [2]. The dry spells are also increasing and this is having profound impact on the crop production rhythm of the area [10]. The cessation of rainfall is also unpredictable with rainfall periods extending into June and July and sometimes ending much earlier in March. The frequency and magnitude of flooding has also increased perhaps due to increasing frequency of land falling tropical cyclones within the Save-Limpopo Basin [11,14]. Even though these floods might appear to be far apart water logging conditions have tended to reduce the harvest in the area [14,15]. Despite, the seasonal variability in rainfall in southeastern Zimbabwe, it was realised that the average rainfall amount for the area has not changed significantly [15].
Mean relative humidity for an average year is recorded as 41.7% and on a monthly basis it ranges from 27% in September to 55% in February. Hours of sunshine range between 6.7 hours per day in January and 9.1 hours per day in September. On balance there are 2991 sunshine hours annually and approximately 8.2 sunlight hours for each day [11-12].
2. Research Materials and Methods
2.1. Materials Used
1) Daily climatic data for Masvingo Airport; Zaka and Buffalo Range stations.
2) Questionnaires.
3) GPS Handsets.
4) Statistical Package for Social Scientists (SPSS).
5) Arcview GIS.
2.2. Methods
This study is a result of a combination of data collection procedures and analysis. Data on the climate change scenarios in southeastern Zimbabwe was mainly obtained from daily climatic records of the Zimbabwe Meteorological Services Department (ZMSD). Daily rainfall and temperature data were obtained for three principal weather stations in southeastern Zimbabwe which are: Buffalo Range, Masvingo Airport and Zaka.
The weather stations provided weather data between 1900 to 2011. The data needed to be extended for a period of more than 30 years in order to be usable. This was meant to enable the determination of climatic variability and change in terms of rainfall and temperature. Similarly, climate change data need to cover a long period of time so that weather extremes can be determined for a number of stations. The climatic scenarios for each individual station were then derived and analysed as time series trend analysis.
A questionnaire survey was carried out in southeastern Zimbabwe to capture the views and perceptions of regions households on issues of climate change and variability. Households selected to take part in the survey were randomly chosen using the Arcview GIS random points generator points. A total of 200 points were generated and questionnaires administered. Global Positioning Systems (GPS) receivers were then used to navigate to the selected points.
Purposive sampling targeting the elderly of about 60 years and above was also used. The elderly were targeted because they would be in a position to make significantly reliable comparisons with past climate swings [16,17]. The questionnaire was targeting the household head. In the absence such persons the second influential person in the household was considered. However, in some cases informed males and females of twenty years and above in age were also considered suitable. The questionnaire dealt with the views and perceptions of households on environmental and climate change issues. Further, respondents were probed whether climate change has led to changes in livelihood systems for better or for worse.
Focus group discussions (FGD) were held to obtain

Table 1. Shows the relative humidity, hours of sunshine and precipitation of southeastern Zimbabwe.
more information on the views of men and women on climate change and variability and possible adaptation measures. The first FGD was held at Chief Nemamwa’s Homestead in Masvingo Rural District. The focus group consisted of eight men and eight women. The second FGD was held in Matibi 2 Area close to Gonarezhou National Park. In Matibi 2 Area the focus group consisted of the male chief, village headman, eight men and seven women. The age groups of the focus group participants were varied to capture the interests of everyone in the communities. The FDGs were used to identify the opportunities offered by climate change in southeastern Zimbabwe. In addition the exercise presented an opportunity to identify adaptation measures related to opportunities in the region.
Key informants at institutions with specialised knowledge on climate change were used in the study. These included chief researchers at Research Stations in, Agricultural Research and Extension (AREX) officers, community development officers from non-governmental organisations working on climate change issues in southeastern Zimbabwe were also interviewed. ZMSD officers also had an input into the study. Key informants helped in the provision of informed assessment of the role that could be played by exploitation of climate change opportunities and food availability in the region.
The questionnaires were then checked for completeness and other data quality related issues before being coded and entered in SPSS for further statistics exploration and analysis.
3. Results
3.1. Climate Scenarios for Southeastern Zimbabwe
The long-term climate scenarios for southeastern Zimbabwe show declining rainfall amounts and increasing temperatures. The rainfall amounts received in the region over time as compared to the national average rainfalls received over time are shown on Figure 3. Figure 3 shows that there is decline in both the National and southeastern Zimbabwe rainfall totals over time, however the annual rate of rainfall decline for region is lower than the national decline figure.
Figure 3 shows that starting from the 1960s to the 2010s there were marked variations in the precipitation pattern southeastern Zimbabwe. The years with extreme above normal rainfall were 1973/74, 1977/78 and 1999/ 2000 and this were replicated country wide. Years with extreme below normal rainfall were numerous and dominant in 1963/64, 1967/68, 1972/73, 1982/83, 1986/87 and 1991/92. There is a noticeable increase in departure from normal between 1960 and 1990 and the 1991/92 was the season of extreme drought for southeastern Zimbabwe and the southern African region.
Figure 4(a) shows the time series of rainfall at Zaka station in southeastern Zimbabwe. Rainfall over Zaka shows a fluctuating trend about the mean from year to year, however there is a marked increase in the magnitude of years of below average rainfall since 1980. Year of above normal rainfall have also declined but occa-

Figure 3. The national and southeastern Zimbabwe average rainfall for 30 years climatic periods from 1930-2010.
 (a)
(a) (b)
(b) (c)
(c)
Figure 4. (a) Longterm rainfall trend scenerio for Zaka station; (b) Longterm maximum temperatures for Zaka; (c) Longterm minimum temperatures for Zaka.
sional occurrence of extreme rainfall events above 1400 mm is also shown on the rainfall trend (Figure 4(a)). On average rainfall shows a declining trend at Zaka station as shown by the negative trend line equation on Figure 4(a).
Figures 4(b) and (c) show that both mean summer and mean winter temperatures have increased over the past 33 seasons at Zaka stations. It is mainly the summer temperatures that have increased by an average of almost 2˚C. Winter temperatures have increased steadily by almost 1.5˚C over the past 33 years.
Figure 5(a) shows the rainfall trend of Masvingo Airport station from 1950-1980. The rainfall pattern shows a fluctuating pattern from year to year but with more inci-
 (a)
(a) (b)
(b) (c)
(c)
Figure 5. (a) Longterm rainfall trend scenerio for Masvingo station; (b) Longterm maximum temperatures for Masvingo; (c) Longterm minimum temperatures for Masvingo.
dents of below normal rainfall than above normal. The trend also shows that seasons of extreme sudden peak of above normal rainfall occur occasionally. On average, the rainfall pattern of Masvingo Airport station has remained more or less constant with just a marginal increase as shown by the positive trend line on Figure 5(a). Figures 5(b) and (c) show that both summer and winter temperatures have been on the increase especially the summer temperatures that have gone up by an average of 0.5˚C over the past 33 seasons. Winter temperatures have only marginally increased by less than 0.01˚C.
Figure 6(a) shows the rainfall trend for Buffalo Range
 (a)
(a) (b)
(b)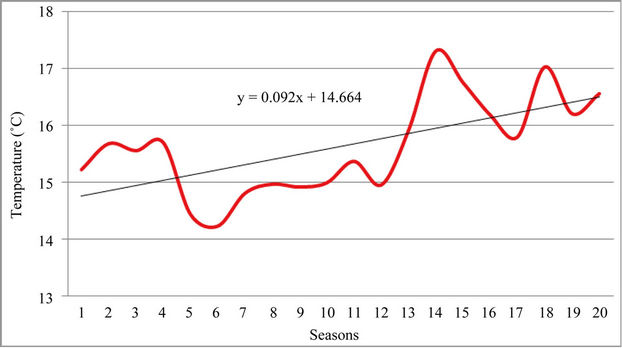 (c)
(c)
Figure 6. (a) Longterm rainfall trend scenerio for Bufalo Range station; (b) Longterm maximum temperatures Buffalo Range; (c) Longterm minimum temperatures for Buffalo Range.
Airport in Chiredzi District. The trend shows declining rainfall totals for the station over time as shown by the negetive trend line and a tendency to have occassional high peak rainfall events. The station trend aslo shows that the years of below normal rainfall are now frequently occuring more than those of above normal.
Figures 6(b) and (c) show the long-term trends of minimum and maximum temperature for Buffalo Range station. The figure shows that both summer and winter temperatures are on the increase. Maximun temperatures have gone up by an average of 1˚C from an average of about 29.5˚C to an average of 30.5˚C. Figure 6(b) also shows that winter temperatures have incresed by about 1.5˚C from an average close to 15˚C to about 16.5˚C.
Table 2 shows aspects of seasonal rainfall change and variability as perceived by farmers in southeastern Zimbabwe.
The major area of concern for southeastern Zimbabwe is the occurrence of drought at seasonal level. About 32% of the respondents were worried about the end of season drought which would normally wipe away their produce when they would be expectant of a better yield at the same time the season would have looked promising. About 26% of the responses were worried about the mid season drought which would normally occur at the middle of the growing season. Twenty (20%) of the respondents singled out beginning of season drought as having devastating effects on their yields as some crops and farming activities have strict schedules. About 16% of the respondents singled out terminal drought as a threat to their activities and also affects the hydrological set up of an area. Nearly 6% of the respondents singled out a whole range of other seasonal rainfall anomalies within the rainy season especially inadequate rainfall during rainy periods.
3.2. Climate Change Opportunities
Table 3 shows the climate change opportunities that can be derived from climate change as perceived by the local farmers.