1. Introduction
Glycine is the smallest molecule between the aminoacids; it has the simplest chemical structure (NH2CH2COOH) and it is part of various proteins in living of things [1-3]. Its function inside the organism is as inhibiting neurotransmitter in the central nervous system that acts as door of chlorine channel [4]. Because of the clinical significance of the proteins and aminoacids in the body, it is important to develop new and better techniques for your detection and quantification. Raman and infrared spectroscopy offers potentially powerful and noninvasive technique for analysis of biomolecules [5-7].
Raman spectroscopy has made great progress and partly because of its versatility of analysis. For example, the samples require no preparation in comparison with other techniques. However, there is a lack of information of this technique in the quantitative analysis, especially in the quantification of solid residues. Raman spectroscopy (macroRaman) is a technique that requires relatively large quantities of samples which has a detection limit of the order of concentrations greater than 10−3 M. Raman microscopy (microRaman) can detect small quantities of sample but still a high concentration (10−5 M) is necessary. This technique uses a combination of Raman technique and a conventional optical microscope to allow a micrometric characterization of the material [6,7]. The Drop Coating Deposition Raman (DCDR) method, based in the aliquots deposition on hydrophobic substrates, allows obtaining solid residues in the form of coffee rings. This technique has a detection limit about of 10−6 M [8-10]. For the detection of substances diluted to more low concentrations, methods such as the SERS (Surface Enhanced Raman Scattering) have been developed [11,12], which involve complex metallic substrates or synthesis of colloidal suspensions [13,14]. The SERS phenomenon is the enhancement of Raman signal from molecules in the presence of metallic nanostructures which has a detection limit around of 10−10 M [15,16].
All the quantification jobs that we have consulted showed a linear trend between the Raman signal and the concentration of the sample. This trend makes that this technique can be predictable in ideal conditions. Therefore, we are convinced that this work complements and helps to obtain quantitative information of various solid residues. Here, we have used the micro-drop deposition method determining the amount of material that is transferred to a substrate and we propose a relationship math in which the Raman signal is proportional to the number of molecules presents in the area of analysis. Moreover, we have introduced and demonstrated that technique of principal component analysis can be used to obtain quantitative information and discrimination of data in form simultaneous.
2. Materials and Methods
2.1. Raman Spectroscopy
We recorded Raman spectra with an Almega XR dispersive Raman spectrometer. An Olympus microscope (50X and 0.85 NA: numerical aperture) was used both for focusing the laser on solid samples (residues) and for collecting the scattered light in a 180-degree backscattering configuration. In addition, Raman spectra were accumulated over 25 s with a resolution of ~4 cm−1, the excitation source was 532 nm radiation from a Nd:YVO4 laser (frequency-doubled) and the laser power on the sample was 10 mW.
On aluminum substrates, aliquots of 1 µL were deposited and dried at 40˚C. These drops produced residues with form of coffee rings. Eight spectra were measured around of each ring. In first approximation, we have considered a homogeneous area  of 7.8 × 10⁻⁷ m2 and the laser spot area
  of 5.2 × 10⁻¹³ m2. We have found the geometric ratio
  that was of 6.6 × 10⁻⁷.
We seek to test the feasibility of implementing the microRaman technique for quantitative analysis using conventional substrates such as glass; silicon and aluminum foil [17]. The glycine aminoacid (99%) was purchased of Fluka and prepared in different concentrations from 0.133 M (10000 ppm) to 1.33 × 10⁻⁵ M (1 ppm) in tri-distilled water (QuimiNet, Mexico). All samples used in this work were used as received.
2.2. Theoretical Analysis
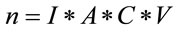
We have studied the following relationship:  , where we considered that
  and
and  are the volume and the concentration initial (sample of reference);
  is the area in a homogeneous configuration and
  is the area of the laser spot used in the Raman experiment. For an objective (microRaman configuration), we have used the following relation:
 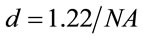 as the diameter of a circle. Where l is the wavelength of laser and
  is the numerical aperture of the objective, see Figure 1. Whereas a Gaussian beams, we determined the area of the laser spot [18].
However, we have noted that the number of moles “n” does not remain constant ( ), this changes as the volume of study decreases. Based on these considerations, a mathematical expression can be obtained for number of moles that exist within the laser spot (area or volume):

Figure 1. Gaussian profile of laser beam. “d” is the beam waist.
 (1)
(1)
where 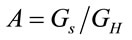 is the ratio between the geometry of the laser spot and the homogeneous geometry considered in the experiment,
  can represent the volume or the area of the laser spot, and
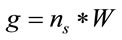
  can represent the volume or the residual area in a homogeneous distribution of the study sample. C is the concentration of the sample in Molarity and V is the volume of study in liters. If the number of moles in a system is known, the sample mass and the number of molecules can be determined with the following relations:
 (2)
(2)
 (3)
(3)
where, W is the molecular weight of the study sample and  is the Avogadro’s number (6.022 × 10²³ mol−1).
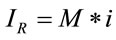
On the other hand, theoretically, it is known that the Raman intensity is mainly proportional to the intensity of the excitation source and to the number of molecules in the sample volume being probed with the Raman instrument [19,20]. Experimentally, it is known that the intensity of a Raman spectrum is directly proportional to the concentration. In this paper, considering the previous premises, we will propose and define that the Raman signal is proportional to the number of molecules by using the following simple relationship:
 (4)
(4)
where M represents the number of elementary entities and i represents the intrinsic Raman emission, which is individual and representative of the material of study under the experimental conditions. If we assume that , where
  represents the number of moles present within the laser spot (area). Using Expression (1), the unitary intensity can be expressed as
 . Similarly, it can be assumed that it also satisfies the relation
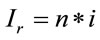 , where
  represents an arbitrary Raman signal. Therefore, the number of moles “n” can be determined in an arbitrary Raman signal with the following relation:
 (5)
(5)
where,  is the ratio between the arbitrary and reference Raman intensity. We observed that I varies between
 . Expression (5) represents the mathematical general approach proposed in this paper.
For solid residues, we must consider the following expression:
 (6)
(6)
where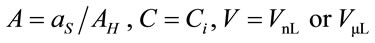 ; where
  and
and  are the laser spot and the homogeneous distribution areas, respectively, of the study sample;
  is the initial (reference) concentration; and
  is the aliquot in nanoliters or microliters deposited on the substrate.
However, it is observed that solid residues acquire habitually a heterogeneous distribution. Therefore, the n (experimental) value and the expected value  can be related by
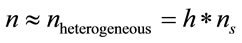 (7)
(7)
where h ≥ 1 and it is a scaling factor on a more real measure of the studied sample. This represents the different distributions of the sample when this evaporates on the analysis substrate. For example: h = 1, the distribution is 100% coincidental with the homogeneous distribution; h = 2, the distribution is 50% coincidental; h = 5, the distribution is 20% coincidental, and so on. We implemented all these expressions in an excel worksheet.
3. Results and Discussion
We have used the Equations (1)-(3) for analysis of glycine residues and have obtained the expected values in a micro-Raman experiment as the moles number, the mass amount and the molecules number present in the laser spot, see Table 1. Here, we have considered that the volume of 1 mL produced homogeneous residual areas (c.a. 1 mm) which obviously, they are larger than the area of laser spot. However, we have observed that the residue acquired a heterogeneous distribution which implies a lesser probability or certainty of that the residue or sample in study is found within the laser spot. Therefore, we note that in the microRaman configuration, the detection limit by glycine was found in a concentration of 10−5 M. However, we have found 10−16 g or 106 mole-
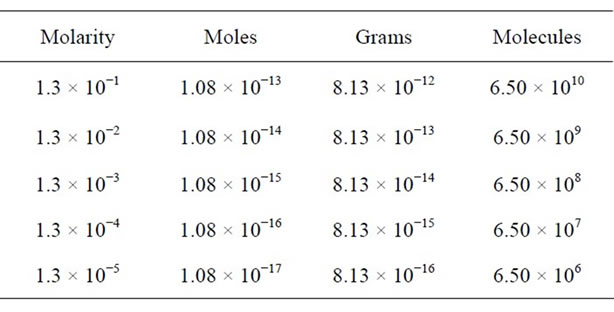
Table 1. Expected values in the homogeneous case (using the Equations (1)-(3)): initial concentration (molaridad); number of moles; mass amount and number of molecules.
cules into the laser spot. Finally, these equations us predicts that in 10−12 M, we should be detecting a single molecule. This range of concentration can be observed in work different, especially on SERS and SMD (Single Molecular Detection) jobs [21,22].
Due to heterogeneity in the drying of the sample, we have observed light variations in the intensity of Raman signal in several areas of the same solid residue. The most common solution to this problem is to use a standard sample, wherein a homogeneous distribution and that the concentration of the sample is assumed to be proportional to the ratio of the sample peak height to the standard peak height. The instrumental variation affect the signal measured from the standard sample in the same way as the problem sample signal, this method can achieve excellent quantitative results as will be seen in this work.
For this analysis, we have obtained eight Raman spectra from different areas of the residue and at the different concentrations. We have chosen the peak at 1328 cm−1 for the analysis that is a typical vibration of glycine aminoacid. Figure 2 shows the number of moles (geometric figures) and mass amount (black points) which they can be obtained in a microRaman experiment. For this exercise, we must know the reference Raman intensity  and the intensity of the problem sample
 , then we have used the Equation (6) for determine the number of moles. The concentration 10−1 M is a good point of reference for this range of concentrations.
Figure 3 shows the deviation values,  , between the expected and experimental data. Because of experimental complexity, we have observed that a homogeneous distribution is not adequate. Therefore, we have had that considerer a heterogeneous distribution by the analysis of solid residues. The Expression (7) is implemented and used when the value of “h” exceeds a value

Figure 2. Expected (line) and experimental (geometric figures) data for glycine sample.
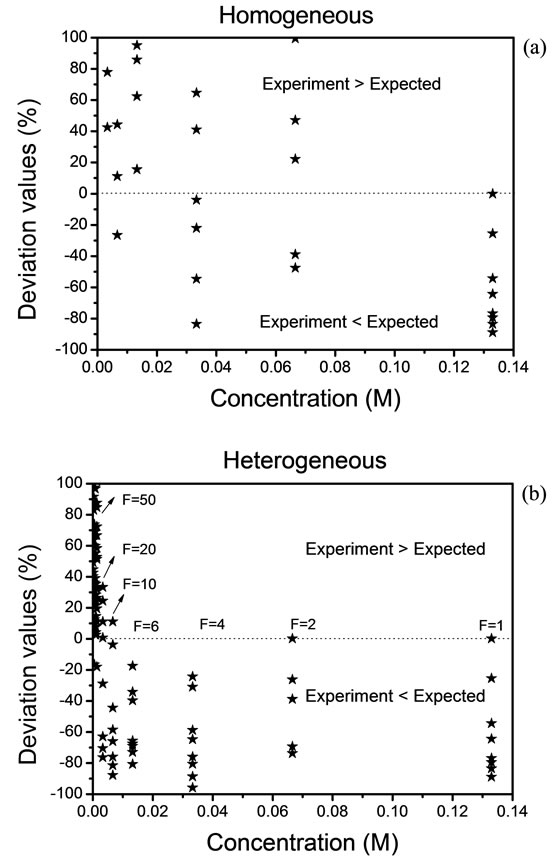
Figure 3. Deviation values of data, (a) homogeneous distribution and (b) heterogeneous distribution.
of 10. The deviation rises above of 100% and in this case, we must take a new reference. The results are shown in Figures 3(a) and (b).
The quantitative analysis of solid residues on substrates is not easy task. Here, we show that it is feasible obtain quantitative information changing the initial concentration (reference) to another point and detect other concentration using solid residues as 10−3 M. Figure 4 shows the number of moles that they can be obtained in a microRaman experiment. For this exercise, we must know the reference Raman intensity  and the intensity of the problem sample
 , then we use the equation 6 for determine the number of moles. The concentration 10−3 M is a good point of reference for this new range of concentrations. These results give us a first approximation the quantitative development of values in more reliable.
Figure 5 shows the deviation values between the expected and experimental data. Equally, because of experimental complexity, we have observed that a homogeneous distribution is not adequate in this experiment. Therefore; we have had that considerer a heterogeneous distribution by the analysis of solid residues. Again, the Expression (7) is used when the value of “h” exceeds a