Crossover from Weak to Strong Nonlinear Disorder in the Viscoelasticity of Glucose Incubated Erythrocytes ()
1. Introduction
The approach in this paper is based almost solely on the analysis of system trajectories in phase space; this is completely different from approaches based more directly on series analysis. We have tried to tie together tools and techniques that have proven most useful to date, and to present the results in a way that emphasize the deformability of the erythrocyte membrane, instead of the mathematical tools used.
We combine some new ideas with previously developped techniques, to make short term predictions on a library of past patterns in the photometrically recorded time series. By comparing the predicted and actual trajectories, we could make distinctions between a dynamical deterministic process and white noise. While for a chaotic time series, the accuracy of the nonlinear forecast falls off with increasing prediction time interval, for uncorrelated noise, the forecasting accuracy is roughly independent of the prediction interval.
The method proposed by Sugihara and May [1], also provides an estimate of the number of degrees of freedom, of the photometric time series attractor when is identified as chaotic.
Unlike many current approaches, this method does not require a large number of data points, instead seems to be useful when the observed process has relative few points, as happens in our erythrocytes photometric time series recorded under shear stress.
Erythrocytes of patients with diabetes mellitus have a shorter than normal life span, as a result of both intrinsic and extrinsic factors [2] such as: 1) elevated levels of glucose in blood, which is frequently observed in diabetes mellitus, are known to cause damage and death of erythrocytes [3]; 2) modification in the hemorheological properties of cells, which may be associated with glucose induced auto oxidation and glucosylation of erythrocytes proteins in hyperglycemia, can adversely affect the fluidity and oxygen delivery function of the erythrocytes [4,5]; 3) even though the biomechanical mechanisms of damage of cell membrane at elevated levels of glucose are not fully understood, evidence of molecular changes in erythrocytes constituents, resulting in increased calcium concentration and therefore altered erythrocyte viscoelasticity, have been extensively studied [6].
Our preliminary study on red blood cells (RBCs) complex behaviour, when is incubated in glucose medium [7], has shown the competition of Wavelet based Information Theory quantifiers: the Relative Wavelet Energy (RWE), the Normalized Total Shannon Entropy (NTWS), and in particular the entropy-complexity the MPR-Statistical Complexity Measure (SCM) when the erythrocytes are subjected to shear stress.
On this basis we applied another concept in the study of the manifestation of this behaviour. We introduce the technique of Time Delay Coordinates suggested by Takens, False Nearest Neighbours proposed by Abarbanel and co-workers, and the forecasting procedure proposed by Sugihara and May, the so called Correlation Coefficient, to find out the evident manifestation of a random process on red blood cell samples of healthy individuals (without treatment samples), and its sharp reduction of randomness on analyzing the in vitro effects on erythrocytes incubated in glucose medium.
2. Materials and Methods
2.1. Samples Preparation
Human venous blood samples from 8 healthy volunteers, red cell type 0, were anticoagulated with EDTA NA2 and maintained at 4˚C until they were processed. Whole blood was centrifuged at 800 × g during 10 min, plasma and buffer coat were then removed. The remaining RBCs were washed three times with phosphate buffer saline (PBS: pH 7.4) at 25˚C. Each packet of RBCs was divided into four aliquots. One aliquot was left untreated (w.t.) as a control sample. The other three aliquots were incubated in vitro with three glucose concentrations solutions at 37 ˚C during 2 hs. The hematocrit during incubation was 40%. These glucose incubating media were prepared by solving 2%, 5%, and 10% (w/v) of glucose in PBS, corresponding to 20, 50 and 100 g/L as recommended by Bourdon et al. [8].
An in vitro non physiological glucose concentration was chosen to accelerate the non enzymatic glycosylation that is known to depend on time and exposure to glucose [9]. After that, the cells were washed three times with PBS at 25˚C to remove any remnants of glucose. Each aliquot of RBCs was resuspended in autologous plasma to obtain the required hematocrit for each rheological determination [10,11]. The erythrocytes suspensions were obtained according to the experimental procedure described above and following the International Committee for Standardization on Hematology [12].
We could observe the presence of haemolysis during the post glucose washing with PBS at higher glucose concentration than 10%. The erythrocyte osmotic resistance and the erythrocytes viscoelastic parameters were measured in a previous work [13], evaluating the increasing in the fragility and rheological alterations of red blood cells with glucose level in the incubating media.
2.2. Data Acquisition
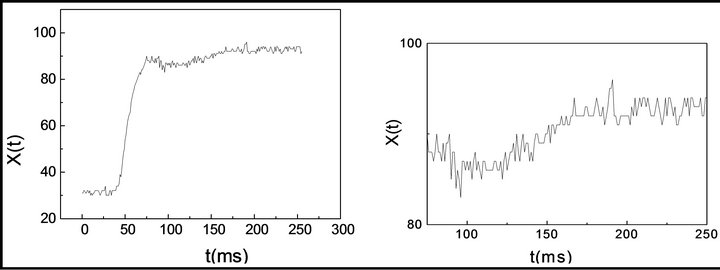
The time series were obtained measuring the fluctuations of the longitudinal axe fluctuations from the elliptical diffraction pattern corresponding to erythrocytes subjected to shear stress measured with the “Erythrodeformeter”, which has been completely described on previous works [14-16]. In this device, the RBCs suspension is sheared between two parallel concentric disks, an upper fixed disk and a lower rotating one. An adjustable power source supplies the motor with stationary voltage at constant speed, and can start and stop in less than 1 msec. A laser beam traverses perpendicularly the suspension of sheared erythrocytes producing a diffraction pattern, which is circular when the suspension is at rest and elliptical when the suspension undergo shear stress. Photometric readings performed along the longitudinal axe of the elliptical diffraction pattern are used to record the time series, see Figure 1, which are averaged over several millions of cells. The first 56 data points were removed because they are recorded when the lower disk of the Erythrodeformeter does not move, the method is applied to the recorded series corresponding to the cells subjected to well-controlled shear stress.
3. Data Analysis
3.1. Shuffle Surrogate Data
In order to investigate irregular fluctuations, and to be able to analyze whether the data can be fully described

Figure 1. Typical creep process and zoom for 56 < t < 256. X(t) measure of the longitudinal axe from the elliptical diffraction pattern, when the erythrocytes are subjected to shear strees.
by independent and identically distributed random variables, we apply the random shuffle surrogate to all the recorded series, which is effective for time series (as the photometrically corresponding to creep and recovery processes), with no periodicities where we want to destroy local structures on short term variability and to preserve the global behaviours.
To generate a shuffle surrogate, we randomly rearrange the values in the signal. The null hypothesis is that the signal is a set of values in no apparent order drawn from a finite population. An important role of surrogates is a numerical control of the results obtained for the photometrically time series [17]. The surrogates in this case are shuffle surrogates, generated by dividing all the series of 200 data points, in 20 series of 10 data consecutive points each, and concatenating them at random, to generate new and different time series of 200 data points.
This surrogate may seem trivial, but it is a good way to verify that some specific aspect of the distribution of values in the signal is not fooling the correlation coefficient algorithm. On our hypotheses surrogates are generated obtaining completely different time series which share the power spectrum with the original one.
3.2. The Percentage of False Nearest Neighbours
A particular set of points can be connected in time leading to an orbit or trajectory that represents the evolution of the system. The set of orbits starting from all possible initial conditions generates a flow in the state space and can be used to visualise the system’s attractor. However, limitations of such representation of the system include the conditions that every trajectory must be non-intersecting and that different trajectories originating from different initial conditions must not overlap or occupy the same space. This arises from the fact that a point in phase space representing the state of the system is considered to encode all the information about the system, including both its past and future history, which in a deterministic system must be unique.
Then, the points of an orbit acquire neighbours in this phase space. These neighbours, among other things, provide the information on how phase space neighbourhoods evolve in time. In an embedding dimension, that is too small to unfold the attractor, not all the points that are close one to another will be neighbours due to the dynamics. Some will actually be far from each other, and simply appear as neighbours because the geometric structure of the attractor has been projected onto a smalller space.
Abarbanel and co-workers [18] examined this question with increasing dimensions, until no false neighbours remained. They developed a method for geometrical considerations alone, known as false nearest neighbours (FNN), to find a value for the minimum embedding dimension to correctly analyze the process dynamics. This could be checked for increasing embedding dimensions for which noise signal ratios that is %FNN is less than 5%. The method of FNN, could be used as a test on measurements from dynamical system that have been corrupted with noise, when the contamination level is low, the residual percentage of FNN gives an indicator of the noise level.
3.3 Time Delay Coordinates
Specifically, we first choose an embedding dimension in which every trajectory must be non-intersecting. A very convenient way to reconstruct the dynamics of the process is to unfold the time series by successively higher shifts defined as integer multiples of a fixed lag τ, (τ = m∙ ∆t, where m is an integer number), and taking N equidistant point for creep and recovery process, we are able to define the phase space of all the possible states of the system variables under study. We used the technique of time delay coordinates suggested by Takens and co-workers [19]. For our time series, each sequence for which we wish to make a prediction is now to be regarded as an E-dimensional point, comprising the present value and the E − 1 previous values each separated by one lag time. We now locate all nearby E-dimensional points in the state space, as proposed by May & Sugihara [1] and choose a minimal neighbourhood defined to be such that the predict one is contained within the smallest simplex, that is the simplex with minimum diameter, formed with its E + 1 closest neighbours, a simplex containing E + 1 vertices is the smallest simplex that can contain an E-dimensional point as an interior one, it was also used for points on the boundary a lower dimensional simplex of nearest neighbours. The prediction is now obtained by projecting the domain of the simplex into its range, that is, by keeping track of where the points in the simplex end up after s time steps. To obtain the predicted value, we compute where the original predict one has moved within the range of this simplex, giving exponential weight to its original distances from the relevant neighbours. This is a nonparametric method, which uses no prior information about the model use to generate the series; the only information is the output itself. It should apply to any stationary or quasi ergodic dynamic process, including chaos. Plotting the conventional statistical coefficient correlation, C(s), between predicted and observed values as a function of s, such decrease in the correlation coefficient with increasing prediction time is a characteristic feature of chaos (equivalent of the presence of a positive Ljapunov exponent). This property is noteworthy because it indicates a simple way to differentiate additive noise that is uncorrelated, regardless of how far, or close, into the future one tries to project, whereas predictions with deterministic chaos will tend to deteriorate as one tries to forecast further into the future. We generated our predictions by using the first half: 200 points, avoiding the first 56 data points corresponding to the stationary process to construct an ensemble of points in an E-dimensional state space that is to construct a library of past patterns. The resulting information was then used to depict the remaining 200 values in the series. This collection of information has been little analyzed, when studying erythrocytes viscoelasticity and not at all in the light of contemporary notions about non linear dynamics.
3.4. Random Walk Approach: Correlation Coefficient
Thanks to Einstein’s intuition, the phenomenon observed by the Scottish botanist Robert Brown in 1827, becomes the keystone of a fully probabilistic formulation of statistical mechanisms and a well established subject of biological investigations. There is also an ongoing debate in the true origin of irregularity that makes the stochastic, random character of Brownian trajectories. This discussion on Brownian motion also inspired mathematicians like Cauchy, Lévy, Mandelbrot and many physicists and engineers to go beyond Einstein’s formulation. Nondifferentiable Brownian trajectories in modern language are called fractal and statistically self similar on all scales [20].
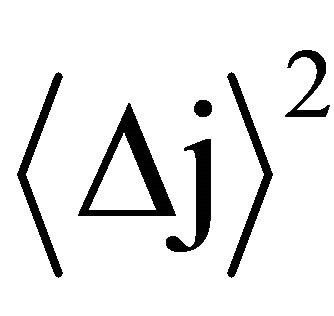
In a classical non differentiable trajectory or more generally, ordinary Brownian motion (OBM), past increments in displacement are uncorrelated with future increments, that is, the system has no memory. In such cases, the mean square displacement is linearly related to the time interval ∆t by the expression:

where:  is the mean square displacement and Kj is a constant, which depends on the process.
The constant K is an average measure of the stochastic activity. In a correlated random walk, or more generally, fractional Brownian motion (FBM), past increments in displacement are correlated with future increments, hence the system has memory. In such cases, the mean square displacement is generalized by the following scaling law:

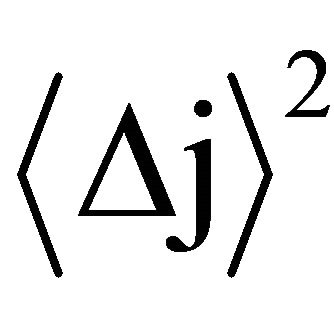
where:  is the mean square displacement
  is the scaling exponent for creep and recovery, and 0 < Hj < 1.
This scaling exponent quantifies the correlation in function of the steps increments making up the trajectory of a random walker. This is best illustrated by considering the correlation coefficient for Brownian motion, proposed by Feder (1996), which is given by the expression:

where:


In order to obtain the correlation coefficient C(s) between the photometric time series of the recovery process, Y(t) and the theoretical Y*(t), we applied May and Sugihara algorithm. We correlated Y*(t), obtained from the series corresponding to the creep process, X(t), with Y(t) which is the recorded recovery one, for the different steps increments. For details see Ref [20,21].
4. Results and Discussion
Certainly, the use of a nonlinear quantifier is not intended to replace conventional analysis, but to provide further insights into the underlying erythrocytes deformation mechanisms. Understanding a system’s behaviour and how it is altered under pathological conditions is on one hand a way of diagnosis, and on the other hand it is effectively just another word for treatment [21]. Random behaviour is as one might expect unpredictable. Thus the question of randomness in a data series is a relative one, and more a question of mixtures of determinism and randomness. Since noise is present in all physical measurements, determining if randomness is inherent in the system dynamics or in the measurement process is not always straightforward. This is an active work trying to connect photometrically recorded time series of erythrocytes subjected to well control shear stress, with nonlinear correlation quantifier to understand the changes on the different erythrocytes populations.
By the very beginning, we apply to all the series the first differences: xt+1 − xt, in order to whiten the series, that is, to reduce the autocorrelation, and also to diminish any signals associated with simple cycles.
In order to reconstruct the process dynamics we use the technique of delay coordinates suggested by Takens and co-workers. The phase space dimension was chosen applying Abarbanel method of false nearest neighbours. Thus, we obtained for five different and increasing embedding dimensions, the %FNN, and it was found that when m = 7, the system’s attractor would be completely unfold, so was chosen this embedding for our analysis. The results obtained are shown in Table 1.
In order to improve the results, we concatenate on each 200 data series, individuals 25 correlated data points into a long data set of 10 of the 25 data trials and compute the test statistic correlation on the entire set. Then, this new series are shuffled and we have generated a surrogate data set. As a consequence, the number of surrogate data sets that can be generated is considerably increased, because any perturbation of the trial segments yields new surrogates. However, one should be careful,

Table 1. Embedding dimension m vs. %FNN.
because if two different permutations move a given trial segment into the same location, the terms of the test statistic will be the same for both permutations, in our shuffle surrogates, this has been avoid.
So, for testing the method and the proposed algorithm we contrasted it with all the time series of shuffle surrogates as long as the one which corresponds to the photometric time series and it was found to be white noise.
This is a random process in which the values at each time are statistical independent from each other. In Figure 2, we show the grand average of all the shuffle surrogates.
There is a perfect correlation of the signal with itself; and there is no correlation at the entire signal with any shifted version. The process has no memory; past values have no impact in subsequent values as it is expected on a shuffle surrogate (noisy) time series.
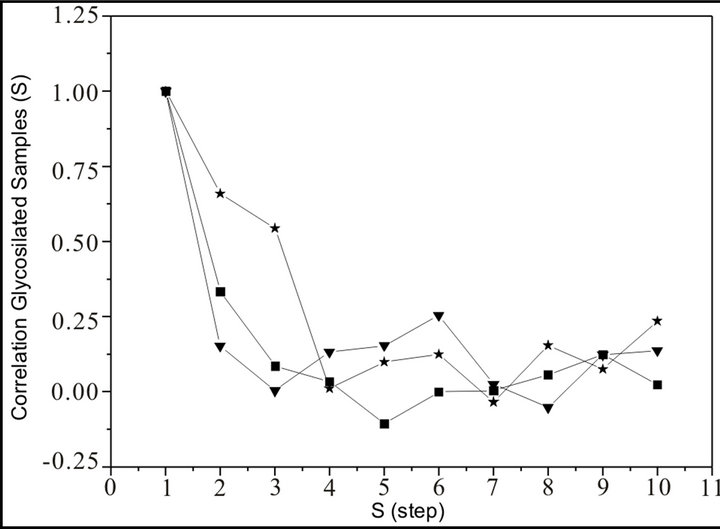
The results were very different comparing samples without treatment (healthy controls) and different percentage of glucose incubated samples. As a preliminary indication of the possible clinical utility of this technique we have included the linear-linear plots of the correlation coefficient when the diffractometric data belongs to samples without treatment. This independence between the correlation and the step process could appear because we are dealing with uncorrelated additive noise, and such uncorrelated noise could be due sampling variations. Also the accuracy of the prediction, as measured by C(s), shows no systematic dependence on s, between experimental and theoretical ones, remains independent. By contrast, in glucose incubated, it does show the decrease in C(s) with increasing s, as illustrated in Figure 3, which is characteristic of a chaotic sequence.
On samples without treatment (healthy controls), see Figure 4, it could be ordinary Brownian motion (oBm), where statistical properties such as invariance or range are not related at all. On the other hand on glucose incubated samples, it would be fractional Brownian motion (fBm), it is fractal in the sense that self-similar, in a statistical sense, that is statistical properties are related over different time scales by a way of a power law. In other words, the stress process gives us some special information of the relaxation one in a short time and the series exhibit a great sensitivity to initial conditions.
There are many descriptions of the typical activity that accompanies the deformation but few detailed or quantitative analysis.
Moreover, the quantification of the recorded signals gives the possibility of studying the interactions among

Figure 2. Grand average of the correlation of surrogates samples vs. S (step).

Figure 3. Correlation of Glucosylated samples: a) 5% Glucose incubated (star); b) 2% Glucose incubated (square); c) 1% Glucose incubated (triangle) vs. S (step).

Figure 4. W.T.: Without treatment samples vs. S (step).
different anatomical structures [22], and the viscoelastic properties of several million of shear elongated cells. One important finding relates on the complexity of the erythrocytes dynamics, using Sughiara and May’s algorithm in a rather loose manner, meaning more noise-like instead less regular, is to get insight in the process. This study found that the correlation coefficient increased with disease. In other words, there is such thing as healthy variability. A decrease in this variability could indicate a decrease in health, and variability can endow a system with flexibility and hence the ability to respond and adapt to environmental stressors [23]. Whether this variability is random or chaotic was a key in this study. One of the hopes of the recent application of nonlinear dynamical methods to physiology is that they could provide a general mathematical framework that has been missing from this traditional rather qualitative field. In this respect, introducing quantifiers derived from nonlinear dynamics could help with the description of the different red cell networks that could put at stake the cytoplasm and membrane interactions. Moreover, the present results open the possibility of applying novel techniques, to photometrically recorded series from erythrocytes subjected to shear stress, for a quantitative characterization of those behaviours. Works in this direction, and also further studies with larger and well defined patient populations are in process in order to attain a better validation of the method.
5. Conclusions
Randomness and structural correlations are not totally independent aspects of the accompanying physical and biological description of the erythrocytes deformation. Ascertaining the degree of unpredictability and randomness of a dynamical biological system is not automatically to be in a position to capture the relationship between the components of the pertinent process. Moreover, maximal randomness as well as perfect order has no structural correlations. In between these two extremes, a wide range of possible degrees of physical structures exists on the data that should be found in the behaviour of the probability distribution.
This is active work, trying to use time series analysis for practical applications, this includes: identification of those erythrocytes from healthy individuals and allow not only the understanding of erythrocytes behaviour of patients with severe anomalies and early diagnosis but also classification of the disease from the point of view of nonlinear dynamics.
In this work it was first proved the method’s consistence by means of the results for all the shuffle surrogates obtained from the recorded time series, which results to be non correlated random walk, as it is well known for a noisy time series. Second, it applied the method for the erythrocytes samples without treatment (healthy controls), resulting also ordinary Brownian motion and finally we obtained the Correlation Coefficient for the series of glucose incubated erythrocytes at different glucose concentrations, and in those cases the results have shown that the correlation coefficient for the first steps of the process, increased when increasing the percentage of glucose in the samples. Those glucose incubated samples have lost the viscoelastic properties, proving there is some fractal like underlying behaviour.
The mechanisms through which diabetic disease could induce vascular damage are both metabolic and mechanical. Hemorheological alterations in diabetes, simulated in this work by glucose incubated samples, are the result of changes affecting both erythrocytes intrinsic structure and their interactions with the plasmatic components. Several hemorheological variables could influence and produce an impaired erythrocyte deformability determining an increased flow resistance in the microcirculation. The glucose-protein interaction can change the activity of membrane protein [4]. It was also reported that there were some changes in the stiffness and the fluidity of glucose incubated erythrocytes membrane [5]. Once we can predict the future, it is natural to try to control that future, in order to guide the system to a preferred state or keep it away from undesired states.
These basic goals of understanding, prediction, and control are closely related to the practical clinical goals of diagnosis and treatment, which underlie much of the rationale for research into physiological systems.