Learning Based Falling Detection Using Multiple Doppler Sensors ()
1. Introduction
In these days, the elderly population has been growing thanks to advances in the medical field. Healthy, safe and secure life is important particularly for the elderly. However, we are faced with problem of increasing the old-age dependency ratio. The old-age dependency ratio is the ratio of the sum of the population aged 65 years or over to the population aged 20 - 64. The ratio is presented as the number of dependents per 100 persons of working age (20 - 64). According to estimates of the United Nations, for about 30 countries, this ratio is projected to reach 30% in 2020 [1]. In particular, it is expected to reach 52% in Japan. There is an urgent need to develop automated health care systems to detect some accidents for the elderly.
Falling detection is one of the most important tasks to prevent the elderly from having crucial accidents. Yu [2] and Hijaz et al. [3] classified falling detection systems into three groups, wearable device approach, ambient sensors approach, and cameras approach. Wearable devices are easy to set up and operate. Devices can be attached to chest, waist, armpit, and the back [4]. The shortcomings of these devices are that they are easily broken, and that they are intrusive. Furthermore, the older we become, the more forgetful we become. Therefore, no matter how sophisticated the algorithm implemented on wearable devices is, there is no meaning if they fail to wear them. On the other hand, ambient sensors such as pressure and acoustic sensors can also be used. These sensors are cheap and non-intrusive. Moreover, they are not prone to privacy issues. However, pressure sensors cannot discern whether pressure is from the user’s weight, while acoustic sensors show high false alarm rate in a situation of loud noise [5]. Cameras enable remote visual verification, and multiple persons can be monitored using a single setup. However, in private spaces such as bath and restroom, cameras are prohibited. Also in living room, many people do not want to be monitored by cameras.
Doppler sensor is an inexpensive, palm-sized device. It is capable of detecting moving targets like humans. Using this sensor, we can construct passive, non-intrusive, and noise tolerant systems. Activity recognition using Doppler sensor has been actively studied recently. Kim et al. proposed classification of seven different activities based on micro-Doppler signature characterized by arms and legs with periodic and active motion [7]. Subjects act toward sensor. An accuracy performance above 90% is achieved by using support vector machine (SVM). Tivive et al. [8] classified three types of motion, free arm-motion, partial arm-motion, and no arm-motion. Based on arm-motion, they describe human activity status. Liu et al. [9] show automatic falling detection. They use two sensors, which are positioned 1.8 m and 3.7 m away from the point of falling. The data of each sensor is independently processed. Subjects act forward, back, left-side, and right-side fall. The directions of activities include between two sensors, toward a sensor, and away from a sensor.
Doppler sensor is sensitive to the objects moving along irradiation directions; however, less sensitive to movements orthogonal to irradiation directions. For the practical use of Doppler sensors, we propose falling detection using multiple Doppler sensors to alleviate the moving direction dependency. By using sensors that have different irradiation directions, each sensor complements less sensitive directions of the other sensors. Sensor data are processed by feature combination or selection methods. In the combination method, features of multiple sensors are simply combined. In the selection method, the sensor is selected based on the power spectral density of the particular bandwidth, which characterizes the falling activity. After the process of each method, features are classified by using SVM or k-nearest neighbors (kNN). We evaluate both methods in terms of the number of features, the number of sensors, and the type of classifier. We also discuss the accuracy of each activity direction and the viability of these methods for the practical use.
The remainder of this paper is organized as follows. In Section 2, we introduce basic Doppler sensor system, how we can determine target velocity from Doppler shift. In Section 3, we explain about flow of the proposed falling detection algorithm using multiple Doppler sensors. In Section 4, the sensor setup of the proposed method and the type of tested activities are explained. Our methods are evaluated by comparing them to the one sensor method. We discuss the accuracy of falling detection for each activity direction, and the viability of the proposed feature combination and selection methods in terms of the practical use. In Section 5, we draw conclusion.
2. Doppler Sensor
In this section, we discuss the basic information about Doppler sensor. Doppler sensor transmits a continuous wave and receives the reflected wave which has its frequency shifted the moving object. The Doppler shift is defined as
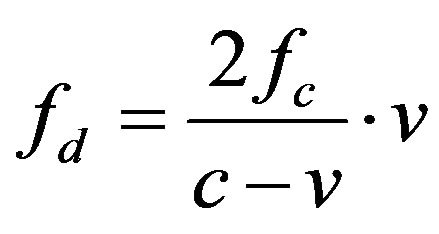 (1)
(1)
where v is the target velocity, c is the light velocity, and fc is the carrier frequency. In Equation (1), since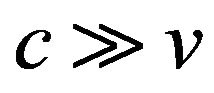 , the target velocity is represented as c
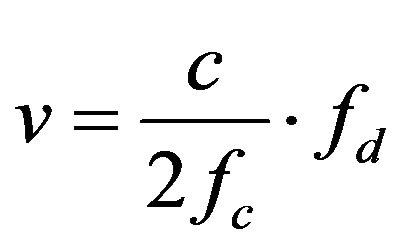 (2)
(2)
fc and c are the given values. Only by observing the Doppler shift fd, we can determine the target velocity v.
3. Falling Detection Algorithm Using Multiple Doppler Sensors
In this section, we show the proposed falling detection algorithm using multiple Doppler sensors. Figure 1 depicts the algorithm of falling detection. Our approach involves four phases: 1) Decision of extraction time range, 2) Feature extraction, 3) Feature combination/selection, 4)Training and classification.
3.1. Decision of Extraction Time Range
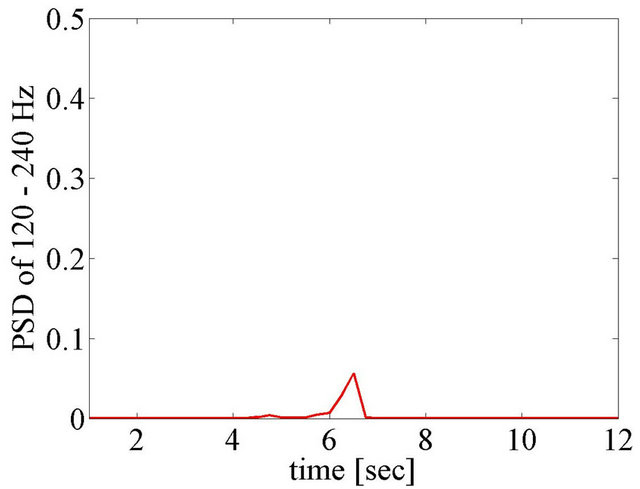
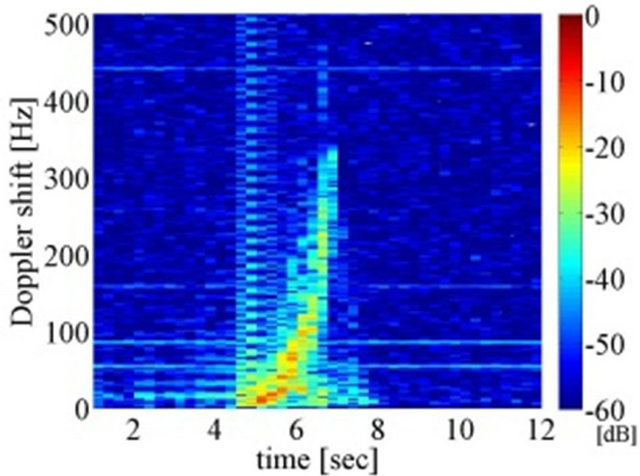
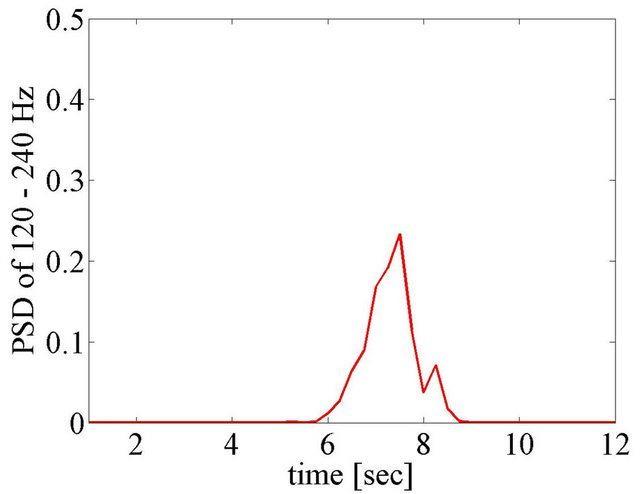
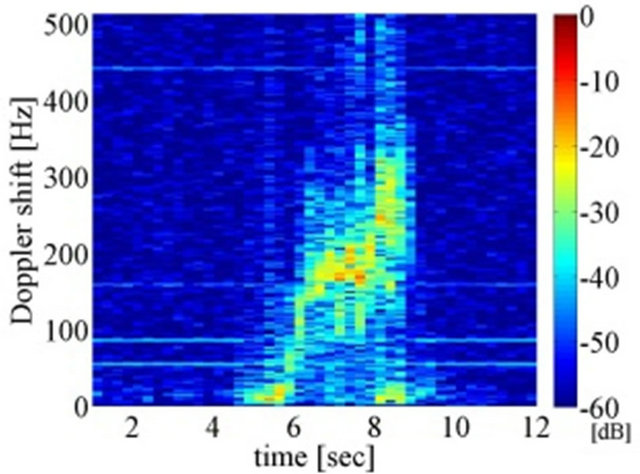
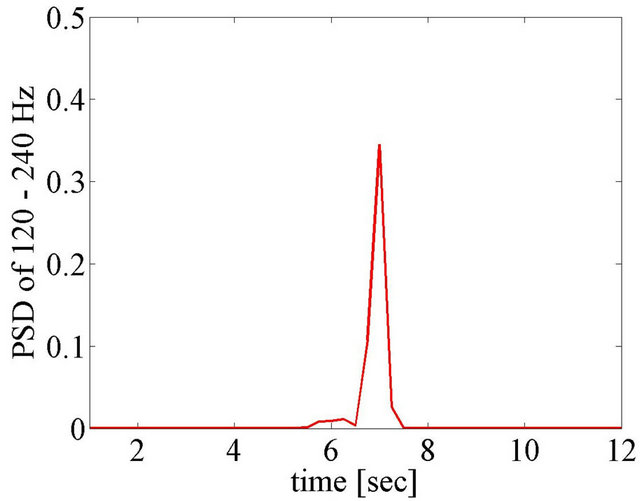
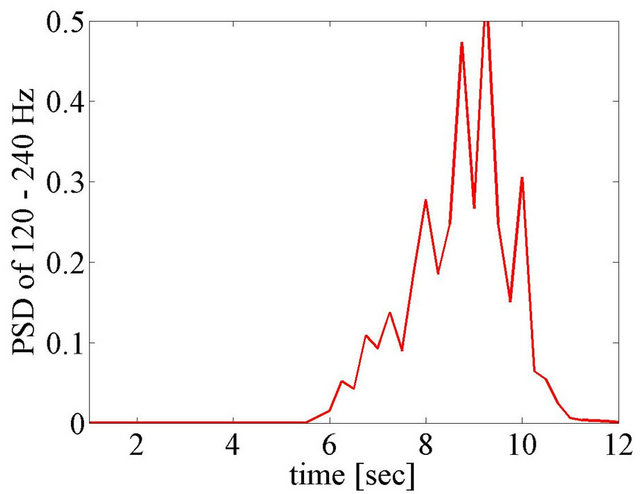
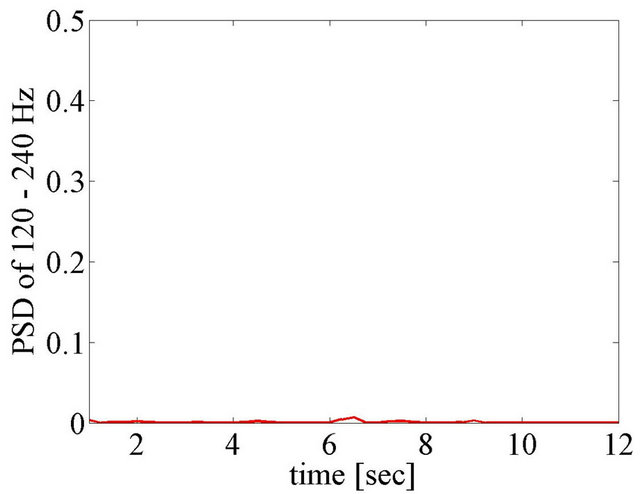
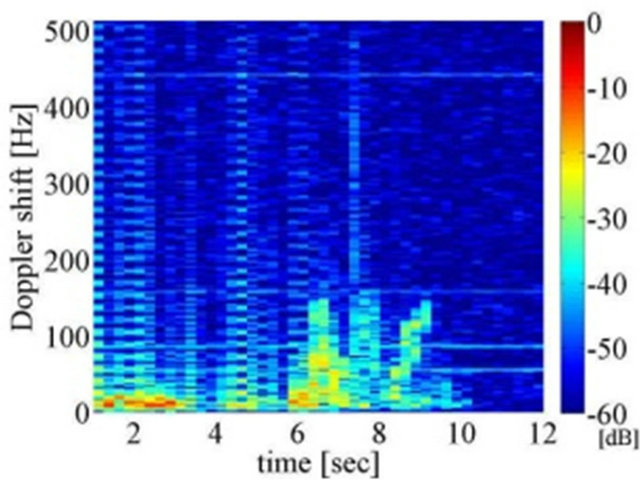
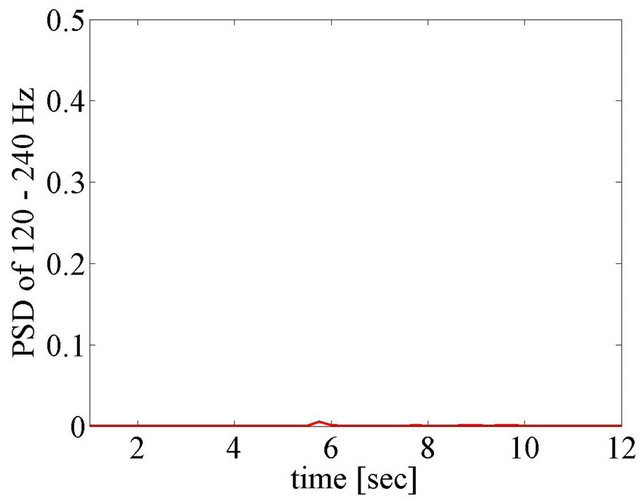
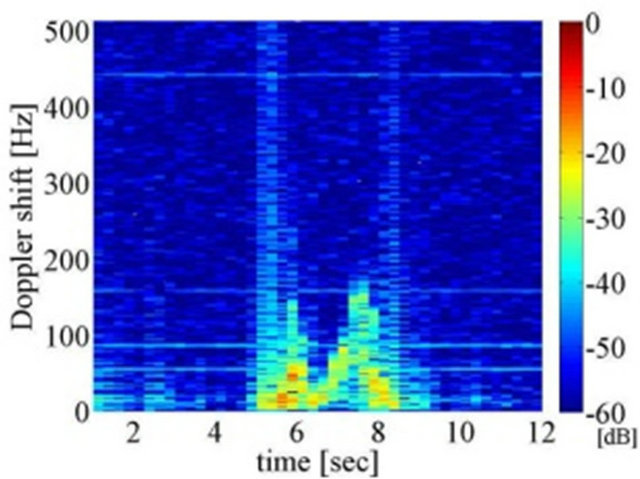
This process is aimed at deciding the timing for extracting 4 second features from the voltage data of the sensors. Firstly, we compute spectrogram by using short time Fourier transform (STFT). It is reported that 25 - 50 Hz bandwidth features are suitable to distinguish falling and non-falling when the carrier frequency is 5 GHz [9]. As shown in Equation (2), Doppler shift is proportional to carrier frequency on the condition of the same target velocity. Our experiment uses 24 GHz carrier frequency so that bandwidth should be expanded by 4.8 times, i.e. to within 120 - 240 Hz. On each time bin, which is decided by discrete Fourier transform (DFT) points and window overlap, we calculate the power spectral density (PSD) of 120 - 240 Hz. tmax, the time that the PSD of 120 - 240 Hz becomes maximum in 12 second experiment duration, indicates the time that remarkable event happens. Remarkable events mean activities involving a sudden quick movement using whole body. We specify the 4 second voltage data centered at tmax, and then extract features. Figures 2 and 3 show STFT spectrogram and PSD of 120 - 240 Hz of experienced activities, respectively. Subjects act at about time 7 second.
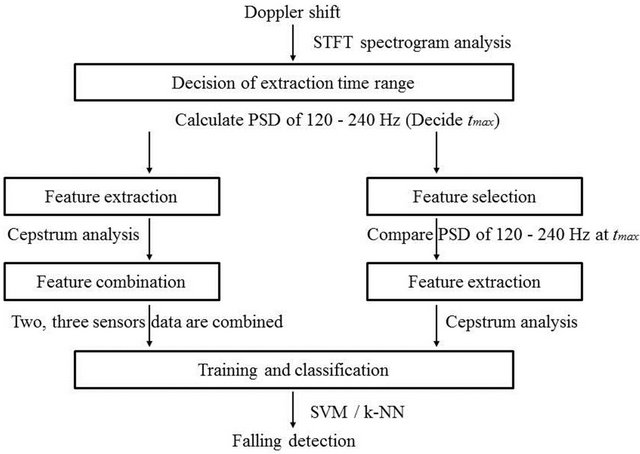
Figure 1. The proposed falling detection.
(a) Standing - Falling
(b) Walking - Falling

(c) Standing up - Falling
Figure 2. Spectrogram (left) and PSD of 120 Hz - 240 Hz (right) of Falling.
3.2. Feature Extraction
Using the 4 second voltage data centered at tmax, we compute cepstral coefficients. Mel-frequency cepstral coefficients (MFCC) are applied in [9]. Mel-frequency is the scale definition that emphasizes lower frequency 0 - 1000 Hz and compresses higher frequency. MFCC is basically applied to the analysis of voice up to about 16 kHz. On sensing falling motion, we found empirically that up to 500 Hz is enough to observe human activities on condition of 24 GHz carrier frequency. To compute MFCC, 0 - 1000 Hz frequency band is divided into linearly spaced blocks, which are called filter banks. Sampling frequency is 1024 Hz so that there is almost no process to compress higher frequency. Strictly speaking, instead of MFCC, cepstral coefficients analysis is applied. To calculate cepstral coefficients, we use the Auditory Toolbox [10]. The method is as follows.
1) Divide amplitude spectrogram into 13 linearly spaced filter banks.
2) Compute fast Fourier transform (FFT) of amplitude spectrum of each filter bank.
3) Compute discrete cosine transform (DCT) of the obtained data above. The result is called cepstrum.
4) We use C1-C6 coefficients, where C0 is directcurrent component. C7-C12 come from latter half of 0 - 1024 Hz, which is not focused on to observe human activity.
Cepstral coefficient features are computed for each set of 256 DFT points which is called window. The window update frequency is defined as frame rate. As the frame rate becomes higher, the number of features increases.
3.3. Feature Combination/Selection
In our proposal, at most three sensors are used. We employ two methods to make features using multiple Doppler sensors, a combination method and a selection method. In the combination method, cepstral coefficients of the sensors are simply associated. Figure 4(a) shows the example of feature structure using two sensors. “label” represents the type of activity. In the selection method, the PSD of 120 - 240 Hz at tmax are compared among sensors before computing cepstral coefficients.

(a) Walking
(b) Standing – Lying down

(c) Picking up

(d) Sitting on a chair
Figure 3. Spectrogram (left) and PSD of 120 Hz - 240 Hz (right) of Falling.
The sensor that has the largest PSD of 120 - 240 Hz at tmax is selected for feature extraction. The selected sensor is assumed to catch human motion better than the other sensors.
3.4. Training and Classification
To train and classify the features, we use SVM and k-NN. For classification by using SVM on MATLAB, LIBSVM [11] is available. SVM has a kernel function that decides boundaries of groups. As a kernel function, linear, polynomial, radial basis function (RBF), and sigmoid are able to be used on LIBSVM. We exploit the RBF kernel. A linear kernel is the special case of RBF [12], and sigmoid kernel behaves like RBF with some parameters [13]. Polynomial kernel has numerical difficulty [14] so that RBF is the most suitable kernel in general. Kernel has several parameters and they should be tuned by changing each parameter. When we classify by using k-NN, Euclidean distance between the features is used.
We use four persons (A, B, C, D), who are men from 20’s to 30’s, as training and test subjects as shown in Table 1, and apply cross validation. This process generalizes the results of SVM and k-NN. In addition, features are normalized to prevent the greater values from having stronger effect on the results than the others.
4. Performance Evaluation
Figure 5 shows contents of the multiple Doppler sensors. They include client units, a base unit, and a PC. Client units receive reflected microwave at Doppler module and CPU (MSP430F2618, Texas Instruments) outputs data to base unit. The connection between base unit and each client unit is connected by LAN cable. The collected data of each Doppler sensor are sent to PC through USB port. The data are processed MATLAB.