Groundwater Vulnerability Assessment and Validation for a Fast Growing City in Africa: A Case Study of Lagos, Nigeria ()
1. Introduction
In developing countries in Africa, Asia and South America for an estimated 1300 million urban dwellers the main source of drinking water is groundwater. This groundwater may be contaminated by infiltrated wastewater, because very often a sewer system is not present and households dispose of their solid and liquid waste on-site [1]. For instance, in Africa around 80% of the population in the largest cities (in Asia: around 55%) have on-site sanitation, such as septic tanks, pour-flush, VIP latrines or simple pits [2]. Lagos city (Figure 1), the commercial nerve center of Nigeria also has threats to its ground water from open waste dumps, petroleum product underground infrastructure, a massive un-engineered landfill site (Olusosun landfill) and large surface water bodies (Lagos lagoon and the Atlantic Ocean).
Groundwater vulnerability procedures can be classified into three categories: 1) overlay and index method; 2) process based methods that apply deterministic models based on physical processes; and 3) statistical models. These methods are typically intended to provide a comparative evaluation of areas related to the potential for groundwater contamination [3]. The overlay and index methods result from the intersection of maps on a regional basis and the qualitative interpretation of the data by indexing the parameters and assigning appropriate weights. The maps have both physical and climatic attributes that are assigned numerical indices for each attribute.

Figure 1. Map of Nigeria showing Lagos, the case study site.
The DRASTIC system [4], which falls under the index category, is the best known of these methods. It was developed in the United States with the support of the US. Environmental Protection Agency (EPA) and was designed to be a standardized system for evaluating the groundwater vulnerability for a variety of land areas. It was not intended to produce an absolute measure of vulnerability, but can be one of many criteria used in decision making. Parallel with the development of DRASTIC, the GOD method [5] was developed in Europe, which consists of three parameters: Groundwater occurrence, Overall aquifer class and Depth to water table. The Aquifer Vulnerability Index (AVI) method [6] developed in Canada, considers depth and hydraulic conductivity of each sedimentary layer above the ground-water level and the vertical hydraulic gradient. The UK vulnerability system [7] identifies three important components of groundwater vulnerability: soil type, the presence/absence of drift and the nature of the aquifer. All these methods can be carried out within a GIS-based framework where they have been mainly used to delineate the areas that are more vulnerable to pollution than others or to select the most favorable areas for sitting well fields and/or hazardous land use activities. The DRASTIC method has received much criticism due to lack of proper validation. For example, a positive correlation between the model results and field data was reported by [8,9], while others have reported little correlation [10,11]. Despite these concerns DRASTIC has been applied worldwide with adaptations on the procedures to elaborate thematic maps and the use of different ratings criteria [12-15]. There are also some methodologies that integrate various elements of the index methods with other information, such as contaminant loading and land use/land cover (LULC) to estimate the expected risk to groundwater contamination on a regional scale [16-18]. Lagos in southwestern Nigeria is a port city. It is the world’s sixth largest city and the most populous city in Africa. The United Nations puts its population at over 18 million with a density of 5032 persons per km2, and it is projected to reach 20 million by 2010 and 24.6 million by year 2015 to rank as the third most populous megacity in the world [19,20]. It has the fastest-growing urban population in the world at 6 to 8 per cent annually, ten times faster than New York and Los Angeles. Lagos State is highly urbanised, capturing 37 to 41 percent of Nigeria’s urban population. Lagos State only occupies 0.4 percent of the country’s land area and gains extra 300,000 inhabitants every year on top of its natural growth rate. It is the economic nucleus of the country, reputed to account for about 57 percent of total value added in manufacturing and about 40 percent of the nation’s most highly skilled manpower [21]. Metropolitan Lagos situated on the narrow lowland coastal stretch bordering the Atlantic Ocean and originally covered with mangrove swamps has experienced significant land cover changes due to past and present reclamation activities to secure more and more land for urban development. Land reclamation achieved through filling up of swamps and floodplains, and destruction of mangroves and wetlands have generally reduced the flood storage capacity of the urban land. Rapid and largely unplanned urban growth has resulted in land use changes and subsequent changes in the hydrological fluxes in the urban watershed thereby increasing flood hazard and risk in many parts of the metropolis and this can create unforeseen trends in the depth to groundwater table pattern for the different parts of Lagos [22]. This paper presents a method to assess groundwater vulnerability to pollution and risk mapping with limited data based on the integration of a GIS-based DRASTIC method with groundwater quality data and the proximity analysis of groundwater pollution aggravating land cover features for Lagos, Nigeria.
2. Materials and Methods
2.1. Description of Study Area
Situated in the south western corner of the country, Lagos state spans the Guinea coast of the Atlantic Ocean for over 180 km, from the Republic of Benin on the west to its boundary with Ogun state in the east. It extends approximately from latitude 6˚23' North to 6˚41' North, and from longitude 2˚42' East to 3˚42' East. It has a total area of 3577sq. km, about 787sq. km or 22% is water. Seven (7) local government areas that cut across the landscape of Lagos state from the shoreline to the inland boundary were used for this study based on available data. The Areas are as shown on the map of Lagos State below in Figure 2. They are;
• Area 1: Eti-Osa LGA (Victoria Island, Ikoyi and Lekki);
• Area 2: Apapa LGA (Apapa);
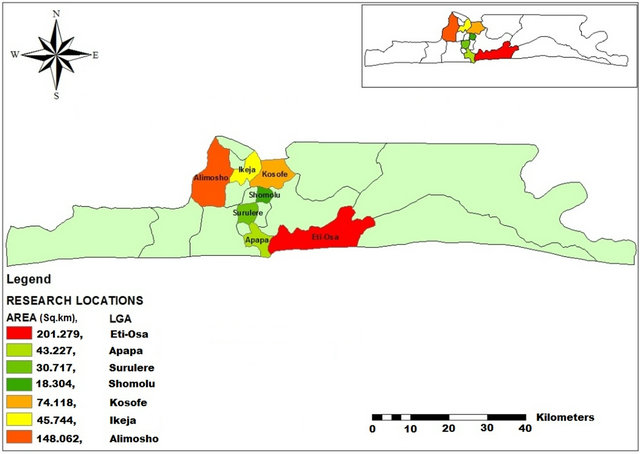
Figure 2. Map of Lagos State showing the study areas.
• Area 3: Surulere LGA (Surulere and Cele);
• Area 4: Shomolu LGA (Gbagada);
• Area 5: Kosofe LGA (Isheri, Ogudu);
• Area 6: Ikeja LGA (Ogba);
• Area 7: Alimosho LGA (Ipaja, Gowon Estate).
2.2. Collation and Analysis of Existing Groundwater Supply Borehole Exploitation Logs and Soil Survey Reports
The data used for this project was retrieved from multiple sources. A total of eighteen borehole log were collected from Trevi Foundations Nigeria limited, T.A.E Engineering limited and the Lagos Water Corporation (LWC). The depth to water table, and soil type for the different layers were extracted from the borehole logs. Information on geology, topography and soil features of Lagos state was obtained from the reconnaissance soil survey of Nigeria [23]. Representative values of saturated hydraulic conductivity for the different areas were estimated based the soil textures in the borehole logs. The climatic data was obtained from [24]. All the data were stored, integrated, manipulated, analyzed, and visualized using ArcGIS version 9.3 software and its extensions, namely, 3D Analyst, Spatial Analyst, and Geostatistical Analyst [25].
2.3. Vulnerability/GIS Studies
The Point Count System Model (PCSM) [26] a parametric method for groundwater vulnerability assessment was used to assess the sensitivity of the groundwater system to human and natural impacts. The procedure begins with a selection of parameters judged to be representative for vulnerability assessment. A multiplier (importance weight) was assigned to each parameter to reflect the relationship among the parameters and their importance for vulnerability/impact assessment. Each of the selected parameters has a given range, which is subdivided into discrete hierarchical intervals. Each interval was assigned a value reflecting the relative degree of vulnerability, and the rating points were summed. The final numerical score was divided into segments (mapping) expressing a relative vulnerability degree. The Geographic Information System (GIS) ESRI, ArcGIS 9.3 was combined with the DRASTIC model a point count system model, to produce intrinsic vulnerability maps for the area of case study. DRASTIC is a groundwater quality model for evaluating the pollution potential of large areas using the hydrogeologic settings of the region. A hydrogeologic setting is defined as a mappable unit with common hydro-geologic characteristics. This model employs a numerical ranking system that assigns relative weights to various parameters that help in evaluation of relative groundwater vulnerability to contamination. The hydrogeologic settings, which make up the acronym DRASTIC are: [D] Depth to water table: [R] Recharge (Net): [A] Aquifer Media: [S] Soil Media: [T] Topography (Slope): [I] Impact of Vadose Zone: [C] Conductivity (Hydraulic).
DRASTIC evaluates contamination potential based on the above seven hydrogeologic settings. Each factor is assigned a weight based on its relative significance in affecting the pollution potential. Each factor is further assigned a rating for different ranges of values. The typical ratings range from 1 - 10 and weights are from 1 - 5. The summary is shown in Table 1.
2.4. Groundwater Quality Data and Estimation of Pollution Aggravating Land Cover Feature Proximity
A total of 40 well water samples from ten different communities of Lagos metropolis (i.e. coastal area (16), intermediate area (8) and interland (16) were collected and analysed by [28]. The generated data were subjected to basic statistical analysis and the mean value for each area recorded. Groundwater quality data compiled from literature [28,29] for the seven study locations (local government areas) are summarized in Table 2. The examined parameters are; Temperature, pH, electrical conductivity (EC), Total dissolved solids (TDS), Chloride (Cl−), and Nitrate ( ).
).
The DRASTIC Index, a measure of contamination potential is computed by summation of the products of ratings and weights for each factor as follows: DRASTIC Index = DrDw + RrRw + ArAw + SrSw + TrTw + IrIw + CrCw where Dr = Ratings to the depth to water table Dw = Weights assigned to the depth to water table Rr = Ratings for ranges of aquifer recharge Rw = Weights for the aquifer recharge Ar = Ratings assigned to aquifer media Aw = Weights assigned to aquifer media Sr = Ratings for the soil media Sw = Weights for soil media Tr = Ratings for topography (slope)
Tw = Weights for topography Ir = Ratings assigned to vadose zone Iw = Weights assigned to vadose zone Cr = Ratings for rates of hydraulic conductivities Cw = Weights given to hydraulic conductivity The higher the DRASTIC index is, the greater the relative contamination potential is. The DRASTIC index can be further divided into four categories: low, moderate, high, and very high.
Figure 3 shows the location of the Atlantic Ocean [AO], Lagos Lagoon [LL], and Olusosun Landfill [OL]),