Augmented Lung Cancer Prediction: Leveraging Convolutional Neural Networks and Grey Wolf Optimization Algorithm ()

1. Introduction
Cancer is a non-communicable disease with over 100 different types, including breast cancer, skin cancer, pancreatic cancer, lung cancer, colon cancer, and prostate cancer that progresses with uncontrolled cell growth in the body [1] . The cancerous cell forms a tumor that impairs the immune system and causes other biological changes to malfunction. According to the World Health Organization (WHO), statistics [2] pointed out that cancer is the leading cause of death worldwide, accounting for nearly 10 million people in 2020, and the most common cancers are breast, lung, colon, and prostate cancer [3] . The most common causes of cancer deaths in 2020 were lung cancer, with 1.80 million deaths; colon and rectum recorded 916 million deaths, while the least was breast cancer, with 685 million deaths [4] . The mortality rate of lung cancer is even higher than breast cancer and colon cancer combined [5] . This deadly disease occurs because of the uncontrolled growth of malignant cells within one or both lungs. The increasing rates and vicious nature of lung cancer the world over put pressure on healthy society to find better, faster, and more accurate methods for the early diagnosis of this type of disease. Early detection and diagnosis can improve the survival rate.
Many screening procedures are suggested to find the presence of the condition under different stages. With lung cancer being a leading cause of cancer-related deaths with minimum survival rates, early detection of lung cancer is a question mark to researchers. In spite of continuous efforts devoted towards cancer drug development, there is little effectiveness of these chemotherapies, mainly due to cancers’ heterogeneous causes. Their work [6] pointed out that conventional supervised machine learning algorithms such as Decision trees (DT), K-Nearest Neighbor (KNN), Naïve Bayes (NB), Support Vector Machine (SVM), Convolutional Neural Networks (CNN), Random Forest (RF) and Genetic Algorithms (GA) have been applied to predict the survivability of cancer patients with high accuracy. However, conventional machine learning algorithms are unable to handle high-dimensional datasets due to their inability to employ diverse sources of data for predictions [7] . As [8] [9] and [10] discuss, the usage of conventional feature selection and dimensionality reduction techniques such as Principal Component analysis (PCA), Particle Swarm Optimization (PSO), Ant Colony Optimization (ACO), and Grey wolf optimization (GWO) have failed to enhance the accurate performance of cancer diagnosis including incorrect identification, low prediction accuracies and not reducing the false negative rates. Their work [11] further explains that due to the sensitivity of cancer data, most of the current machine-learning algorithms exhibit very low accuracies in their predictions. Computer Aided Diagnosis (CAD) systems have been used at healthcare centers to diagnose lung cancer during its early stage of growth; this has not been achieved as the accuracy of cancer detection is difficult to achieve, mainly because of the over-fitting of lung cancer features and the dimensionality of the feature set [12] .
In this study, a CNN-GWOA is proposed to address dismal performance to reduce false negative rates, ultimately reducing error rates in diagnosing the lung cancer disease and boosting overall prediction rate while minimizing over-fitting of lung cancer features. The proposed CNN-GWOA is important because the selection of the best (alpha) hyper-parameters was made so that only the best was used in the model’s training. By this approach, selecting the best hyper-parameters improved the prediction rate of diagnosis of lung cancer disease and reduced the misdiagnosis rate.
Therefore, this research purposes to provide the following contributions:
1) Investigating the efficacy of utilizing a Convolutional Neural Network (CNN) coupled with the Grey Wolf Optimization Algorithm (GWOA) for the development of a robust lung cancer diagnosis algorithm, aimed at enhancing the accuracy and reliability of lung tumor classification.
2) Assessing the effectiveness of the Grey Wolf Optimization Algorithm (GWOA) for optimal feature selection in the context of lung cancer diagnosis, with the objective of identifying the most relevant features and optimizing hyper-parameters to improve the performance of the diagnostic model.
3) Comparatively analyzing the performance of the developed CNN-GWOA model against baseline classifiers such as Random Forest (RF) and Decision Trees (DT) in terms of accuracy, F1 score, precision, recall, True Positive Rate (TPR), and False Negative Rate (FNR), to demonstrate its superiority and potential practical implications in clinical settings.
2. Related Work
2.1. Applicability of Conventional Supervised Machine Learning Algorithms for Lung Cancer Diagnosis
Machine learning algorithms play an increasingly important role in cancer diagnosis, and the accurate prediction of machine learning methods for cancer has become one of the most urgent and challenging tasks for researchers [13] . This section highlights studies where supervised machine learning algorithms have been applied for various cancer prediction diseases such as breast, colon, cervical, ovarian, and lung cancer. Scientists use several methods to determine different kinds of cancer present with symptoms, such as early-phase screening (EPS) [14] . In addition, they have developed unique approaches for the early identification of the prognosis in cancer treatment, such as Computed Tomography (CT) images, Magnetic Resonance Image (MRI), Positron Emission Tomography (PET), and Fluoro-deoxy-glucose (18F FDG) [15] [16] .
Because of the invention of new technologies in medicine, vast volumes of cancer data have been collected and available for bioinformatics and the scientific community for evaluation and testing. However, the diagnosis of lung cancer disease is among the most fascinating and demanding challenges in healthcare, including incorrect classification and low prediction accuracy [17] .
A model for predicting breast cancer using various machine-learning classification algorithms like KNN, SVM, and Gaussian NB was created [18] . Using the UCI machine learning repository Wisconsin breast cancer dataset, the algorithms achieved better performance after parameter selection and feature selection with an accuracy value of KNN = 0.99, SVM = 0.96, NB = 0.95, precision values of KNN = 0.98, SVM = 0.95, NB = 0.94, similarly recall values of KNN = 0.99, 0.97, and 0.96 [19] . Therefore feature selection and parameter optimization were the effective ways to improve the results of SVM [20] .
Several studies have used decision trees to solve biological problems, including identifying cancer tissue origin using microRNAs, identifying biomarkers in cancer, and defining prognostic biomarkers for lung cancer using nuclear receptor expression [21] . In [22] , they developed a lung cancer prediction algorithm using ANN and DT, whereby they analyzed habits like alcohol consumption, age, and smoking to detect lung cancer. Experimental results revealed promising prediction results with an accuracy of 95%, precision of 0.95%, recall of 0.94, f1-score of 0.94 and MSE of 0.05.
In their work [23] , they developed an ensemble classifier based on traditional KNN and individual decision models related to KNN that were applicable to problems characterized by noisy, imbalanced datasets without increasing classification time. However, the traditional KNN lacked the scalability to manage very large datasets. In addition, the need to identify the k-neighborhood proved hard with an imbalanced dataset [24] . Another study [25] used the Ensemble Adaboost algorithm to predict different lung cancer types. Ensemble learners were trained using features extracted from the lung CT images and evaluations done using performance metrics. The Accuracy of Adaboost was 90.74%, with a sensitivity of 81.80%, specificity of 93.99%, F1 score of 0.8, kappa of 0.753, and AUC of 0.93. The performance of the AdaBoost classifier was then compared with the different machine-learning algorithms [26] .
The CNNs have emerged as a powerful alternative solution for nodule classification tasks. They use an end-to-end training scheme, i.e., the entire image or image patch is fed into a network while getting a classification label as output. CNNs automatically learn to extract useful image features by adjusting the weights of their convolutional kernels and therefore eliminate the need for human-dictated feature engineering [27] . The fact that CNNs adaptively learn the optimal representations in an entirely driven scheme by capturing the spatial dependency in images through applying relevant features helps them outperform classical CAD systems [28] . In lung cancer prediction, 3D CNN is utilized to classify the lung nodules, which can be benign or cancerous. In their work [29] developed a weakly supervised learning model using CNN based on EfficientNet-B3 architecture to predict lung carcinoma using a training dataset of 3554 Whole Slide Images (WSIs). Results obtained differentiated between lung carcinoma and non-neoplastic with high Receiver Operating Curve (ROC), Area under Curves (AUCs) on four tests showed a performance of 0.975, 0.974, 0.988, and 0.981, respectively [30] . A machine learning classifier was developed to classify available lung cancer data in the UCI machine learning repository. The KNN, Naive Bayes (NB), and Radial Basis Function (RBF) network algorithms were used to classify data as either cancerous or non-cancerous. The comparison of results revealed that the proposed RBF classifier had resulted with a great accuracy of 81.25% and was thus considered as an effective classifier technique for Lung cancer data prediction [31] [32] . Another study [33] developed a computer-aided diagnosis (CAD) system supported by artificial intelligence (AI) learning models for effective disease diagnosis. The DT, Support Vector Machine (SVM), Linear Discriminant Analysis (LDA) and Multi-perceptron Neural Networks (MLP-NN) were employed to train and validate the optimal features reduced by the proposed system. By using the 10-fold cross-validation, the performance of the model was evaluated using accuracy, f1 score, precision, and recall. The study outcome attained 99.62%, 96.88%, and 98.21% accuracy on breast, cervical, and lung cancer, respectively [34] . In [35] [36] , they used a CNN-supervised machine learning algorithm for the classification and detection of different types of cancer from both MRI and RBG (Red, Green, Blue) images. The CNN classified cancer types and semantic segmentation to segment cancer cells. The research was examined on the MATLAB platform on MRI and RGB images of infected cells for breast, leukemia, lung, and colon cancer. The experimental results achieved detection of cancer cells from various cancer databases that represented an average accuracy rate of 93%. In addition, [35] [36] used a hybrid Tabu Search (TS) with Stochastic Diffusion Search (SDS) based feature selection that was employed using NB, DT, and Neural Networks (NN) classifiers to improve classification of cancer disease. The results achieved demonstrated an accuracy of 94.07%.
In their work [37] , proposed a novel lung cancer detection technique using machine learning algorithms. The techniques comprised feature extraction, fusing using patch base, and discrete cosine transform. They applied ML techniques such as SVM and KNN. The proposed algorithms achieved a performance of 93% accuracy for KNN and 91% accuracy for SVM, respectively. In terms of average specificity, sensitivity, and accuracy, 95%, 86%, and 93% in SVM were achieved. Whereas for KNN, 93%, 82%, and 91% of specificity, sensitivity, and accuracy, respectively. The performance results show that the proposed technique attained better performance in the chest CT scan image dataset [38] . In another study, radiomics approach to predicting non-small cell lung cancer (NSCLS) tumor histology from non-invasive computed tomography data was proposed [39] . Training and validation were done on a dataset containing 311 early-stage NSCL patients using CNN with a focus on adenocarcinoma (ADC) and squamous cell carcinoma (SCC). The CNNs were able to predict tumor histology with an AUC of 0.71. Using kNN and SVM on CNN-derived quantitative radiomics features yielded a performance with AUC of up to 0.71 [40] .
2.2. Challenges of Conventional Supervised Machine Learning Algorithms for Cancer Diagnosis
The variability in data capture across healthcare systems leads to significant challenges in creating cohesive datasets for analysis. Furthermore, machine learning integration into clinical workflows presents its own set of challenges [41] . Although this review focuses on the technical challenges of ML, it should be noted that clinical decision support tools have implications on the treatment and subsequent outcomes of the patients and thus must be handled with great care. Machine learning models must gain the trust of clinicians through interpretability, collaboration between researchers and medical experts, and prospective validation in clinical settings [42] . Some of the challenges of machine learning algorithms for lung cancer prediction are that data annotation is not done accurately [43] . Though there is this huge presence of data, annotated examples or the output label for predictions are not present. Since some of the best machine learning algorithms would work well under supervision when there is an output class label, there is a need to provide data that is annotated [44] . Another issue is the need for hyper-parameter tuning as there are a lot of complex ML models being developed, with some of them being random forests, decision trees, and neural networks that face setbacks of not being able to tune the hyper-parameters so that they result in very good performance on the test data [45] [46] .
The modeling power and complexity of neural networks come at the expense of interpretability, where the neural networks are coined as black box methods as a result of the difficulty in extracting insights [47] . Rustam et al. discussed that lung cancer detection, in general, is carried out using radiological imaging techniques through image testing [48] . However, these techniques still result in low survival rates because the malignant cells are detected in late stages of lung cancer. They used SVM and SVM-RFE for feature selection for lung cancer detection.
Tang et al. discussed that the major challenge in machine learning and data mining areas is to build accurate and computationally efficient classifiers for medical applications and tumor immunotherapy [49] . The limitations experienced for KNN were that the KNN algorithm is slow since it reviews all the instances each time, it is vulnerable to dimensionality, sensitive to irrelevant and correlated attributes, and that a wrong choice of the distance or the value of k degrades the performance [50] .
Jayaraj et al. [51] developed a random forest (RF) for lung cancer prediction. The classification of images was carried out using a random forest classifier, which provided an output that classified images into normal and abnormal. However, there still exists problem with Missing data imputation, hard to build accurate and efficient classifiers for medical applications.
Eali et al. [52] , found out that the classification of benign and malignant tumors was not predicted accurately. In medical informatics, a small minute error can result in erroneous results. Algorithms like SVM, DT, KNN, and NB still face problems like over-fitting, computationally expensive as they require more time to train the model, high dimensionality feature space, noise, and irrelevant results in degradation of accuracy [53] .
It is demonstrated that supervised machine learning algorithms still face challenges in cancer prediction, such as high computational complexity, prone to over-fitting, building accuracy and computationally efficient classifiers, computationally expensive, missing data imputation, high dimensionality feature space, high error rates due to non-reduction of false negative rates, low prediction accuracies and it’s sensitive to irrelevant correlated attributes. In view of this, proper classifiers with improved algorithm techniques should be employed for better accuracy.
2.3. Theoretical Description of Classifiers
In this section, we used Convolutional Neural Networks (CNN), Decision tree classifier (DT), and Random forest classifier (RF). Grey wolf optimization was used as a hyper-parameter optimization algorithm to select the best hyper-parameters to increase accuracy of diagnosis of lung cancer.
2.3.1. Convolutional Neural Networks (CNN)
The CNN comprises two primary stages. First stage is feature extraction, where in, the network does continuous convolution and pooling operations in order to detect the features in the image and utilizes the fully connected layer to classify the extracted features. Second stage is classification. The layers in the CNN are arranged in three dimensions separating the neurons from one layer to the next. The output is usually reduced to single vectors based on the probability scores. The CNN does the convolution employing a filter or kernel by scanning images from top to bottom; the process continues transforming the width of the screen until the entire image is scanned. The filter or kernel multiplies its own values with overlapping values and adds them to the output single values for each overlap until the whole message is passed through.
2.3.2. Random Forest
Random forests are known for their high performance and generalizability. RF model is applied to resolve the classification as well as regression problems. In order to perform the classification, an RF model can be used where the dependent variable is categorical. Based on the rules, the data is divided by the tree. The dataset can be split into many regions by using these rules. The variable’s influence on the homogeneity or cleanliness of the subsequent child nodes (X2, X1) can be used to compute these rules. The variable x1 becomes a root node because it leads to the maximum homogeneity in child nodes. In this study, RF is applied as a classifier model where the dependent variable is categorical.
・ When a data frame of (n X P a tree splits the data depending upon the rules. These rules partition the dataset into a number of different and non-overlapping regions.
・ These rules are computed using a variable’s influence on the homogeneity or cleanliness of the subsequent child nodes (X2, X3).
・ The variable X1 leads to maximum homogeneity in child nodes. Therefore, it becomes a root node. The variable at the root node is considered an essential variable in the dataset.
RF model has some other features that help in the classification process. The classification process under RF depends on the following ways: In the classifier tree, the partitioning decision is mainly depending on the following ways:
・ Gini Index: It is used to compute the trueness of a node. When the Gini index indicates a lower value, it recommends that the node is actual. The Gini index for a child node is lesser than the parent node when carrying out the splitting process.
・ Entropy: It is used to compute the impurity of a node. In the case of a binary class (a, b), the entropy will be calculated as follows. The entropy value will be highest at the value of p is 0.5. At the same time, the entropy value will be lowest at the probability value of 0 or 1.
(1)
In this study, the Gini index was used for parameter setting. Random Forests allow us to look at feature importance, which is how much the Gini Index for a feature decreases at each split. The more the Gini Index decreases for a feature, the more important it is.
Gini Index calculates the amount of probability of a specific feature that is classified incorrectly when selected randomly. If all the elements are linked with a single class, then it can be called pure. The Gini index is determined by deducting the sum of squared probabilities of each class from one, mathematically Gini Index is expressed as:
(2)
where Pi denotes the probability of an element being classified for a distinct class. The classification and regression tree (CART) algorithm deploys the method of the Gini Index to originate binary splits.
2.3.3. Decision Tree
Decision trees use supervised learning techniques to build a model, which is a set of nodes arranged in a hierarchical fashion. It is a tree-based technique in which any path beginning from the root is described by a data-separating sequence until a Boolean outcome at the leaf node is achieved. Decision trees consist of two parts: It is the hierarchical exemplification of knowledge relationships that contain nodes and connections. When relationships are used to classify, nodes represent purposes. Decision tree classifies cases into groups or predict values of a dependent (target) variable based on values of independent (predictor) variables. The procedure provides validation tools for exploratory and confirmatory classification analysis. DTs that are grown very deep often cause over-fitting of the training data, resulting in a high variation in classification outcome for a small change in the input data. They are very sensitive to their training data, which makes them error-prone to the test dataset.
When implementing the decision trees algorithm to detect lung cancer, the leaf nodes are divided into three categories: malignant and benign. Rules will be established among the chosen data set attributes in order to determine if the tumor is benign or malignant.
2.4. Evaluation Measures
The metrics used in this study include; Accuracy (ACC), Precision (PPV), F1 score and recall, False negative rate (FNR) and True Positive Rate (TPR). They are explained in Table 1.
2.5. Hyper-Parameter Feature Selection Using Grey Wolf Optimization Algorithm (GWOA)
In this step, the best hyper-parameters were obtained that produced the best performance based on the architecture used and the metrics that were being monitored.
![]()
Table 1. Performance metrics used in lung cancer diagnosis.
The GWOA relies on a clear definition of labor and cooperation to survive. They mimic the leadership hierarchy and hunting mechanism of grey wolves in nature. Due to the clear division of labor grey wolf population is divided into four levels. The leading grey wolf is called the alpha (α) wolf, the next level is called the beta (β) wolf, the third level is called the delta (δ) wolf and the lowest level is called the omega (ω) wolf.
The inspiration for using GWOA is the behavior of the grey wolf, which hunts large prey in packs and relies on cooperation among individual wolves. The main aspects of this behavior are social hierarchy and hunting mechanisms.
The alphas, betas, deltas, and omegas are classified as dominant hierarchies, whereby the wolves are ranked according to strength and power. The levels employed for simulating leadership are shown below:
1) The alpha male and females are at the top of the hierarchy, and they lead the pack. All members of the pack have ordered within a specific rank. The wolf’s hierarchical system is not just about dominance and aggression; it also assists vulnerable members of the pack who cannot hunt for themselves.
2) Afterward, the beta wolf supports the alpha wolf’s decisions and helps keep discipline within the pack.
3) The delta wolf is below the beta wolf in rank. They are often strong but lack leadership skills and confidence in themselves to take on leadership responsibilities.
4) The last one is the omega wolf which does not have any power at all, and other wolves will quickly chase him. Omega wolf is also responsible for watching over younger wolves.
The main phases of grey wolf hunting include tracking, chasing, and approaching the prey, pursuing, encircling, and harassing the prey until it stops moving, and finally attacking the prey.
3. Materials and Methods
3.1. Dataset
The Computed Tomography data images were collected from the Cancer Imaging Archive TCIA) public access kaggle dataset repository (TCIA). The dataset used for this study is specifically for non-small cell lung cancer (NSCLC), which contains 4, 946 samples of adenocarcinomas (ADCs), 4952 samples of benign, and 4842 samples of squamous cell carcinomas (SCCs) totaling to 14,740 sample image dataset. This data set is partitioned into 80% training data set and 20% testing data set, which translates to 11,793 training and 2947 for testing. The 10-fold cross-validation of the accuracy, precision, recall, and F1 score was performed (See Table 2).
3.2. Data Preprocessing
Procedure of the Proposed GWOA Algorithm
In this study, a method consisting of six phases was proposed for the diagnosis
![]()
Table 2. Summary of dataset used in this study.
of lung cancer using GWOA for hyper-parameter selection. The phase includes; dataset uploading, data preprocessing, data partitioning, feature selection, classification of data, cross-validation, and classifier evaluation. The proposed architecture is shown in Figure 1.
Lung CT image preprocessing was performed to improve their quality and to achieve better results in the diagnosis of the lung cancer nodule. The lung contains several structures that can be confused with nodules, and the importance of this step was to enhance the image. All dataset was converted from RGB to grayscale images, reduced to 224 × 224 pixels to make all images uniform and remove any distraction. Histogram equalization was used to improve contrast in images. This was done by effectively spreading out the most frequent intensity values and stretching out the intensity range of the image. All these were achieved using bin smoothing, which was applied to enhance the color of images and increase contrast so that features can easily be seen by the learner.
Binning is a technique for smoothing noisy values by consulting their neighborhood. This requires that the data be sorted in some order before it is partitioned into a specific number of bins. Thereafter, smoothing is accomplished by bin means, median, or bin boundary. Taking L as the lowest value of a certain feature, H as the highest value of a feature, then the width of intervals, Ɯ is given by (1):
Ɯ = (H − L)/ƕ (3)
where ƕ is the number of partitions.
3.3. Feature Selection
After normalization, feature selection was performed on both training and testing datasets for dimensionality reduction using the grey wolf optimization algorithm (GWOA).
3.3.1. Mathematical Model of Grey Wolf Optimization (GWOA)
The GWO is a population-based meta-heuristic swarm intelligence algorithm inspired by leadership behavior and unique mechanism of hunting of grey wolves (See Figure 2). It has the ability to avoid local optima stagnation and good convergence ability towards the optima. In general, GWO advances itself
![]()
Figure 1. Phases of lung cancer prediction architecture.
![]()
Figure 2. Flow chart of the Grey Wolf Optimization Algorithm (GWOA).
strongly to exploitation. Four types of grey wolves, such as alpha, beta, delta, and omega, are employed for simulating the leadership hierarchy. In the hierarchy of GWO, alpha (α) is considered the most dominating member of the group. The rest of the subordinates are beta (β) and delta (δ), which help to control the majority of wolves in the hierarchy that are considered as omega (ω). The omega wolves are the lowest ranking in the hierarchy.
The mathematical model of hunting mechanism of grey wolves implemented to perform optimization consists of the following:
1) Tracking, Chasing, and Approaching the Prey.
2) Pursuing, Encircling, and Harassing the prey.
3) Attacking the prey.
1) Encircling, pursuing, and harassing the prey. Grey wolves encircle and harass the prey during the hunting process. The mathematical model for encircling behavior is written as follows:
(4)
(5)
where t represents the current iteration.
and
are co-efficient vectors.
is the position vector of the prey, and
indicates the position vector of the grey wolf. The vectors
and
are calculated as follows:
,
where components of
are literally decreased from 2 to 0 over the course of iteration and
are random vectors in [0, 1].
2) Hunting, tracking, and approaching the prey. The grey wolves will naturally recognize the location of their prey and will then encircle their food. This is guided by the α, and β and δ, followed by the ω. Some of the prey’s locations searched by the wolves are not known by humans. Thus, to understand their behavior, a representation of a mathematical equation was made to mimic their behavior by assuming alpha (the best candidate solution), beta, and delta have a broader knowledge about their prey’s location. Therefore, the first three wolves were saved as the best candidates’ solution while the other wolves (Omega) updated their position according to the best search candidate. The following formulas are proposed in this regard:
(6)
(7)
(8)
(9)
(10)
(11)
(12)
3) Attacking the Prey (Exploitation). The grey wolves finish the hunt by attacking the prey when it stops moving. In order to mathematically model approaching the prey, we decrease the value of
. Note that the fluctuation range of
is also decreased by
. In other words,
is a random value in the interval [−2a, 2a] where a is decreased from 2 to 0 over the course of iterations. When random values of
are in [−1, 1], the next position of a search agent can be in any position between its current position and the position of the prey. The value |A| < 1 forces the wolves to attack the prey.
a) If |A| < 1, then attacking prey (exploitation).
b) If |A| > 1, then searching for prey (exploitation).
After the attack again, they search for the prey in the next iteration, wherein they again find the next best solution α among all the wolves. This process repeats until the termination criterion is fulfilled.
4) Search for Prey (Exploitation). Grey wolves mostly search according to the alpha, beta, and delta position. They diverge from each other to search for prey and converge to attack prey. In order to mathematically model divergence, we utilize
with random values greater than 1 or less than −1 to oblige the search agent to diverge from the prey. The |A| > 1 forces the grey wolves to diverge from the prey to hopefully find a fitter prey. Another component of GWO that favors exploration is
which contains random values in [0, 2]. This component provides random weights for prey to stochastically emphasize (C > 1) or deemphasize (C < 1) the effect of prey in defining the distance. Generally, the search process starts with creating a random population of grey wolves (candidate solutions) in the GWO algorithm. Throughout iterations, alpha, beta, and delta wolves estimate the probable position of the prey. Each candidate solution updates its distance from the prey. The parameter a is decreased from 2 and tends to 0 in order to emphasize exploration and exploitation, respectively. Candidate solutions diverge from the prey when
and converge towards the prey when
. Finally, the GWO algorithm is terminated by the satisfaction of an end criterion.
3.3.2. Pseudocode of the Proposed Grey Wolf Optimization Algorithm (GWOA)
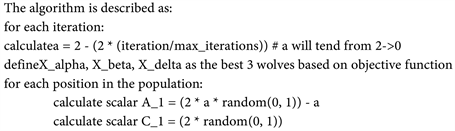
The results of the optimization above were the best parameters that were fed into the model. The selection of the best (alpha) hyper-parameters was done in such a way that only the best were used in the training of the model. By this approach, there is optimism that they generated the best performance since this has been compared by the GWO algorithm.
3.3.3. Convolutional Neural Networks (CNN) for Classification
The CNN was used for classification to classify which of the three classes of adenocarcinoma (ADC), small cell cancer (SCC), and benign cancerous image falls under. The following is a demonstration of how CNN was used for classification (See Figure 3).
3.4. Experimental Design
Upon Data preprocessing, the RF, CNN, and DT were applied to obtained data. To accomplish this, a computing environment with the following specifications
![]()
Figure 3. Classification using CNN classifier.
was employed: HP EliteBook core i5-4300UCPU @ 1.90 GHz 2.50 GHz, RAM 4.00 Gb, 64 bit OS, Python 3.8.5, spyder environment, and Anaconda IDE. The proposed lung cancer diagnosis algorithm was executed on the lung cancer dataset repository (Albertina et al., 2016), which consisted of 4946 samples of adenocarcinomas (ADCs), 4952 samples of benign and 4842 samples of squamous cell carcinomas (SCCs) totaling to 14,740 sample image dataset. This data set was partitioned into 80% training data set and 20% testing data set, translating to 11,793 training and 2947 for testing. Random forest, decision trees, and Convolutional Neural Networks (CNN) were used for experimentation. The performance of the lung cancer diagnosis algorithm was evaluated using the accuracy, precision, recall, F1-score, True positive rate (TPR) and false negative rate (FNR). A comparative study was employed whereby the experiments were carried out to reflect the performance of CNN, RF, and DT before GWOA and after GWOA. Similarly, there was a comparison to demonstrate the performance of CNN, RF, and DT before GWOA with cross-validation and performance after GWOA with cross-validation.
4. Results and Discussion
This section is divided into three parts: Study design, the performance of GWOA before and after optimization, results after GWO without cross-validation, and performance after GWOA with cross-validation. Finally, we show the difference in performance of all the parameters used.
4.1. Study Design
In this work, a comparative study was employed whereby the experiments were carried out to reflect performance without using the grey wolf optimization algorithm (GWOA) and when using GWOA. The main aim was to reduce as much as possible the false negative rate to be able to deal with incorrect classification of data, which leads to misdiagnosis.
Therefore a comparative study was employed whereby the experiments were carried out to reflect the performance of CNN, RF, and DT before GWOA and after GWOA. Another comparison was to demonstrate the performance of CNN, RF, and DT after GWOA with cross-validation.
4.2. Performance of Classifiers before GWOA and after GWOA
To determine the effects of feature selection and hyper-parameter optimization that were used in this study, evaluation metrics like accuracy, F1 score, precision, recall, TPR and FNR were computed before optimization and after optimization using Grey Wolf Optimization Algorithm (GWOA). Table 3 shows the performance of the classifiers before GWOA.
Figure 4 shows that before applying GWOA, the performance of CNN was generally good, followed by RF and DT. The accuracy was at 0.955975, F1 score at 0.954851, precision of 0.956991, recall of 0.954591, True positive rate (TPR) of
![]()
Table 3. Performance of CNN, DT and RF before GWOA.
![]()
Figure 4. Performance of CNN, DT, and RF before GWOA.
0.954591and finally, the false negative rate (FNR) of 0.045409 followed by RF and lastly DT, respectively, as shown in Table 1. The FNR values for RF were 0.137234 and DT at 0.288057, respectively. The FNR values for all classifiers went up to 0.28. Table 4 shows the performance of classifiers after the GWOA application.
As illustrated in Figure 5, the performance of CNN improved greatly compared to Figure 4, where the best results were at an average of 0.95 before GWOA. After GWOA in Figure 5, the performance significantly improved to an average of 0.97 after GWOA in terms of accuracy, F1 score, precision, recall, and TPR, followed by the random forest, whose average performance before GWOA and after GWOA was at an average of 0.86. The poorest performance was with Decision trees, whose average performance before GWOA and after GWOA was at 0.71. The false negative rate (FNR) reduced significantly after GWOA across with CNN FNR reducing from 0.045409 to 0.023676, DT from 0.288057 to 0.285266, and lastly, RF reducing from 0.137234 to 0.132411, respectively. Theoretically, low FNR means it was possible to diagnose lung cancer with minimal incorrect classification errors, implying a successful prediction of lung cancer disease.
In Table 5, there was a positive deviation across CNN in terms of accuracy, F1-score, precision, recall, and TPR. That was the best performance compared to
![]()
Table 4. Performance of CNN, DT, and RF after GWOA.
![]()
Table 5. Performance of CNN, DT, and RF before GWOA and after GWOA.
BO-Before Optimization; AO-After Optimization.
RF and DT. Similarly, there was reduced FNR for CNN compared to RF and DT. The good performance for CNN was because CNN are highly adaptable learning algorithms which are able to detect non-linear relationships between the features and sample classes. In addition, the CNN is fault-tolerant and easy to adapt. The improved performance in RF was because they do not over-fit, and also they are capable of handling missing values automatically. The decision tree had the poorest performance before and after GWOA for all the metrics applied. This is attributed to the fact that decision trees require more training time and are computationally expensive.
4.3. Performance of Classifiers after GWOA with Cross-Validation
After getting the results of the performance of CNN, RF, and DT classifiers after using GWOA, there was a need to validate the performance of the algorithms free from bias and over-fitting. The 10-fold cross-validation was used for this validation, and the results are shown in Table 6 and Figure 6.
![]()
Figure 5. Performance of CNN, DT, and RF after GWOA.
![]()
Figure 6. Performance of CNN, DT, and RF after GWOA with cross-validation.
![]()
Table 6. Performance of CNN, DT, and RF after GWOA with cross-validation.
From Figure 6 and Table 6 shown, the cross-validation is used to validate the results. Based on the values presented, the CNN achieved the best performance after GWOA with cross-validation compared to RF and DT. The performance of CNN was at an accuracy of 0.968553, an F1-score of 0.967910, a precision of 0.969108, and a recall value of 0.967893. This was a drop from the previous results before cross-validation, which was at an average of 0.97. The performance of RF reduced greatly after cross-validation from an average of 0.86 to an average of 0.79. The poorest performance was with DT at 0.71 with cross-validation and before cross-validation.
This means that at 96% performance for accuracy, F1-score, precision, and recall after cross-validation, the proposed CNN-GWOA was able to diagnose lung cancer with fewer misdiagnosis errors as cross-validation was able to flag over-fitting or selection bias. The results obtained are less biased.
5. Discussion
From Figure 5, it is evident that, generally, performance improved for CNN after deployment of the feature selection algorithm GWOA compared with Figure 4 before the application of GWOA. As shown in Table 5, the difference in performance after optimization for CNN indicated an increase of +0.020964 for accuracy, +0.021567 for F1 score, precision of +0.019642, recall value of +0.021733, TPR of 0.0220414 and a reduction in FNR of −0.021733 respectively. This was followed by the performance of RF and, lastly, the DT. After GWOA with cross-validation in Figure 6 and Table 6, CNN produced consistent and best results compared with other classifiers with an accuracy of 0.968553, F1-score of 0.967912, precision of 0.969108 and recall of 0.967893 and all of them recorded a positive deviation. This was followed by RF and, lastly, the DT.
From the experiments performed, it is clearly evident that the CNN classifier proved to be an ideal classifier for lung cancer diagnosis, while decision trees displayed the worst results throughout the training, testing, and cross-validation instances. Overall, the deployed GWOA demonstrated boosted the performance of lung cancer diagnosis. Therefore the CNN combined with GWOA is proposed for early lung cancer diagnosis.
The proposed lung cancer diagnosis algorithm was successful in determining whether the cancerous images were adenocarcinomas, benign, or squamous, effectively at 96% performance. Lung cancer diagnosis using the Grey wolf optimization algorithm (GWOA) with CNN has proven to improve the diagnosis accuracy, precision, recall, and F1 sore while improving the TPR and reducing the FNR to reduce the misclassification error, which has boosted the overall prediction rate while at the same time minimizing over-fitting of cancer features.
Since precision represents the ratio of rightly predicted positive observations to the entire population of predicted observations, the proposed algorithm of CNN-GWOA had a low false negative rate. As such, of all 14,740 datasets that were labeled as cancerous, 96% of them were infected by lung cancer. On the other hand, recall represents the ratio of rightly diagnosed positive observations to the entire population of the actual class. As such, of all the datasets infected with lung cancer, the proposed algorithm labeled 96% of them. With the recall value being more than 50%, the proposed diagnostic algorithm represents a good model. Moreover, the false negative rates represent the number of the incorrectly classified dataset. Since the FNR was significantly reduced to 0.023676, it means that misclassification error was considerably brought to a minimum. The true positive rate was 96%, meaning the rightly diagnosed dataset was correctly identified.
It is evident from the two comparative experiments carried out before GWOA and after GWOA with 10-fold cross-validation that CNN with GWOA has proved to be the best algorithm for lung cancer prediction in that it produced the best results for accuracy, F1 score, precision, and recall and also had the lowest false negative rate of 0.023676. This is followed closely by RF, which had the second lowest false negative rate at 0.132411, and the decision tree at 0.285266. The decision tree has demonstrated the worst performance measure in all the training carried out. On the other hand, the RF classifier has the second-best performance, while CNN has the best performance overall.
6. Conclusion
The research discusses significant challenges of diagnosing lung cancer early due to its advanced symptom manifestation and high mortality rates. It highlights the potential of convolutional neural networks (CNNs) and nature-inspired optimization algorithms like grey wolf optimization (GWO) in improving diagnosis accuracy. However, previous approaches have failed to effectively enhance diagnostic performance, leading to high false negative rates. To address this, the research proposes a CNN-based GWO algorithm, which significantly outperforms other methods with an average accuracy of 96% and a low false negative rate of 0.023676. Despite this improvement, there is still room for further enhancement in reducing false negative rates and enhancing classification algorithms for better lung cancer diagnosis.
7. Future Work
A potential future direction for this research involves exploring additional machine learning techniques or hybrid models that integrate different algorithms to further improve the accuracy of lung cancer diagnosis. For instance, researchers could investigate ensemble methods that combine the strengths of multiple classifiers or develop hybrid models that leverage both image-based features extracted by CNNs and clinical data to enhance prediction accuracy. Additionally, researchers could focus on expanding the dataset used in training these models to incorporate more diverse patient demographics, tumor characteristics, and imaging modalities. This could help in developing more robust and generalizable diagnostic models that perform well across different populations and imaging techniques.