A Comparative Study of Two Tree-Based Models for Predicting Flyrock Velocity at Open Pit Bench Mining ()
1. Introduction
Bench blasting is a widely assigned method in surface mining engineering for breaking or moving hard rock. In this operation, 20% - 30% of the explosive energy is used for rock breakage and movement, while most of the explosive energy is wasted and not being used effectively [1] [2] . The wasted energy is the main cause of the blasting-induced environmental impacts, including flyrock, air blast, and ground vibration, which are undesirable phenomenons in drilling and blasting [3] .
Flyrock, the unwanted ejection of rock fragments from a blast site during bench blasting primarily caused by explosive energy, has three main mechanisms as explained in the studies (refer to Figure 1) (see [4] [5] ).
· Cratering: This occurs when explosive force creates a crater at the blast site, projecting rock fragments in various directions.
· Face Burst: This happens when the blast energy is directed towards the vertical bench face, causing rocks to be ejected from the face.
· Rifling: Involves rocks being propelled in a specific direction, like a bullet, often due to improper stemming of blast holes or the explosive force following a path of least resistance.
Based on the range of projectile theory which can be used for estimating flyrock distance or range. The speed of flyrock directly influences its distances; the higher the flyrock velocity the greater the flyrock distance [6] [7] . On the other hand, accurately calculating flyrock distance requires looking at each characteristic of flying rock such as flyrock velocity, diameter, and launch angle that affects its range.
According to multiple pieces of conducted research in this field, various parameters influence flyrock occurrence. The geological characteristics of the host rock, including its mass rating, unconfined compressive strength, density, and fracture density categorized into uncontrollable factors. The second group is controllable factors, which include blast design-related parameters such as burden, spacing, bench height, powder factor, stemming, charge per delay, and hole diameter [5] [8] .
To predict blasting-induced flyrock in open pit mines, empirical and artificial intelligence (AI) have been the most popular techniques applied during the past
![]()
Figure 1. Three mechanisms of flyrock at bench blasting: face bursting, rifling, and cratering.
three decades [3] . Between these, AI techniques are highly recommended in predictive tasks, such as flyrock prediction in blasting, due to their advantages. These include high accuracy, as AI models can find complex patterns in data that are not at once clear, leading to more precise predictions. Plus, AI models offer significant time-saving capabilities, as once trained, they can process and analyze large volumes of data much faster than conventional methods. Additionally, AI’s ability to manage complicated problems can be beneficial in fields like mining engineering, where variables like rock characteristics, blasting parameters, and environmental status are interdependent and intangible. However, it is important to note challenges, such as the need for quality data.
A variety of artificial intelligence techniques employed to predict the distance of flyrock in bench blasting. For example, a study employed a fuzzy system to estimate the flyrock phenomenon in an iron mine in Iran, yielding promising results. This research involved analyzing a blasting dataset with parameters such as burden, spacing, hole depth, stemming, specific drilling, charge per delay, rock density, and powder factor. It is important to note, that other parameters like crack density and delay time, which might influence flyrock occurrence, not included in this study. The study named the powder factor and stemming length as the most influential factors, with rock density being the least impactful variable [9] .
AI predictive models were developed to estimate flyrock distances in the Soungun open pit copper mine, utilizing a dataset of 245 samples including key blast parameters such as hole diameter, length, spacing, burden, stemming, powder factor, and specific drilling, although bench face conditions, rock density, and unconfined compressive strength were not included. The comparison between the efficacy of Support Vector Machines (SVMs) and Artificial Neural Networks (ANNs) revealed that SVMs were more effective than ANNs in predicting flyrock distances, which ranged from 25 to 95 meters in the dataset [10] .
A study introduced Artificial Neural Networks (ANN) for predicting flyrock in boulder blasting, emphasizing that powder factor, stemming, and charge length are the most dominant parameters influencing flyrock distance, while hole diameter, hole depth, burden, hole angle, and explosive per hole are less significant contributors. The authors conducted a comparative analysis between ANN and traditional empirical methods, finding that ANN showed superior accuracy in predicting the distance of flyrock [11] .
A novel approach for flyrock estimation, the ICA–ANN model, which integrates the Imperialist Competitive Algorithm (ICA) with Artificial Neural Networks (ANNs), was proposed, utilizing 113 samples in the blasting dataset to determine that the powder factor and charge per delay are the most effective factors among all inputs. However, critical rock properties like uniaxial compressive strength, tensile strength, and bench face conditions were not considered in this analysis [12] .
In a study using seventy-six data points, multiple predictive models were built, including a Random Forest model for air blast prediction, where the focus was more on blast design issues than rock mass characteristics. The study considered inputs such as hole depth, stemming, burden, spacing, the maximum charge per delay, powder factor, and flyrock distance, while the output measured was air overpressure [13] .
In another study, a novel kernel-based extreme learning machine was employed for flyrock prediction, where data from three quarries in Malaysia were analyzed. The study focused on inputs such as spacing, burden, stemming length, and powder factor, with flyrock distance as the target. However, critical rock properties like unconfined compressive strength and Brazilian tensile strength were not considered. The analysis revealed that stemming length was the most significant factor, while spacing had the least impact [5] .
Twenty-four algorithms for flyrock prediction were investigated, where the algorithms were tested using three statistical indexes (AARE, R2, and RMSE) to check the performance of the models and compare the results. The study focused on spacing, burden, powder factor, stemming, and density as inputs, with flyrock distance as the output. While a considerable array of algorithms was employed, the range of their inputs remains limited, with the study concluding that spacing is the most critical point in flyrock modeling [14] .
Based on the literature, numerous researchers have attempted to predict flyrock distance, ground vibration, and air blast using distinct types of machine learning algorithms with favorable outcomes. Nevertheless, to the best of my knowledge, few studies have specifically focused on the characteristics of flyrock, such as elevation angle and velocity. Another interesting point is that they highlighted different parameters as the most influential factors in flyrock occurrence. Given these approaches, it can be concluded that flyrock prediction is site-specific, and it may require studying and constructing predictive models tailored to the blasting site in terms of environmental impact, particularly flyrock.
In this research, we investigate the prediction of flyrock velocity by applying two machine learning algorithms, namely Decision Tree and Random Forest. By building two tree-based predictive models for flyrock velocity, this study aims to contribute to defining a safety zone for bench blasting at the open pit mine. Furthermore, the second goal is to assess and compare the capabilities of both models in predicting flyrock velocity.
This paper comprises four main divisions, including the data, which covers data pre-processing and collection; the methodology, explaining the employed approach, focusing on machine learning along with evaluation matrixes like MSE, R2, and MAPE; the results and discussion, which elaborate on the main finding of the study, including model comparison and sensitive analysis; consequently, the final section sums up the research outcomes and discuss the limitations and future work.
2. Data
2.1. Data Collection
The simplified geological map (Figure 2) depicts the location of the Mine site at Kagoshima, southern of Japan’s Kyushu Island. Kagoshima has long been known as a gold-producing prefecture in Japan. Its gold deposits are classified into veins and massive deposits. The host rocks of the mine deposit include pyroxene andesite, volcanic conglomerate tuff, tuffaceous conglomerate, and plagioclase tuff, with thin layers of tuffaceous mudstone. The thickness of each layer is dozens of
![]()
Figure 2. Simplified geological map of the study area.
![]()
Figure 3. Top right: installed high-speed camera, three other pictures show the bench before, during, and after blasting.
meters. The mining operation runs through open pit bench mining. After drilling with crawler drills, the ore is blasted and transported, making a production rate of approximately 8000 tons/month.
To understand the flying behavior of the blasted rock, a number of blasts were conducted under various blasting standards and bedrock conditions. First, the face surface before blasting was photographed to figure out the bench face conditions, and the cracks on the face surface were discovered. Then, the installed camera parallel to the bench face was operated to capture the flying behavior of the blasted rock including flyrock velocity immediately after blasting (Figure 3). A high-speed camera with a shooting speed (s): 1/1000, Number of shots: 8841 (upper limit), and shooting times: 8.841 (at 1/1000s) was used (Figure 4).
The rest of the data gathered through various processes including laboratory tests, and site observation. Laboratory tests supplied data on rock density, unconfined compression strength, Brazilian tensile strength, point load, and rock quality designation. On-site parameters, such as burden, spacing, bench height, powder factor, charge volume, and drilling length, were recorded at the mine site. The entire data collection process has been repeated multiple times until a suitable number of samples have been obtained.
2.2. Data Preprocessing
Once the data have been collected, abnormal and missing values in the dataset have been identified and managed. For this purpose, we adopted the mean imputation strategy, and no abnormal values were found within the dataset [15] . However, for the missing values in the target column and their corresponding cells in other columns, a different strategy is adopted: these are removed rather
![]()
Figure 4. High-Speed Photography Equipment Setup: (a) Camera, (b) Computer,(c) Shutter, (d) Cables,(e) Camera Stand and (f) Storage containers for transporting and protecting equipment.
than being filled using the mean method. Feature selection is executed to figure out the most effective elements. Due to the process of feature selection, variables such as drilling length, rock quality designation, and point load strength have been omitted from the later analysis. The dataset before and after preprocessing is depicted in (Figure 5).
The strength of the linear relationship between inputs and output has been plotted to distinguish which factors strongly influence the flyrock velocity. Reference to (Figure 6), variables such as crack density, charge volume, and powder factor manifest a positive correlation with the output. In contrast, variables like the burden and Brazilian tensile strength demonstrate a negative relationship. The rest of the variables show a weak linear relationship with the target parameter.
In total, eighty-three blasts at the open pit mine were originally recorded, encompassing thirteen blast-related parameters. However, following the data preprocessing and feature selection, the analysis was refined to include only seventy-two samples, focusing on nine specific parameters, thereby excluding some of the initially recorded data. Descriptive statistics for the dataset, including variable names, units, number of experiments, mean, standard deviation, minimum values, and maximum values, are presented in (Table 1).
Data splitting into training and test sets is crucial before applying machine learning algorithms [16] . Hence, inputs and outputs were separated in the dataset.
![]()
Figure 5. Data preprocessing: Before and after overseeing missing values, and features selection.
![]()
Figure 6. Linear relationship of features considering a scale between positive and negative one.
![]()
Table 1. Data statistic description including number of experiments, mean, standard deviation, min and max values, and recorded parameters.
Then, it is divided into a train set and a test set, as illustrated in (Chart 1). The output of this analysis is the velocity of flyrock, and there are nine inputs as listed in the table above. The train set holds approximately 80% of the total dataset employed for training the two machine learning algorithms. On the other hand, the test set making up almost 20% of the total dataset, was used for the assessment of the machine learning performance.
Through these steps, data preprocessing has been completed, and the data is now ready to be implemented into machine learning algorithms for the development of predictive models. Data preprocessing is essential for machine learning to ensure data quality, scrub the data, and prepare the data because the modality of the inputs directly influences machine learning performance [17] [18] .
3. Research Methodology
The methodology employed in this study is described in this section, which concentrates on the prediction of flyrock velocity through the utilization of two machine learning algorithms: Decision Tree and Random Forest. Specifically, the research procedure is classified into three leading steps, including data preparation, model development, and model performance evaluation, as presented in (Chart 2). Each of these steps plays a striking role in attaining the investigation goals.
The research began with collecting blasting data from the open pit mine, followed by data preprocessing and feature selection. This process also included splitting the data into training and testing sets. The detailed methodologies and rationales for these steps are thoroughly explained in the data section of the research.
After the data collection and preparation, the study proceeded to develop research models. Two algorithms; Decision Tree and Random Forest regressions were developed to predict the velocity of flyrock.
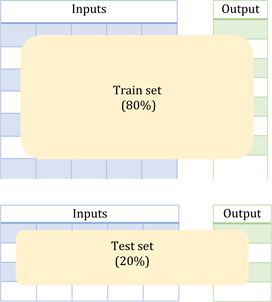
Chart 1. Training data and test data with their portion percentage.
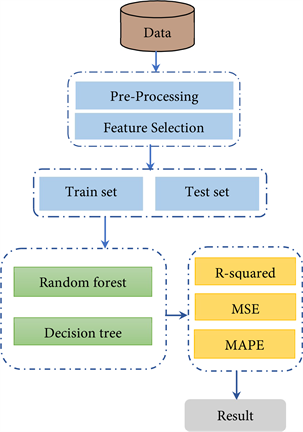
Chart 2. Research method sequential steps: Data preparation, train-test split, machine learning methods application, evaluation metrics, and resultant outcomes.
Machine learning is universally divided into three major branches: Supervised Learning, where models are trained on labeled datasets to learn the relationship between input and output; Unsupervised Learning, which involves training models on data without predefined labels, enabling the model to identify patterns and structures on its own; and Reinforcement Learning, where models learn decision making through actions in an environment and receive feedback in the form of rewards or penalties [19] . In addition, the machine learning in the targeted study is supervised learning, which is operated through Random Forest and Decision Tree. These algorithms have been used in regression tasks involving numerical data that resulted in qualified modeling and accurate predictions [20] [21] . Since our data is numeric with consideration of the regression method in the study, that is why we picked out Random Forest and Decision Tree.
Firstly, Decision Tree regression is a predictive modeling approach where a tree-like structure is constructed to make decisions about the target variable; a simplified Decision Tree is presented in (Figure 7). Each internal node in the tree stands for a decision based on a specific feature, and each leaf node provides the predicted outcome. The tree is built by recursively partitioning the dataset, optimizing for the reduction of variance in the target variable within each subset. While the Decision Tree is known for its interpretability, it is important to note that it may be prone to overfitting [22] [23] .
![]()
Figure 7. Structure of a Decision Tree, which is composed of a root node, decision nodes, and leaf nodes.
The machine chose a maximum depth of six in my Decision Tree model, as displayed in (Figure 8), whereas the recommended interval for choosing the maximum depth is set between 1 and 16, to find the most suitable depth. Increasing the maximum depth of a Decision Tree can lead to improved training accuracy due to its ability to capture complex patterns, but it also raises the risk of overfitting and reduces testing accuracy.
Secondly, Random Forest is an ensemble learning technique that can address the limitations of individual Decision Tree. It builds multiple Decision Trees by introducing randomness during the training process. Each tree is trained on a random subset of the features and data points, and their predictions are combined through averaging for regression tasks. The ensemble characteristics can help mitigate overfitting and enhance the model’s performance [24] .
In general, Decision Tree and Random Forest regressions offer flexible and interpretable models for predicting labeled datasets. While Decision Tree provides transparency, Random Forests enhance predictive accuracy by leveraging the strength of multiple trees and introducing randomness during the training process. These models find applications in diverse domains, including finance, healthcare, and engineering fields [25] [26] .
The last step of the research method section is to discuss machine learning performance evaluation. Three evaluation matrixes have been elected to evaluate the predictive capabilities of the implemented machine learning methods.
Coefficient of determination (R2): It is a statistical measure of the proportion of variance in the dependent variable (target) that is explained by the independent features. The formula for the coefficient of determination is provided in (Equation (1)).
, (1)
![]()
Figure 8. Decision tree model for prediction of Flyrock velocity at bench blasting with a max depth of six.
where
is the actual or observed value for the ith data point,
is the predicted value for the ith data point, n is the total number of samples, and
is the mean of the actual values ( [27] ).
R2 = 0: A regression model indicates that the model fails to capture any of the explanatory power of the independent variables with respect to the dependent variable.
R2 = 1: A regression analysis signifies that the regression model explains 100% of the variance in the dependent variable. This indicates a perfect fit between the model predictions and the observed data. All observations fall exactly on the regression line.
0 < R2< 1: The model explains a fraction of the total variability in the dependent variable. The value closer to one, the better the model for explaining dependent variables based on inputs [28] .
Mean squared error (MSE): This is a commonly used matrix to measure the average squared differences between actual and predicted values [29] . It gives higher weights to large errors. The formula for MSE is:
, (2)
where
is the actual or observed value for the ith data point,
is the predicted value for the ith data point, and n is the number of samples.
A lower MSE indicates a better fit of the model to the data. The smaller the MSE, the better the model is at predicting the target variable. When comparing models, the one with the lower MSE is preferred.
Mean absolute percentage error (MAPE): this matrix calculates the percentage difference between actual and predicted values, providing an idea of the relative error. The formula for MAPE is:
, (3)
where
is the actual value or observed value for the ith data point,
represents the predicted value for the ith data point, and n is the total number of samples or data points.
The mean absolute percentage error (MAPE) can be interpreted as follows [30] [31] :
· MAPE < 10%: Indicates highly accurate forecasting.
· Ten percent ≤ MAPE < 20%: Reflects good prediction.
· Ten percent ≤ MAPE < 50%: Suggests reasonable estimation.
· MAPE ≥ 50%: Demonstrates inaccurate predictive capability.
To gain a comprehensive knowledge of the model’s prediction accuracy, these metrics were utilized to evaluate the models’ performance on test datasets. Models with lower values of MSE, and MAPE, and higher values of R2 indicate better performance.
As stated, the methodological framework of the study involves three major steps that are fundamental for designing predictive models using machine learning. These steps are data preparation, model development, and model performance evaluation, respectively.
4. Result and Discussion
The application of Random Forest and Decision Tree algorithms for flyrock velocity prediction at bench blasting has yielded promising outcomes, as have been appraised by three frequently used evaluation metrics for machine learning in regression tasks.
The bar chart (Figure 9) exhibits a comparison of the performance metrics between the Decision Tree and the Random Forest models regarding predicting the velocity of flyrock. The performance evaluation metrics are R2, MSE, and MAPE.
Coefficient of determination (R2): Regarding the bar chart, the blue-colored metric indicates the proportion of the variance in the dependent variable that is predictable from the independent variables. As calculated scores on the bar plot, the Random Forest model owns a higher R2 value (0.92) than the Decision Tree (0.83), suggesting it can better predict flyrock velocity based on the given features.
The orange-highlighted mean squared error (MSE) measures the average of the squared difference between the estimated and actual values. Lower values of MSE indicate better performance. Comparative analysis reveals that the Random Forest model manifests a reduced MSE than the Decision Tree, indicating superior predictive accuracy.
The mean absolute percentage error (MAPE) is presented in green on the
![]()
Figure 9. Three evaluation metrics include r-squared, mean square error, and mean absolute percentage error.
above bar chart. It is one of the most frequently used metrics for performance evaluation in machine learning. In this scenario, the outcome derived from this metric demonstrates that both models exhibit substantial predictive proficiency.
At the end of the evaluation process, it can be extracted that the Random Forest model exceeds the Decision Tree in predicting the flyrock velocity when evaluated by R2 and MSE. However, depending on the relative amount of MAPE, both models perform somehow similarly. Eventually, it could be implied that the Random Forest offers higher predictability.
Feature importance in machine learning refers to techniques used to determine how much each input variable (or feature) contributes to the predictive power of a model. In models like Random Forest, feature importance is quantified, usually on a scale from 0 to 1, indicating the relative importance of each feature in making accurate predictions.
Through (Figure 10) analysis, features such as burden, crack density, and powder factor are identified as extremely significant in predicting flyrock velocity. Their higher values suggest that variations in these parameters can have a considerable effect on the predicted outcome. Conversely, features with lower importance scores, such as bench height, appear to contribute less to the model’s predictive power. Other features demonstrate a moderate influence, contributing to the model’s overall predictive capabilities in a balanced manner.
These findings, compared to other studies on the flyrock phenomenon, reveal both similarities and differences. To give examples, research focuses attention on powder factor and hole depth as critical factors, while burden and spacing are
![]()
Figure 10. Feature importance based on their influence on the target/ output considering random forest regression.
deemed less influential in predicting flyrock distances using tree-based algorithms, including Random Forest [22] .
Another conducted study highlights the considerable influence of powder factor and blast ability index on flyrock behavior, pinpointing the consideration of site-specific geological condition as a key factor in assessing the distance of flyrock produced by blasting. They also clearly stated that their finding cannot be trustable for other mining sites [32] .
The feature importance technique collaborates in understanding which features are the most sensitive and can guide feature selection for improving model performance. In practical terms, focusing on features with higher importance values can often lead to more efficient use of resources and better model optimization.
A comparative analysis of Random Forest and Decision Tree models in terms of their ability to generalize on the training dataset depicted in (Figure 11). In the visualization, those data points that are located close to the ideal line express high accuracy. Since larger portion of the data points are clustered near to the perfect prediction line, this indicates that both models have effectively discerned the underlying pattern within the dataset. This proximity to the ideal line suggests a prominent level of accuracy and predictive proficiency from both algorithms, considering the training set.
Considering the test set data, in the Random Forest model, the data points tightly congregate near the perfect prediction line, indicating a higher precision in forecasting in unseen data (Figure 12). Maybe because it employs a method that aggregates predictions from multiple Decision Tree, which often results in more accurate results.
Conversely, the Decision Tree model displays several outliers (Figure 12), suggesting less reliability in unseen data predictions. It can be a reason to mention that the Decision Tree has a small level of overfitting because it has shown capabilities on unseen data, but not as good as on training set.
![]()
Figure 11. Random Forest regression and Decision Tree regression generalization on training data.
![]()
Figure 12. Comparison of Decision Tree and Random Forest prediction accuracy on test data.
To sum up, in training set bot models show similar generalizations. However, The Random Forest model performs better compared to the Decision Tree model on the unseen data set. Further supporting this clam, evaluation metrics such as R2 and Mean Squared Error (MSE), calculated on the test set, also affirm the enhanced capabilities of the Random Forest model over the Decision Tree. Based on this evidence our suggested model for flyrock velocity prediction is the Random Forest.
Based on the findings of this study, and using the principles of projectile theory stating maximum range will occur at 45 degrees, it is possible to calculate the maximum distance of flyrock projection at bench blasting. This approach offers a new method for determining safety zones in mining blasting. This method not only helps in mitigating the risk of flyrock induced accidents but also contributes to more efficient planning and execution of mining.
5. Conclusions
Researchers have dedicated their efforts to employing machine learning techniques for predicting flyrock occurrence during mine blasting, with several goals including predicting flyrock distance, ground vibration, and air blasts aiming to increase mining safety. However, accurately predicting flyrock remains challenging due to the influence of numerous factors, such as the geological properties of the rock and the adopted blasting standards. Meanwhile, the flyrock itself has distinct characteristics, including velocity, angle of projection, and size or diameter, adding complexity to the prediction task.
This study specifically focused on predicting the velocity of flyrock using Random Forest and Decision Tree. The Random Forest algorithm has demonstrated slightly more favorable outcomes in terms of predictive capability, evidenced by evaluation metrics result in unseen data.
The Decision Tree exhibits an r-squared value of 0.83, a mean squared error value of 4.2, and a mean absolute percentage error value of 5.6, which are still acceptable based on few conducted research. It can be said that tree-based algorithm can effectively contribute to flyrock velocity prediction.
In this study, the scope was confined to two machine learning algorithms, utilizing a modest dataset comprising nine features and seventy-two samples. Therefore, it is recommended that future studies investigating flyrock incorporate a more extensive array of algorithms and a significantly larger dataset. Additionally, focus on feature like burden, and powder factor will benefit any study on flyrock.
Acknowledgments
The author extends heartfelt appreciation to the co-author for their invaluable revisions and guidance. Additionally, special thanks to the Japan International Cooperation Agency (JICA) for facilitating this research opportunity at Kyushu University, which has been instrumental in the advancement of this study.
Abbreviations
The following abbreviations are used in this manuscript:
R2 Coefficient of determination.
MSE Mean squared error.
MAPE Mean absolute percentage error.
MIV Maximum initial velocity.
RQD Rock quality designation.
PF Powder factor.
BTS Brazilian tensile strength.
UCS Unconfined compressive strength.
CD Crack density.
B Burden.
S Spacing.
D Density.
CV Charge volume.
BH Bench height.