Fish Assemblage and Abundance Distribution in Nanji Islands Marine Nature Reserve in Relation to Season Change ()
1. Introduction
Nanji Ping Yang County, is located southeast of the sea in Zhejiang Province, with the latitude range of 27˚24'30''N - 27˚30'00''N, according to the range of 120˚56'30''E - 121˚08'30"E by area of more than 500 m2. Nanji Islands Marine Natural Reserve Area is a very representative protected area (MPA) in China [1] . The Nanji area comprises 52 islands, numerous vibrant reefs, and surrounding waters spanning a total of 201.06 km2, with a land area of 11.82 km2. Nanji is situated at the coordinates 27˚27'00'' North, 121˚05'00'' East, and is approximately 30 nautical miles away from the nearest point on the mainland to the west. In 1998, the State Council of China approved the establishment of the country’s initial set of five national marine nature reserves. China subsequently became the first nation to join the United Nations Educational, Scientific and Cultural Organization’s World Network of Biosphere Reserves for marine nature reserves in 2005. These reserves have also been recognized by national media, including “China Geography Magazine”, as among the top ten most beautiful islands in China. They are home to a diverse array of marine life, including algae, shellfish, and various bird species. Nanji Islands National Marine Reserve has been established with the primary objective of preserving the marine ecosystem and promoting ecological environmental protection. The reserve is divided into three management zones, namely the core area, buffer area, and experimental area. The core area spans 8.04 km2, the buffer area covers 34.04 km2, and the experimental area extends over 158.98 km2. The 28 km coastline consists of exposed bedrock and sharp cliffs, bays and islets. The Biosphere Reserve has a wide variety of marine habitats that support a rich variety of shellfish and algae. Fifteen of the 403 species of shellfish identified have been found only in Nanji waters. The shellfish and algae are distributed across the tropical and temperate oceans, making this species-rich site even more important for conservation and scientific research. These species are concentrated in the core areas, which consist of two islets and part of Nanji Island and their surrounding waters, covering an area of 663 hectares. The total area, including the transition area, is 20,629 hectares [2] .
2. Materials and Methods
2.1. Materials
As used here, the data from November 2013 (autumn), February 2014 (winter), May 2014 (spring) and September 2014 (summer). Fish resource information was obtained from a fishery resource survey conducted in the Nanji Islands Marine Protected Area. Survey stations, mainly in Nanji Islands main reef area (large Lei Hill, a small island Lei mangosteen, after the mountain deer, Nanji Island, a small island, Firewood Island, Lantau door, broken islands, under saddle, pointed island, flat island, small diesel island) around, etc.. A total of 25 fixed trawl sampling stations (Figure 1). Figure 1 shows the survey stations of fish in Nanji Islands Marine Nature Reserve.
2.2. Methods
An important consideration in the design of any robust ecological study is the choice of sampling method. Different sampling methods can lead to different estimates of the mean and variance of a population. This in turn will have important consequences for the power of any sampling programme to detect changes
![]()
Figure 1. Survey stations of fish in Nanji Islands marine nature reserve.
in the variable of interest. To maximise the power of a monitoring programme to detect change over time, a sampling design should be chosen that maximises the mean and minimises the variance due to sampling error. Within large-scale studies or monitoring programmes, different scales of nested sites allow the investigation of spatial variation and provide a test of differences between regions over and above the variation between sites within a region. Therefore, an important consideration in the design of any large-scale study is the benefit of additional replication, either at the lowest level of a design or at the site level. Within each region, sampling devices are implemented with the survey boats and nets: survey vessel “flat 501 fishing moratorium” host power of 58.8 kW, tonnage of 10 t; survey nets for 52.8 m × 50.0 m of cystic bottom trawl, and its network of high net width of 4.3 m, respectively. Each station trailer for 3.5 kn, 1 h long during towing. Survey sampling and measurement are provided in the “Specification for Oceanographic Survey - Marine Biological Survey” of the relevant standards. The resulting samples were all fish sampled into the sample bag, the number recorded in the sample bag fishing records. On the low cabin refrigerated on the low cabin refrigerated preservation, sample identification analysis in the laboratory, the use of electronic weighing scales, with an accuracy of 0.1 g. Informally, the length is equal to the multiple correlation of the variable with the displayed ordination axes. In addition, the Spearman rank correlation coefficient was used to determine the significance of the relationship between each environmental variable and fish abundance data. Species diversity was expressed using Shannon diversity index (H') and Pielou’s evenness index (J):
and
And where Pi is the proportion of individuals in a community that are members of the species.
In the case of species, s is the total number of fish species. The dominant and important species were classified by the result of the calculation of the index of relative importance (IRI): IRI = (Pi + Wi) Fi; where Pi is the ratio of individuals of If species to the total number of fish species, Wi is the weight of If species and the total weight of fish species, and Fi is the ratio of the frequency of If species to the total number of sampling times [3] . The similarity between sampling sites and species was calculated using the equation: q = c/(a + b − c), where q is the similarity of 2 sampling sites, c is the sum of the lower number of samples of each species pair common to 2 given sampling sites analysed, a is the total number of samples of a species at sampling site A, and b is the total number of samples of a species at sampling site B. If q is between 0 and 0.25 and indicates no similarity, q is between 0.25 and 0.5 and indicates moderate no similarity, q is between 0.5 and 0.75 and indicates moderate similarity, q is between 0.75 and 1 and indicates high similarity. One-way ANOVA was performed to examine the variation in Shannon’s (Shannon diversity index) and Pielou’s (evenness index) of two surveys, and when a significant difference was found, Tukey’s test was performed (P < 0.05). All statistical analyses were performed in SPSS 16 and the isolation of the diversity index was expressed by Surfer 8.0. Fish are sensitive to changes in water chemistry due to various anthropogenic activities. Fish responses to environmental perturbations, including hydro-morphological factors, are different in time and space compared to simpler organisms, as they tend to be integrated over larger intervals. Fish were identified as suitable for biological assessment due to their easy identification and economic value. As far as the diversity indices are concerned, we processed the data in Excel. For the calculation, we used the Margalef method (D = (S1)/lnN), where S is the total number of fish species and N is the total number of fish. To calculate the index of regularity, we used the method Pielou: with J' = H'/lnS, where J' for fish species regular, in other words said that appear every time, and S is the number total fish speeds. To calculate the index of diversity improvement, we used the Shannon-Wiener formula as follows H' = −Σs. Fish species diversity, wi/w is the ith fraction of the total fish biomass. Fish community similarity is the similarity between fish community values. There are five types of similarity coefficients: the correlation coefficient (association coefficients), the distance factor (distance coefficients), and the internal product of the coefficients, the information coefficient (information coefficients) and the probability coefficients (Probability coefficients). The paper of fish community structure analysis using the Bray-Curtis similarity coefficient distance factor, then, based on this data analysis, non-linear multidimensional scaling (Non-Metric Multidimensional Scaling, referred to as NMDS) for the standard two-dimensional sequence diagram, using cluster points (CLUSTER) as a branch map. Fish community structure analysis and statistical hypothesis testing did not work, only helps to generate hypotheses, similarity analysis (analysis of similarities, referred to ANOSIM = Analysis of Similarities) can be used to test between different communities; the difference is represented by R, the significance level is represented by the value of R P. The degree of similarity (similarity analysis) to compare different clusters, the percentage similarity analysis (similarity of percentage analysis, SIMPER) can find out the different communities (seasons) within a similar community structure and the typical types of different communities (season), differences in community structure; differences between species.
In this paper, the abundance-biomass curve (abundance-biomass curves) evaluated the stability of fish community structure. For the purpose of stabilizing communities; ABC curve the total biomass curve is always at the top of the abundance, abundance ratio of biomass with higher diversity; moderate disturbance; large individual dominant species disappeared and between abundance and biomass to reduce the imbalance; abundance & biomass difference between the curves do not exist, or intersect, overlapping; when the community has serious disturbances, or loss of balance, the total abundance curve is located above the biomass.
PCA (Principal Component Analysis) applied to environmental and fish data was used to summarise and describe the relationship between these two datasets and to detect patterns along different stations. CCA (Canonical Correspondence Analysis) was used to visualise and describe the relationship between environmental variation and fish diversity.
3. Results
3.1. Species Composition
Figure 2 shows the repartition of Nanji Islands Fish in different orders.
Survey areas of Nanji Islands were identified 102 species of fish, which belong to 86 species Actinopterygii, 11 species belongs to Acanthopterygii, 3 species belong to Elasmobranchii and 2 species belong to Chondrichthyes. In these four classes we have 19 orders as follows: 44 species of Perciformes, 9 species of Clupeiformes, 8 species of Pleuronectiformes, 8 species of Scorpaeniformes, 6 species of Anguilliformes, 6 species of Tetraodontiformes, 3 species of Aulopiformes, 2 species of Gadiformes, 2 species of Syngnatiformes, 2 species of Myliobatiformes, 2 species of Mugiliformes, 1 species of Gasterosteiformes, 1 species of Scombriformes, 1 species of Myctophiformes, 1 species of Uranoscopiformes, 1 species of Siluriformes, 1 species of Lophiiformes, 1 species of Rajiformes, 1 species of Carcharhiformes (Figure 3). And among these 19 orders we have 52
![]()
Figure 2. Repartition of Nanji islands fish in different orders.
families. Thus, the reef area of Nanji Islands showed different species of fish and the most important belong to the families Sciaenidae, Engraulidae and Gobiidae. The survey obtained showed large groups of fish that have a remarkable economic importance and the higher economic value of fishing target species has Polydactylus sextarius, Collichthys lucidus, Thrissa kammakensis and Thrissa mystax. There is also a large group of species including Chaeturichthys hexanema, Odontamblyopus rubicundus, Odontamblyopus rubicundus, Johnius belengerii, Ctenotrypauchen chinensis and Harpodon nehereus.
3.2. The Dominant Species
Calculation of the dominant fish species in different seasons used the Index of Relative Importance (IRI), the relative importance index greater than 1000 species as the dominant species [4] . The dominant fish species in the waters of the 25 survey stations of Nanji Islands Marine Nature Reserve a total of 8 species, the number of dominant species in four seasons (winter, spring, summer and autumn) respectively (Table 1). The analysis showed that the Nanji Islands Marine Nature Reserve is not one species of fish is the dominant species of fish throughout the year; each species is dominant only one season, except Polynemus sextarius, which appeared in winter and autumn as dominant. In winter there are three types of dominant species, IRI value in decreasing order of three wire (Chelidonichthys kumu, Collichthys lucidus and Polynemus sextarius); their 88.5% of the total fish biomass accounted for biomass, abundance of fish accounted for 90.8% of the total abundance; there are two kinds of dominance species in spring, IRI value in decreasing order (Takifugu xanthopterus and Champsodon snyderi), which accounted for 30.6% of the biological fish biomass, abundant accounted. There is one kind of dominant species in summer, IRI value in decreasing order (Trachurus japonicus), their biological accounted for the
![]()
Table 1. The Index of Relative Importance of fish dominant species of Nanji Islands Marine Nature Reserve amount four seasons.
Notes: “-” means it disappeared in this season.
total biomass of fish the amount of 0.85%, accounting for 0.05% of the total abundance of fish; there are two kinds of dominant species in autumn, IRI value in decreasing order (Harpodon nehereus and Polynemus sextarius), their biological accounted for the total biomass of fish of 54.7%, accounting for 75.9% of the total abundance. As can be seen from Table 1, in spring and summer there were 0 species of dominant species, in summer and autumn there were 0 species of dominant species, in autumn and winter there are 0 species of dominant species in winter and spring. This means that the R-value of the dominant species between seasons shows nothing. Visible, no seasonal succession of dominant species of fish phenomenon is very obvious; about these four seasons we can also say that there are no transfer dominant species. Table 1 shows the index of relative importance of fish dominant species of Nanji Islands Marine Nature Reserve.
3.3. Temporal and Spatial Variation of Biomass
The average annual marine fish survey biomass is 4832.25 g/h, from different seasons, the average biomass in winter (10779.88 g/hour) > the average biomass in spring (3624.1 g/hour) > the average biomass in autumn (3158 g/ha) > the average of summer biomass (1767 g/h). In winter, the biomass distribution range of each station is from 0 g/h to 132,806 g/h. The highest biomass occurred in stations 22 and 23; the lowest biomass occurred in stations 1; 6; 4; 12; 13 and 14. From different regions, the spring fish biomass Nanji Islands reef area is generally low, except for the station 22 and 23 biomass island near 1000 g/h - 1,400,000 g/h, other biomass in most stations 0 g/h - 10,000 g/hour (Figure 3). In spring, bit biomass distribution range of each station it is from 83.04 g/h - 23944.8 g/hour. The highest biomass appeared in station 21 and 23; the minimum biomass is in station 1; 2; 5; 7; 8; 9 and 20. From different regions, the fish biomass in summer is Nanji Islands reef area was significantly increased. In summer, bit biomass distribution range of each station it is from 336.7 g/h to 12,996 g/h, a difference of 38 times the level of the average biomass of summer (1767 g/hour). The highest biomass occurred at stations 3; 7 and 11, the lowest biomass at stations 10; 12; 15; 16 and 19. Looking from different regions, summer fish biomass in Nanji Islands reef area was down, back to the spring level, biomass of most stations are at 350 g/h - 13,000 g/hour, the biomass of stations 15 and 19 is dropped to 300 g/h - 1000 g/hour (Figure 3). In autumn, bit biomass distribution range of each station it is between 1931.6 g/h - 200776.0 g/h, a difference of 103 times the level of the average biomass of autumn (3158 g/hour). The highest biomass occurred at stations 3, 6, 20 and 23, the lowest biomass occurred at stations 1; 2; 13; 14 and 18. Figure 3 shows the distribution of coral reef area fish biomass in Nanji Islands Marine Nature Reserve.
3.4. Temporal Changes in Abundance
The average annual sea fish survey abundance is 1392 ind/h, from different seasons, the average abundance in autumn (3084 ind/hour) > summer (1767 ind/h) >
![]()
![]()
Figure 3. Distribution of coral reef area fish biomass in Nanji islands marine nature reserve.
winter (531 ind/h) > spring (186 ind/h). In spring, each station distribution of abundance is represented by different color, bit abundance distribution range of each station it is from 10 ind/h - 1246 ind/hour, a difference of 124.6 times the level of the average abundance of spring (186 g/h); the highest abundance appeared in station 21, the lowest abundance appears in station 12. From different regions, the spring of Nanji Islands reef area fish abundance is generally low, stations 1; 12 and 17 have a lower abundance than 100 ind/h, and other stations are in abundance between 100 ind/h - 1300 ind/h (Figure 4). In summer, each station distribution of abundance is represented by different color, bit abundance distribution range of each station it is from 81 ind/h to 5708 ind/hour, a difference of 70.4 times the level of the average abundance of summer (1767 g/h); the highest abundance appeared in stations 7; 8; 9; 13 and 17, the lowest abundance appears in station 19; 21 and 23. From different regions, the summer in Nanji Islands reef area fish abundance has increased, four stations continue to be distributed in abundance 80 ind/h - 500 ind/h, the abundance of other stations degrees are more than 500 ind/h, in 500 ind (Figure 4). In autumn, each station distribution of abundance is represented by different color; bit abundance distribution range of each station it is from 158 ind/h - 9660 ind/hour, a difference of 60.3 times the level of the average abundance of autumn (3084 g/h); the highest abundance appeared in stations3; 9; 15; 19 and 20; the lowest abundance appears in station1; 4; 6; 12; 13 and 14 (Figure 4). From different regions, the fall Nanji Islands reef area fish abundance except the five district stations, other stations were down (Figure 4) In winter, the different stations distribution of abundance is represented by different color (Figure 4); bit abundance distribution
![]()
![]()
Figure 4. Distribution of coral reef area fish abundance in Nanji Islands marine nature reserve.
range of each station it is from 0 ind/h - 5000 ind/h; the average abundance in winter it is about 531 ind/hour. The highest abundance occurred in stations 6, 3, 15 and 20; the lowest abundance occurred in stations 4, 13, 14, 17, 18 and 22. From different regions, the winter Nanji Islands reef area of fish abundance continued to fall, back to spring level, most of the stations are down in abundance 200 ind/h - 5000 ind/h, the first station was not invented due to climate problems with 0 ind/h. Figure 4 shows the distribution of coral reef area fish abundance in Nanji Islands Marine Nature Reserve.
3.5. Ecology and Distribution of the Main Economic Biomass of the Dominant Species in the Nanji Islands
Species identified in 25 stations amount four seasons and based on the IRI (Index of Relative Importance) gives us seven dominant species (Trachurus japonicus, Harpodon nehereus, Polynemus sextarius, Chelidonichthys kumu, Collichthys lucidus, Takifugu xanthopterus and Champsodon snyderi) distributed in different seasons (Table 1). According to the percentage of biomass of each season and the total occurrences of dominant species distribution, autumn was the most important with six dominant species (Harpodon nehereus, Polynemus sextarius, Chelidonichthys, Collichthys lucidus, Takifugu xanthopterus and Champsodon snyderi). The average biomass was winter (10779.8 g/h) > spring (3624.1 g/h) > autumn (3158 g/h) > summer (1767 g/h). In winter only 24 stations were valid and the first one was not due to climatic problems. During this season there were 5 dominant species. (Collichthys lucidus, Chelidonichthys kumu, Polynemus sextarius, Harpodon nehereus and Champsodon snyderi).
3.6. Polynemus sextarius
Height 2.8 - 2.9; 3.7 - 3.8 in length with caudal. Head 2.8 - 3.3; 3.8 - 4.4 in length with caudal. Eyes covered by a gelatinate membrane, 3 - 3.8; twice in the postorbital port of the head and slightly more than the interorbital space. Snout 2/3 length of eye, prominent. Large mouth, reaching for behind the eye. Maxillaries scaly, 2.3 in the head. Head covered with scales to tip of snout. The anterior and posterior nostrils close together, in the middle between the eye and the point of snout. Praeoperculum roughly serrated along its rear border, the lower serrations the longest. Its angle produced and rounded. A short, rather strong spine at the beginning of the lateral line. Upper lip weakly developed lower lip, well developed, not continuous at the symphysis. Band of villiform teeth on the jaw, not extending to their outside; a similar band on palatines. Origin of the first dorsal between that of the ventral and pectorals. The first dorsal spine is the strongest but not as long as the third, slightly shorter than the snout and eye [5] .
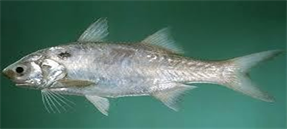
The average annual biomass from 25 stations is 4832.24 g/h. The biomass of Polynemus sextarius represents 15.5% of the total fish biomass. The biomass of Polynemus sextarius, in autumn (206428.18 g/h) > in winter (24219.5 g/h) > in spring and summer that has 0 g/h. In winter only 24 stations were valid. In autumn the highest biomass of Polynemus sextarius appears in station 20 for 42666.6 g/h, the lowest biomass appears in station 4 with 2.3 g/h, in winter the highest biomass appears in station 24 for 7255.3 g/h and the lower biomass appears in station 2 with 4.8 g/h, but station1 and 2 have 0 g/h. In summer and spring Polynemus sextarius does not appear. Figure 5 shows the distribution of Polynemus sextarius biomass in Nanji Islands Marine Nature Reserve.
![]()
Figure 5. Distribution of Polynemus sextarius biomass in Nanji Islands marine nature reserve.
3.7. Trachurus japonicus
The Japanese horse mackerel (Trachurus japonicus) is a species named after Mackerel in the Carangidae family. Their maximum length is 50 cm with a common length of 35 cm. A maximum weight of 0.66 kg and a maximum age of 12 years. They are found around the coast of Japan, apart from Okinawa Island, usually on sandy soil between 50 and 275 meters deep. They feed mainly on small crustaceans such as copepods, and shrimp and small fish. They are similar to the yellowtail horse mackerel around New Zealand and Australia, apart from having more gill rakers and larger eyes [6] .
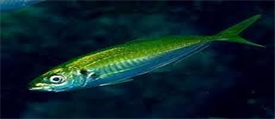
The average annual biomass from 25 stations is 4832.24 g/h. The biomass of Trachurus japonicus represents 1.0% of the total fish biomass. The biomass of Trachurus japonicus in summer (200.4 g/h)> in autumn (171.85 g/h), and does not appear in the other three seasons, namely winter and spring. In winter, only 24 stations were valid. In summer, the highest biomass of Trachurus japonicus occurred in station 7 with 97.8 g/h, the lowest biomass occurred in station 21 with 18.18 g/h. In summer, Trachurus japonicus appeared in 7 stations (7, 13, 20, 21, 23, 24 and 25) with a relatively low total biomass in all stations. In winter and spring, Trachurus japonicus did not appear. Figure 6 shows the distribution of Trachurus japonicus biomass in Nanji Islands Marine Nature Reserve.
3.8. Harpodon nehereus
Harpodon nehereus has a body elongated and compressed, eyes small, snout very short. Mouth very wide, armed with slender, recurring and depressible teeth of unequal size; palatin teeth also large and depressible; lower jaw longer than
![]()
Figure 6. Distribution of Trachurus japonicus biomass in Nanji islands marine nature reserve.
upper. Dorsal fin with 11 - 12 rays, followed by a conspicuous adipose fin. Anal fin with 14 - 15 rays. Pectoral feathers with 10 - 12 rays longer than head length. Pelvic fins very long with 9 rays. Lateral line with 40 - 44 scales, extending onto pointed median lobe of caudal fin. Colour uniform light grey; semi-transparent appearance. Known from the east coast of Africa, north from about Zanzibar; also the Red Sea, the “Gulf” and the Arab Sea. Elsewhere, eastward to the Western Pacific (East China Sea, widely found in the South and the Indian Ocean). Benthos pelagic, inhabits deep water offshore for most of the year, but also gathers in large shoals in delta of rivers to feed during monsoon. An aggressive predator. Feeds on small fish. Maximum over 40 cm; common between 10 and 25 cm [7] .
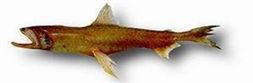
The average annual biomass from 25 stations is 4832.24 g/h. The biomass of Harpodon nehereus represents 39.2% of the total fish biomass. Harpodon nehereus is one of the most abundant species during the four seasons. The biomass of Harpodon nehereus in autumn (443411.59 g/h) > in summer (15955.4 g/h) > in winter (5025 g/h) > in spring (3287.28 g/h). In winter only 24 stations were valid. In autumn the highest biomass of Harpodon nehereus occurred in station20 with 94138.3 g/h, the lowest biomass appears in station 13 with 6.40 g/h, in summer the highest biomass appears in station 13 with 2279.4 g/h and the lowest biomass appears in station 19 with 3.5 g/h. Station 12 has 0 g/h. In winter Harpodon nehereus highest biomass appeared at station10 for 703.8 g/h and the lowest biomass appears at station 16 as 11.31 g/h but some stations have 0 g/h in winter like stations (1, 8, 15, 20 and 22). In spring the highest biomass of Harpodon nehereus appeared in station 23 for 392.5 g/h and the lowest biomass appears in station 12 as 10.08 g/h but some stations have 0 g/h such as stations (2, 9, 11, 17 and 25). Figure 7 shows the distribution of Harpodon nehereus biomass in Nanji Islands Marine Nature Reserve.
3.9. Chelidonichthys kumu
Chelidonichthys kumu is a species of fish, Triglidea family, the sea robins and gurnards. It is found in the western Indian Ocean and western Pacific Ocean, being common around Australia and New Zealand at depths down to 200 meters. Its length is up to 60 centimeters (24 in) [8] .
![]()
![]()
![]()
Figure 7. Distribution of Harpodon nehereus biomass in Nanji Islands marine nature reserve.
The average annual biomass from 25 stations is 4832.24 g/h. The biomass of Chelidonichthys kumu represents 50% of the total fish biomass. Chelidonichthys kumu is one of the most abundant species during the four seasons. The biomass of Chelidonichthys kumu in winter (138675.6 g/h) > in spring (19755.4 g/h) > in summer (12802.5 g/h) > in autumn (19.6 g/h). In winter only 24 stations were valid. In winter the highest biomass of Chelidonichthys kumu appeared in station 23 for 53629.6 g/h, the lowest biomass appears in station 13 as 86.7 g/h and 0 g/h in station1, in spring the highest biomass appeared in station25 for 7506.9 g/h and the lowest biomass appears in station11 as 126.7 g/h but some of the stations like (1, 2, 3, 4, 7, 12, ∙∙∙, 22) have 0 g/h. In summer Chelidonichthys kumu highest biomass appears at stations 11 for 3216 g/h and the lowest biomass appears at station 14 as 9.9 g/h but some stations have 0 g/h in winter such as stations (20 and 23). In autumn, the biomass of Chelidonichthys kumu appeared only in station 8, represented by its total biomass (19.64 g/h). Figure 8 shows the distribution of Chelidonichthys kumu biomass in Nanji Islands Marine Nature Reserve.
3.10. Collichthys lucidus
The big-head croaker, Collichthys lucidus, is a near demersal fish species of the family Sciaenidae. Collichthys lucidus is an important commercial species widely distributed in the middle and western Pacific, but its numbers have decreased seriously due to overfishing [9] .
![]()
![]()
Figure 8. Distribution of Chelidonichthys kumu biomass in Nanji Islands marine nature reserve.
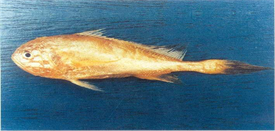
The average annual biomass from 25 stations is 4832.24 g/h. The biomass of Collichthys lucidus represents 23.1% of the total fish biomass. Collichthys lucidus is one of the most abundant species during the four seasons. The biomass of Collichthys lucidus in winter (83014.7 g/h) > in summer (4576.9 g/h) > in autumn (3152.2 g/h) > in spring (66.3 g/h). In winter only 24 stations were valid. In winter the highest biomass of Collichthys lucidus appeared in station 24 for 28668.2 g/h, the lowest biomass appears in station 8 as 94.08 g/h, in summer the highest biomass appears in station11 for 1080 g/h and the lowest biomass appears in stations 25 as 14.7 g/h but some of them have 0 g/h such as (6, 10, 12, ∙∙∙, 19, 23 and 24). In autumn, Collichthys lucidus highest biomass appears at station 6 for 1623 g/h and the lowest biomass appears at station1 as 91.2 g/h but some stations have 0 g/h in winter such as stations (3, 4, 7, 8, 9, 11, ∙∙∙, 25). In spring, the biomass of Collichthys lucidus appears only in station 24, represented by its total biomass. (66.3). Figure 9 shows the distribution of Collichthys lucidus biomass in Nanji Islands Marine Nature Reserve.
![]()
![]()
Figure 9. Distribution of Collichthys lucidus biomass in Nanji Islands marine nature reserve.
3.11. Takifugu xanthopterus
Takifugu xanthopterus is widely distributed in the northwest Pacific, and is known from southern Japan, the Bohai Sea, the Yellow Sea, and the East and South China seas, including Taiwan, at depths ranging from one to 100 meters. It appears to be locally abundant in parts of its range. It is a commercially important species. In Japan it is one of the top four species of fugu. Habitat modification in estuaries is occurring in parts of its range, and we infer that these events are contributing to population declines in parts from its range. However, declines are not approaching the thresholds for a threatened category. It is listed as least concern. We recommend monitoring its habitat status in the near future, population status, and harvest and trade levels. Due to the economic importance of the Takifugu genus, and the prevalence of taxonomical uncertainty within this group, we recommend further taxonomic studies using both molecular and morphological methods. Takifugu xanthopterus occurs in the sub-coastal zone and estuaries, on rock bottom [10] .
![]()
The average annual biomass of 25 stations is 4832.24 g/h. The biomass of Takifugu xanthopterus represents 20.5% of the total fish biomass. Collichthys lucidus is one of the most abundant species during the four seasons. The biomass of Collichthys lucidus in spring (40680.3 g/h) > in autumn (14688.07 g/h) > during autumn and winter, which have 0 g/hour. In winter only 24 stations were valid. In spring the highest biomass of Takifugu xanthopterus appears in station 18 for 5841.5 g/h, the lowest biomass appears in station 12 as 69.12 g/h, in autumn the highest biomass appears in station 3 for 13,000 g/h and the lowest biomass appears in stations 12 as 10.8 g/ha but some of them have 0 g/h such as (1, 2, 4, 5, 6, 9, 10, 11, 14, ∙∙∙, 25). In summer and winter Takifugu xanthopterus does not appear. Figure 10 shows the distribution of Takifugu xanthopterus biomass in Nanji Islands Marine Nature Reserve.
3.12. Champsodon snyderi
The lateral line system and its innervations were studied in Champsodon snyderi. (Champsodontidae). The lateral line system was composed of 43 channels and 935 superficial neuromas, the former being arranged in 8 lines. (7 on the head, 1 on the body). Tubular lateral line scales, clearly differing from the heart-shaped spinoid scales on the remaining parts of the head and body, were arranged dorsolaterally along the body, enclosing 19 canal neuromas. Surface neuromas on the body were vertically aligned along 3 distinct body sections (comprising 19 dorsal, 26 lateral, and 20 ventrally positioned vertical lines), the lateral section being separated from the adjacent sections by single dorsolateral and ventrolateral horizontal lines of superficial neuromata’s, respectively. All the canal neuromas in the lateral line scales were included in the dorsal vertical lines. Accessory lateral ramus, innervating most of the neuromas on the body, were derived from the lateral Ramus in a one-to-one relationship with the vertebrae [11] .
![]()
The average annual biomass from 25 stations is 4832.24 g/h. The biomass of Champsodon snyderi represents 10.1% of the total fish biomass. Champsodon snyderi is one of the most abundant species during the four seasons. The biomass of Champsodon snyderi in spring (19201.8 g/h) > in winter (110.8 g/h) > in autumn and summer that have 0 g/h. In winter only 24 stations were valid. In spring the highest biomass of Champsodon snyderi appeared in station14 for 2907.5 g/h, the lowest biomass appeared in station 17 as 47 g/h, in winter the higher biomass appeared in station 25 for 67.5 g/h and the lowest biomass appears in station 24 as 43.3 g/h. Champsodon snyderi only occurred at these two stations. In summer and autumn Champsodon snyderi did not appear. Figure 11 shows the distribution of Champsodon snyderi biomass in Nanji Islands Marine Nature Reserve.
![]()
Figure 10. Distribution of Takifugu xanthopterus biomass in Nanji Islands marine nature reserve.
![]()
Figure 11. Distribution of Champsodon snyderi biomass in Nanji Islands marine nature reserve.
4. Discussion
Due to the sampling method, many reef fish cannot be harvested. This makes this reef species survey small, as the survey found no grouper. In addition, the type of investigation in the history of recorded life span of a larger survey methodology also includes social survey, but the survey was only one year survey cycle, which also makes the investigation not exhaustive. Survey results show that the type of fish in the summer (58 species) > spring (55 species), >winter (51 species), >autumn (42 species). The type of season increased from spring to summer and decreased from summer to autumn. This may be due to the ever-changing sea continuously changing the marine environment, the waters of southern Zhejiang coastal elevation exists throughout the year, summer has been strengthened under the influence of the southwest monsoon, the elevation of nutrient-rich bottom waters endless upper steering, increasing the number of fish species; as temperatures drop in autumn, the water temperature also decreases the number of fish species; in winter due to the impact of low salinity waters north of the East China Sea, reducing the number of fish species also. Visible, seasonal succession of dominant species of fish phenomenon is very obvious, especially in spring and winter, summer transfers dominate species at this stage show the greatest change, but winter, the transfer of this dominant species changes in minimal. As Collichthys lucidus, Harpodon nehereus and Takifugu xanthopterus are dominant species and the most important percentage of biomass during these four seasons, and the area during the fishing season (spring, summer and autumn), but Takifugu xanthopterus was not found in the summer survey, which may be Taiwan and the region affected by warm, Jiangsu and Zhejiang coastal current complex system of currents and the impact of seasonal migratory fish-related activities, it may have some relationship with the randomness of fishery resources in the investigation. The survey shows that the waters in summer and autumn are generally higher biomass in the survey area northwest of the open ocean waters. This is because many fish leave the area in winter and spring to winter breeding sea level, and then return to the region in summer and autumn feeding fattening. Spatial and temporal distribution of the main economic dominant species, suggests its habits, reproduction, growth, feeding and monitoring the waters of the marine environment and other related complexes, specific reasons to be further studied.
5. Outlook
This challenge is further complicated by different types of uncertainty about how ecosystems function and how these processes manifest themselves in the natural resources protected by an MPA. Setting conservation targets is a form of prediction, in which an outcome is hypothesised to occur as a result of a management decision. Uncertainty weakens the precision with which predictions can be made about both the magnitude and the timing of the outcome. Natural sources of uncertainty, which routinely affect fundamental aspects of the structure and function of Pacific coastal ecosystems, may interact with anthropogenic changes to complicate target setting and evaluation. As the survey data limitations, this article is only a preliminary study of the species composition and abundance distribution amount four seasons, and fish resources survey should be long-term, continuous, community interannual variability, from a more macro perspective by comparing changes in the community, which can provide a more comprehensive understanding of marine fish community survey. The careful, science-based design of realistic objectives and targets, combined with a rigorous approach to monitoring the status of protected resources, will facilitate the establishment of MPAs and allow for their ongoing adaptive management as environmental conditions, external threats and conservation needs change over time. In the case of the Nanji Islands Marine Protected Area, no specific proposals or measures have been put forward in this paper. Future research should focus on determining the spatial and temporal generality of environmental and human impacts, as well as their relative importance in disturbed/undisturbed reefs, in order to fully understand the implications of these patterns. It is likely that a strict decision-based framework applied from a scientist’s perspective (i.e. minimising Type I error) will be too conservative to be acceptable to managers, unless they are charged with precautionary management.
Acknowledgements
Warm thanks are addressed to Pr. Wang Yingbin for this support and guidance to finish this manuscript at Zhejiang Ocean University, China, and to Dr. Ousmane Ndiaye from Assane Seck University of Ziguinchor. Thanks are expressed to National High School of Agriculture Iba Der Thiam University and Oceanographic Research Center of Dakar.