SARS-CoV-2 Antibody Seroprevalence in Children and Workers from Belgian French-Speaking Primary Schools ()

1. Introduction
In 2020, the rapid spread of a new coronavirus disease (COVID-19) due to a new virus, the severe acute respiratory syndrome coronavirus 2 (SARS-CoV-2), led many countries to take preventive measures to limit the virus spread. Because it can occur before the first symptoms of the disease or even without symptoms, the control of this pandemic was particularly complex. Many countries decided to close schools, disrupting the scholarship of about 1.57 billion students (91%) worldwide [1] . However, there was a lack of evidence on the role of young children in schools in the SARS-CoV-2 spread [2] .
A first study in Iceland showed that the incidence of SARS-CoV-2 infection was lower in children below the age of 10 [3] . Preliminary results within primary schools in France indicate that transmission occurred mainly at home. Infection was most often mild or asymptomatic in young children [4] . Symptoms severity plays an important role in the infectiousness degree and the asymptomatic person appears to contribute less to the SARS-CoV-2 transmission [5] . As the majority of children appeared asymptomatic, their contributions to transmission in society can be lower [6] . Some countries didn’t close their schools, but maintained strict protective measures. Their results pointed out that transmission in primary schools was limited [7] [8] [9] .
Many consequences of the pandemic such as school closures and lockdowns can have a significant impact on children’s development, independently of SARS-CoV-2 risk. An American study analyzed the effects of previous pandemics on children, and nearly a third of them showed symptoms of post-traumatic stress disorder [10] . Previous school closures have shown that students who do not attend school for a long period are more likely not to return once schools reopen [1] . More recently, other studies showed that the physical, mental, and social well-being of children, as well as their scholarship, are affected by school closures and reactional activities, especially those with disadvantaged backgrounds [11] [12] [13] . In addition, interruption of social contact and other preventive measures has catastrophic consequences for children’s well-being including domestic violence [14] .
We investigated whether SARS-CoV-2 antibody seroprevalence was as high in children as in school staff, whether it was related to the local SARS-CoV-2 incidence, whether seroprevalence was related to the school size, and whether seroprevalence was higher in disadvantaged background.
2. Methods
2.1. Study Design and Population
A prospective, non-interventional study, named DYNAmic TRAnsmission of Coronavirus in Schools (DYNAtracs), was conducted from January 14th to May 18th 2021 in primary schools of the Federation Wallonia Brussels in Belgium.
Schools were selected using purposive sampling to build the sample according to three inclusion criteria (Table 1). These three criteria were based on three surrogate markers.
The first surrogate marker was the local level of SARS-CoV-2. We wanted schools in low-infection areas as well as high-infection areas. The local level of SARS-CoV-2 was reflected by the cumulative incidence of SARS-CoV-2 during the first wave on May 6th 2020 in Belgium, based on data from the Belgian public health institute, Sciensano [15] . The median of data was used as a cut-off to define a low or high incidence area. A region/city with a low SARS-CoV-2 incidence corresponded to an incidence strictly below 5.0 per 1000 persons. A region/city with a high SARS-CoV-2 incidence corresponded to an incidence equal to or greater than 5.0 per 1000 persons.
The second surrogate marker was the number of social contacts within schools. A low or high number of social contacts in a school was substituted by the school size. The cut-off for a small/large school size was based on the estimated maximum total number of children in Belgian primary schools. A school was considered small when its size was below the first tertile (<230 children). A school with more than 230 children was defined as large.
![]()
Table 1. Schools according to 3 inclusion criteria.
The third surrogate marker was the disadvantaged background of children. The disadvantaged background was substituted by a low socioeconomic status (SES) of the school. In Belgium, all schools are classified on a 20-point scale index called SES. This SES aggregates the average data of all students and is calculated with 7 variables of the child’s household over 7 years: the median of the household income, the proportion of people in the household with a superior education degree, the proportion of people with a nursery or primary school degree, the proportion of people with a job, the proportion of persons with social assistance, the proportion of people with manual work and the proportion of people working in the lowest level of the tertiary sector. More specifically, individual values are collected for each child. Then, an aggregation of individual variables by school implantation, institution, and statistical sector of residence is performed. The mean and standard deviation are computed and each variable is standardized to have a mean of 0 and a variance equal to 1. Principal component analysis is performed on the correlation matrix to extract loadings for each of the 7 variables for calculating the first principal component, which is SES [16] .
i = school implantation;
j = variable number;
Cj = loading of the first principal component,
which allows to weight of the contribution of variable number j.
Aj = mean of the variable across schools;
Bj = standard deviation of the variable across schools.
According to this index, a value lower or equal to 7 (the first tertile) was defined as a low SES and a value greater or equal to 13 (the upper tertile) was defined as a high SES.
The two levels of each of the three criteria led to defining eight strata for sampling schools within each stratum.
Schools were selected in each stratum, with the help of two administrations in charge of health at school, ONE (“Office de la Naissance et de l’Enfance”) and PSE (“Promotion de la Santé à l’École”). Principals of selected schools were contacted to participate in the study.
In that case, they sent us a list with the number of children per class and the number of workers. A box per class was then prepared for parents with flyers and an informed consent to sign. Flyers were translated into languages requested by the principal: Arabic, Italian, Romanian, and Turkish. All children (6 - 12 years) and all staff were invited to participate and received a consent form to sign.
In parallel, principals, teachers, and parents were invited to take part in a videoconference.
A website was also created (https://www.sesa.ucl.ac.be/Dynatracs/) where parents could consult the information about the study. It contained the study protocol, videos explaining the two testing procedures and flyers translated into different languages.
Participants were enrolled in the study if the consent was signed by both parents and the child or by the staff.
In each school, the principal collected these signed forms within the week, and individual anonymized identification numbers were generated according to these lists of participants. The school location, the school calendar, the protective measures at the time of the study, and the government measures to limit the virus transmission were considered in the planning and field study organization (Figure 1).
Each school was visited six times. Each participant was tested by a rapid serological antibody test by finger prick only at inclusion. A saliva antigen test of SARS-CoV-2 was performed in the first week and repeated the following ones. Each week, the participant filled in a face-to-face questionnaire about possible COVID-19 exposure and with demographic factors at inclusion. Each child received a notebook where he/she wrote down the exposure risk during the study period and answered a well-being questionnaire during this SARS-CoV-2 pandemic. Teachers and principals filled in different questionnaires regarding protective measures set up in the school. Each test and questionnaire was identified by the participant’s anonymized code during the entire study.
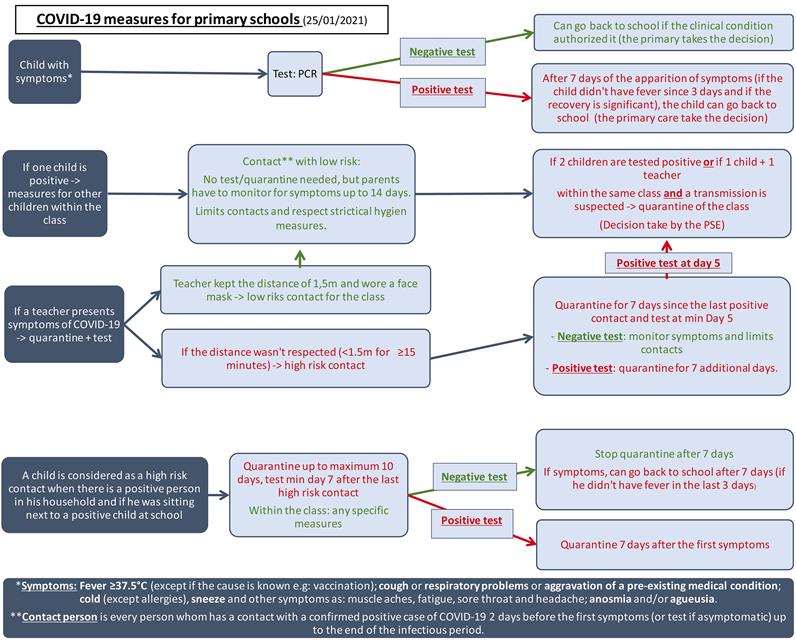
The Belgian concertation committee had provided some protective measures for schools when children showed symptoms or tested positive. When a child tested positive, the parents were asked to warn the school and to isolate the child for a period of quarantine. When two children tested positive within the same classroom, the classroom was closed and all the children were asked to stay at home for a quarantine period (see Additional file 1) [17] [18] .
![]()
Figure 1. Calendar for the study organization. Green zone: study period within the school; red zone: school vacations, closing period, or study break; black cross: end of the study for the school.
2.2. Study Registration
Human data were performed in accordance with the Declaration of Helsinki. The protocol, informed consent forms, and questionnaires were approved by the Hospital-Faculty Ethics Committee Saint-Luc (“Commission d’Ethique Hospitalo-Facultaire des Cliniques Universitaires Saint-Luc”)—UCLouvain, approval number: 2020/16NOV/552.
2.3. Technical Procedures
The presence of antibodies for SARS-CoV-2 was evaluated by using the Novel Coronavirus test, a lateral flow test antibody immunoglobulin M/G (IgM/IgG) assay (colloidal gold) (Avioq) (AVIOQ, Bio-Tech, Shandong, China) CE-labeled. Sensitivity for IgM/IgG was 68.8% (95% CI [60.3% - 76%]) and specificity was 95.8% (95% CI [88.5% - 98.6%]) [19] . Two blind and independent readings by two different experts were performed on the lateral flow test antibody. In the case of discordance, a third reading was carried out by an expert supervisor, and his reading was considered the final result.
A saline mouth gargle sample was performed to collect the saliva. This method showed a sensitivity of 98% to detect SARS-CoV-2 by Polymerase Chain Reaction (PCR) compared to nasopharyngeal swabs [20] . Saliva was extracted by using the MagMAX Viral/pathogen Nucleic Acid Isolation kit on a KingFisher automated platform (ThermoFisher). An unbound MS-2-phage ribonucleic acid (RNA) sequence was added to each sample to show the efficiency of the process. Purified RNA was retro-transcribed and amplified on a QuantStudio5 real-time PCR platform with the TaqPathTM COVID-19 RT-PCR kit (ThermoFisher) that targeted the ORF1ab, N, and S coding sequences by utilizing three different primers and probes sets.
2.4. Data Analysis
Participation of children and staff is reported as number and proportion. Pearson’s correlation (r, [95% CI]) was used to assess the relationship between participation or seroprevalence of children and staff, incidence level of SARS-CoV-2 within the school area at inclusion, school size, and socioeconomic status.
SARS-CoV-2 seroprevalence was calculated for each school based on positive IgG. The local cumulative incidence of SARS-CoV-2 was defined as the ratio between the cumulative cases reported by Sciensano for the area and the population number from national demography [15] . Seroprevalence among children and staff, as well as the communal cumulative incidence of SARS-CoV-2, are reported per 1000 persons. The cluster effect between classes within schools was assessed using the Pearson intraclass correlation coefficient (ICC).
Data analysis was performed with R 4.1.2.
2.5. Spatial Distribution
The spatial distribution of participation and seroprevalence in children and staff across Belgium has been performed using the ArcGIS program 10.8 version.
3. Results
Among the 8 schools initially selected, 2 schools were excluded from the study because of a refusal from the principal in one and a high refusal participant rate (up to 40%) in the other. Five additional schools were then proposed, leading to 11 schools enrolled in the study (among 13 invited schools). Additional analysis was conducted to document the low participation.
From these 11 schools, 1174 individuals participated in the study, including 932 children and 242 staff.
3.1. Participation in the Study
The global participation rate was about 37.5% for children (932/2488) and 54.5% for staff (242/444) (see Additional file 2 for more details).
Participation of children was positively correlated (r = 0.33; 95% CI [−0.34; 0.78]) with the participation of staff.
The participation was higher in areas with a lower incidence level of SARS-CoV-2 at that time (children: r = −0.17; 95% CI [−0.70; 0.48]; staff: r = −0.52; 95% CI [−0.85; 0.11]).
Participation in children and staff was negatively correlated with the school size (children: r = −0.39; 95% CI [−0.80; 0.27]; staff: r = −0.50; 95% CI [−0.85; 0.15]); the bigger the school the lower the participation rate.
Participation among children was lower (<50%) in schools with a lower socioeconomic status (SES ≤ 7) (r = 0.81; 95%CI [0.40; 0.95]), but among staff, there was no relationship between participation rate and SES (r = 0.05; 95% CI [−0.56; 0.63]) (Figure 2).
![]()
Figure 2. Participation of children and school staff according to the socioeconomic status. The participation of children and school staff is represented by percentages (%). Socioeconomic status (Belgian 20-point-scale SES index) is represented from 1 to 20. The two extremes value, ≤7 and ≥13 are represented by the two blue dashed lines. The correlation between participation and the socioeconomic status of the school is represented by the black lines. Schools are represented by a colored dot.
3.2. Seroprevalence in Children and Staff
There was 10.3% of discordance between the double-blind readings of the SARS-CoV-2 lateral flow antibody test, and there were 12 cases with negative IgG but positive IgM that were considered as negative in our results.
Out of 1174 participants, 1162 serological tests (6 unreadable and 6 missing) were performed throughout all schools (see Additional files 3 and 4 for more details). 20.7% of children (191/922) and 25.4% of staff (61/240) were positive for IgG.
Seroprevalence and participation in the study are represented geographically specifically for children and staff (Figure 3). In the different schools (Figure 3 and see Additional file 5 for more details), the rate of children with antibodies was highest around Brussels and Farciennes. But in staff, the positivity rate was highest in Brussels, Herve, Beauraing, and Farciennes.
Seroprevalence in children was higher in schools where the seroprevalence in staff was high (r = 0.33; 95% CI [−0.34; 0.77]).
Between schools, the seroprevalence was comparable (p-value = 0.17). We obtained a weak intraclass coefficient correlation (children: ICC = 0.08; children with staff: ICC = 0.12).
Seroprevalence in staff (Figure 4) was slightly associated with local cumulative incidence (r = 0.26; 95% CI [−0.40; 0.74]), but there was no correlation in children (r = 0.06; 95% CI [−0.59; 0.67]). Seroprevalence in children and staff is generally above the dotted line, meaning that most of the estimated seroprevalence was higher than the communal cumulative incidence at the time of the study.
![]()
![]()
Figure 3. Geographic representation of participation and seroprevalence of children and school staff in Belgium. Participation (n total) is represented by the circle size. Seroprevalence (n IgG+/n total) in children and school staff is represented by the blue color scale.
![]()
Figure 4. Seroprevalence in children and school staff according to communal cumulative incidence. Seroprevalence (IgG+) in children, school staff, and communal cumulative incidence are reported per 1000 persons. The identity line is represented by the black dashed line. Schools are represented by a colored dot.
Seroprevalence in children and staff was lower in larger schools (≥230 children) (children: r = −0.63; 95% CI [−0.89; −0.04]); staff: r = −0.28; 95% CI [−0.76; 0.38]). Seroprevalence in staff (Figure 5) was higher in schools with a high socioeconomic status (SES ≥ 13) (r = +0.37; 95% CI [−0.29; 0.79]), but it wasn’t correlated in children (r = −0.10; 95% CI [−0.66; 0.53]).
4. Discussion
4.1. Participation in the Study
Children’s participation in the study was lower than expected and may be partly explained by the problem of the recruitment period, which occurred during the lockdown. Reaching parents and children was difficult, resulting in misunderstandings and fears about the study. The two excluded schools because of a low participation rate had also a low socioeconomic status. Some parents did not speak French, and even if we translated flyers into different languages, they refused to let their children participate. The consent form was the only way to inform parents in detail about the study, but it was written in complicated terms as requested by our ethical committee and led to some fears.
Most parents expressed their refusal to let their child participate, using arguments that showed a lack of understanding of how the study was being conducted (e.g. “we do not want our child to be vaccinated”). Investigators tried to explain the study process in simple terms, suitable for the general population, to reluctant parents. Some parents subsequently agreed to their child’s participation, others did not.
![]()
Figure 5. Seroprevalence in children and school staff according to the socioeconomic status. Seroprevalence (IgG+) in children and school staff is reported per 1 000 persons. Socioeconomic status (Belgian 20-point-scale SES index) is represented from 0 to 20. The two extremes value, ≤7 and ≥13 are represented by the two blue dashed lines. The correlation between seroprevalence and socioeconomic status is represented by a black line. Schools are represented by a colored dot.
Participation of children was higher in schools where staff participation was high. The only person available to explain the study simply was the teacher or the principal. When the teacher was motivated to participate, children were perhaps more motivated to participate. Staffs were mostly motivated to participate in every school. Not every worker could be present on the day we conducted the test, which may explain some refusals. Adherence to the study to know the presence or absence of antibodies to the SARS-CoV-2 virus was one of the reasons that motivated staff members to participate. Contrarily, of those who had been infected by COVID-19, some did not wish to participate because they already knew the presence or absence of antibodies.
In the protocol, we decided to establish three inclusion criteria to select schools. One was the incidence level of SARS-CoV-2 based on May 6th, 2020. When we computed the participation according to the incidence level of SARS-CoV-2, we estimated the incidence based on the inclusion day. Participation of children and staff was higher whereas the incidence level of SARS-CoV-2 was lower. The fear of the virus can explain the lower participation where the incidence was higher.
Participation of children and staff was lower in large schools. Small schools are known to have more social contact and therefore, as children and staff participated, others were more inclined to participate.
Children’s participation was the lowest (<50%) in schools with low socioeconomic status (SES ≤ 7), but it wasn’t true for staff. The socioeconomic environment seems to influence children’s participation. Although we needed written consent from children and parents, the information should be more accessible and understandable, with simple terms suitable for children and parents. Every staff didn’t come from the same area. SES was calculated for every child within the school and children usually come from the same area as the school. As a result, the socioeconomic status and the participation of staff were not correlated.
A low socioeconomic status shows that the different variables that decrease this index are more important in these schools. The different variables that decrease the socioeconomic status of schools are the proportion of people with a nursery or primary school degree, the proportion of persons with social assistance, the proportion of people with manual work, and the proportion of people working in the lowest level of the tertiary sector [16] .
One of the variables concerns the abstention of social assistance, to determine socioeconomic status. In Belgium, the CPAS (“Centre Public d’Action Sociale”) is a social assistance that aims to ensure the right to social integration for people who do not have sufficient income. To benefit from this social assistance, the person must meet the six legal conditions, which are: Belgian nationality, permanently living in Belgium, being of legal age, insufficient resources, willingness to work, and having used up all the different social rights (the CPAS only operates as a last resort) [21] .
4.2. Seroprevalence in Children and Staff
SARS-CoV-2 seroprevalence in staff was higher than in children, with 25.4% and 20.7% respectively. Seroprevalence among children was higher in schools with high seroprevalence among staff. The weak intraclass coefficient correlation suggests that seroprevalence didn’t present a classroom cluster. The classroom size did not appear to have an impact on the SARS-CoV-2 seroprevalence among children in this study. Similar results were obtained in the PCR analysis. The most positive samples came from isolated cases and did not lead to clusters or increased cases [22] .
An initial study in Iceland showed that 6.7% (38/564) of children under 10 years of age tested positive for SARS-CoV-2, compared to 13.7% (1183/8635) of individuals older than 10 years [3] .
In England, a study in primary schools reported a seroprevalence of 11.2% (91/816; 95% CI [7.9; 15.1]) in children and 15.1% (209/1381; 95% CI [11.9; 18.9]) in staff. The weekly transmission of SARS-CoV-2 in children was 4.1 per 100,000 persons (12.5 in adults) [23] . A prospective cross-sectional study analyzed infection clusters and outbreaks in staff and students. Staff had a higher incidence than children and the risk of an outbreak increased by 72% for every 5 cases per 100,000 in community incidence [24] . Children appear to be more likely mild or asymptomatic and then are less being tested for the virus [23] [24] .
In another small study conducted in a Belgian primary school, 20.6% (13/63; 95% CI [10.6; 30.6]) of children tested positive with a throat washing sample, and the majority of them were asymptomatic. In that study, seropositivity in adults was 27.1% (32/118; 95% CI [19.1; 35.7]), also higher, as in our results [25] .
COVID-19 had often a milder course with a better prognosis in children than in adults, and deaths were exceptionally rare in children [26] [27] [28] . The difference between adults and children developing COVID-19 remains unexplained, even if immunity and innate responses may play a role [29] [30] [31] . Children can develop an immune response to the virus without virologic confirmation of SARS-CoV-2 infection, suggesting the possibility that immunity prevents the onset of SARS-CoV-2 infection [32] .
Children less than 10 years old were estimated to be significantly less infected by SARS-CoV-2 [33] . It seems important to make a distinction between children and adolescents, as the results do not appear to be entirely similar. Several studies have shown that seroprevalence in children and adolescents would differ.
Two Belgian studies compared seroprevalence in Belgian primary schools to secondary schools. In the first study, 6.6% (95% CI [1.2; 12.1]) were seropositive in primary schools compared to 12.2% (95% CI [7.2; 17.1]) in secondary schools [34] . The second study performed this comparison over 3 periods: from December 2020 to January 2021, in March 2021, and from May to June 2021. Seroprevalence was comparable in both groups but lower in primary schools. Seroprevalence was: 11.0% (95% CI [7.6; 15.9]) in primary schools versus 13.6 (95% CI [9.9; 18.5]) in secondary schools, 17.1% (95% CI [13.3; 21.9]) in primary schools versus 18.0% (95% CI [13.6; 23.8]) in secondary schools for the second period; 15.4% (95% CI [12.2; 19.6]) in primary schools versus 17.2% (95% CI [13.1; 22.7]) in secondary schools for the third period [35] .
4.3. Seroprevalence and Local Cumulative Incidence
During the study, only healthcare workers or people aged over 65 had access to COVID-19 vaccination in Belgium. COVID-19 vaccination in Belgium for the general population (over 12 years of age) began in June 2021, after the end of the study [36] .
Throughout the lockdown period, investigators worked closely with the local health promotion teams and schools. Before, during, and after the study, the local physicians provided data concerning infected children and staff. Specific measures against COVID-19 were set up for primary schools (see Additional file 1 for more details) [17] [18] .
Previous studies reported that children do not appear to play a major role in the transmission of SARS-CoV-2. [3] - [9] Results of our study show that the seroprevalence among children and staff within schools was higher than the incidence of COVID-19-positive cases in the area, because the communal cumulative incidence was underestimated. At the beginning of the pandemic in Belgium, only people with severe symptoms (e.g. temperature ≥ 38˚C) were tested. All possible contacts in adults were tested after mid-June 2020 [17] .
The lateral flow test that we used during our study had a sensitivity of 68.8% and a specificity of 95.8% [19] . The positive predictive value is expected to be high, but we have no way to estimate the seroprevalence itself.
The serological test in children and staff was operated at inclusion but a second test one week after was not allowed per protocol, so positive IgM with negative IgG couldn’t be assessed for new infections.
The presence of antibodies reflects a previous virus infection/contact. It doesn’t show the actual number of persons with SARS-CoV-2 infection at that time. This might also explain why seroprevalence in children wasn’t correlated to the local cumulative incidence.
4.4. Seroprevalence and School Size
School size was considered as a way to evaluate social contact in children, which is an important factor in virus transmission [6] . The findings suggest that SARS-CoV-2 antibody seroprevalence was lower in larger schools, both in children and staff. These results suggest that close contacts are maybe more important in small schools, even if number of contacts is expected to be higher in larger schools.
4.5. Seroprevalence and Socioeconomic Status
Seroprevalence in staff was higher in schools with high socioeconomic status, and seroprevalence wasn’t correlated with SES in children. The first reason is that SES is calculated from children’s data and not from staff data. Another reason is that most teachers and staff live outside the local area. For children, seroprevalence didn’t correlate with socioeconomic status as opposed to participation rates that were highly correlated with SES.
5. Limitations
Our study has some limitations. Study information was only provided in paper forms with complicated terms and maybe not adapted to the general population, leading to low participation. Recruitment was made thanks to principals because of the restriction distance measures at that time. Distance recruitment increased the misunderstanding of parents and children about the purpose of the study.
Seroprevalence was only analyzed at the beginning of the study, based on the protocol. A comparison between the beginning and another time point during the study would allow us to analyze the evolution of the situation, but also during the different measures taken at that time against COVID-19.
Another limitation is that the SES is linked to a school and not a child; we don’t know if all participant children from low-SES schools are living in poverty or not.
Nevertheless, our results are consistent with other studies.
6. Conclusions
Our main findings are that children from schools with low socioeconomic status were less allowed to participate. Children had a lower seroprevalence than staffs and there was no classroom cluster, suggesting that they are not SARS-CoV-2 transmitters. Our results strongly suggest that information strategies have to be more oriented to low socioeconomic status to increase their participation in disease control. The well-being and mental health of children should be at the center of our decisions to limit further consequences in their development and scholarship. Data on the virus infection and transmission are important for decision-making to control the disease while considering the numerous consequences that may result from these decisions.
Children have been and are still being strongly affected by the COVID-19 pandemic. Understanding SARS-CoV-2 transmission in schools could limit the long-term consequences on children’s scholarship, development, and well-being. Taking socioeconomic status into consideration is an important notion to analyze the virus transmission as the pandemic has reinforced social inequalities. By integrating all the lessons learned from this pandemic, we will be better prepared to deal with future health problems.
Acknowledgements
The authors wish to express their sincere gratitude to the participants and the participating schools who made this study possible.
Compliance with Ethics Guidelines
This study was carried out in accordance with relevant guidelines and regulations (e.g. the Declaration of Helsinki). The protocol, informed consent forms, and questionnaires were approved by the Hospital-Faculty Ethics Committee Saint-Luc (“Commission d’Ethique Hospitalo—Facultaire des Cliniques Universitaires Saint-Luc”)—UCLouvain, in Brussels, approval number: 2020/16NOV/552. It was registered on clinicaltrials.gov on 16/09/2021, identifier number: NCT05046470, and on ISRCTN on 20/04/2022, identifier number: ISRCTN16837012. Written informed consent was obtained from all participants before participation and/or from their legal guardians.
Funding
This work was supported and funded by the Federation of Wallonia Brussels. The study funder was not involved in the study design, data collection, data analysis, data interpretation, or in the report writing.
Additional_File_1
Additional_File_2
![]()
Table A1. Participation of children and school staff by school.
Participation of children and school staff are represented by the participants’ number and percentages, n (%). Number of children and school staff designates the total number presents in the school. PC: postcode.
Additional_File_3
![]()
Figure A1. Flowchart: flow participant during the study. Children and school staff flowchart who participated in a rapid serological test by finger prick (AVIOQ®). Children flow chart is on the left and school staff flow chart is on the right. No-answer indicates a person who did not return the written consent with a “Yes” or a “No”. Inclusions designates a person who decided to participate after the 1st day of inclusion within the school. Withdrew specifies a person who no longer wanted to participate or the AVIOQ result is missing/unreadable.
Additional_File_4
![]()
Table A2. Frequency of serological tests.
Frequency of serological tests in children and school staff. ++: IgM+ IgG+; −+: IgM− IgG+; +−: IgM+ IgG+; −−: IgM− IgG−, Unreadable: result was unreadable.
Additional_File_5
![]()
Table A3. Frequency of serological tests by school.
Frequency of serological tests in children and school staff. ++: IgM+IgG+; −+: IgM− IgG+; +−: IgM+ IgG+; −−: IgM− IgG−, Unreadable: result was unreadable. PC: Postcode.
NOTES
*Corresponding author.
#These authors shared last authorship.