Drug-Treatment Generation Combinatorial Algorithm Based on Machine Learning and Statistical Methodologies ()
1. Introduction
For obtaining optimized patient-specific treatment strategies, we conduct three experiments based on patients’ historical treatments and charted features across multiple time-stages. We name the experiments as Distance, Clustering, and Distribution experiments based on supervised learning, clustering techniques, and a statistical Kolmogorov-Smirnov test respectively1. Here the time-stage is a key logical component representing the health state of the patient. Each patient in each state has a corresponding vector of 10 features, which give an overview of the health condition of the patient. We first create treatment stages based on time. We define three time-stages, meaning optimal groups are identified three times for each patient per method. We believe this division is important as identifying the optimal drug is highly dependent on the stage where the patient is located; in other words, giving the same drug in the first time-stage and the third time-stage only based on the observed features may not provide the desired results. The third time-stage features may be affected by previous medication, and the same treatment may be effective at the earlier stages and not so effective at later stages, and vice versa. For each new patient that is admitted with a given diagnosis, the initial health state (group of features) is observed. The optimal drug sequences (group) of drugs are chosen from an existing pool of drug treatments from previous admissions based on the defined methodologies, where in the end the patient has been successfully discharged to Home, which we regard as a positive outcome. As the patient’s treatment progresses in time, another group of optimal drug medications is identified from the corresponding time-stage of the existing treatment and so on. There are five methods used in total for identifying the optimal medications; two of them are clustering algorithms; KMeans and Mini Batch KMeans, the other two are machine learning evaluation metrics which we use for similarity calculation, MSE and MAE, and the final one is a statistical Kolmogorov-Smirnov test for identifying if the distribution of the features of the admitted patient is the same as a given distribution from the existing historical patient features. After finding out the optimal group of drugs for each stage, a combination strategy is used, which is a product-based combination. For i distinct group of drugs in stage 1, j such group in stage 2, and k such group in stage 3, we obtain
combinations, which becomes a drug treatment dataset. Each instance of this dataset is evaluated against a target label, which is 1 if the patient has been discharged to Home, and 0 otherwise. The label is known for all patients, for both historical and new admissions. We utilize a small feedforward neural network (FNN), which is a linear layer followed by a sigmoid activation, for identifying how well on average the combined group of treatments across stages predict the final patient output. The prediction results can also be used for selecting the best overall treatment procedure. The approaches are evaluated on datasets for the PNEUMONIA diagnosis. The evaluation results show that the model is learning, however, limited dataset observations and class imbalance should be handled as part of future work. In summary, the contributions that the paper provides are:
· An algorithm for selecting the most similar patients in terms of the observed medical features for each time-stage using five different machine learning and statistical methodologies.
· Logic for generating drug-treatment datasets using product-based combinations for each patient using medication of the most similar patients identified from one of the methodologies.
· Methodological evaluation.
2. Related Work
In this work, we use machine learning and distance-based methodologies for combining drug sequences over multiple stages for optimized treatments, and for that reason, we review the literature where drug combination approaches have been used for treatment optimization. One such area is cancer treatment. Although drug combinations can improve cancer treatment efficacy, and provide side effect reduction and drug resistance, combining drugs is a difficult task for the high number of possibilities that exist. Another challenge is that drug combinations may result in synergistic, additive, or antagonistic interactions between drugs stated by [1] , who apply a feedback system control technique with a population-based stochastic search algorithm to traverse through the parametric space of nine angiostatic drugs at four concentrations to identify low-dose drug combinations. An Iterative approach of in vitro testing and algorithm-based analysis is performed. Synergy is when two drug components increase each other’s effectiveness by more than the sum of their single-agent responses. The advantage of synergy is that allows to lower the dosage of individual agents, allowing to reduce toxicity but still maintaining the desired effect. The additive is when the effect of one drug neither reduces nor increases the effect of the other drug. Finally, a drug combination is antagonistic when the combined activity of the drugs is lower than the response of the individual agents [2] [3] . There is also a concept of independent drug action alternative to drug synergy. Cell-to-cell heterogeneity within a patient as well as cell-to-cell variability in drug response makes it challenging to predict the effectiveness of the treatment. Combinational drug treatment has been used for overcoming this challenge for the reason that at least one of the drugs may provide the desired effect. This is also known as ‘independent’ action and is defined as the response of the patient to the combination therapy equivalent to the response of the more effective drug alone with no added benefit from the less effective drug [2] [4] . In fact, by analyzing available clinical data, and comparing monotherapy and combinational therapy, it is concluded that the most positive outcome observed in patient treatments is due to independent action [4] [5] . There exists a Quadratic Phenotypic Optimization Platform (QPOP), an artificial intelligence (AI) approach that utilizes experimental drug response datasets for identifying globally optimal drug combinations, which uses orthogonal array composite design (OACD) for generating a minimal set of drug combinations sufficient for second order model fitting. In their work, [6] provide a more efficient OACD that can be applied toward AI-driven drug combination design in drug development and precision medicine. For developing optimal treatment intervention and planning for breast cancer patients, [7] develop a Markov decision process (MDP) based framework with intervention and treatment costs, data-driven intervention, and treatment actions. State space is a vector of age, health status, prior intervention, and treatment plans, and the actions are wait, prophylactic surgery, radiation therapy, chemotherapy, and their combinations. A recursive classification framework with potential applications in medical treatment optimization is proposed by [8] . Regarding healthcare data, there are many types, such as Clinical Data, Sensor Data, Omics Data, Genomic Data, Transcriptomic Data so on [9] . In this work we deal with Clinical Data, a type of data which is collected during the ongoing treatment of the patient. There are multiple use cases where machine learning has been applied to clinical datasets. ML algorithms for the prediction of pathological complete response (PCR) to neoadjuvant chemotherapy and survival outcome of breast cancer patients are proposed by [10] . In this study eight classifiers, among which are logistic regression, random forests, adaptive boosting are applied to rank the features for PCR including residual cancer burden (RCB), Recurrence Free Survival (RFS), and disease-specific survival DSS. [11] propose an improved classification approach for survival prediction of Hepatocellular Carcinoma (HCC) patients. For identifying Type-2 Diabetes Mellitus (T2DM) patients using Electronic Health Record (EHR) data, a new framework is proposed by [12] . [13] used machine learning models for the identification of high-risk surgical patients. Meanwhile, [14] investigate five machine learning algorithms, including an artificial neural network with a single hidden layer for delirium risk prediction based on electronic health data. Other use cases of machine learning include survival prediction by [15] , heart failure prediction by [16] and cardiovascular risk prediction by [17] . There are a few cases when combinatorial techniques have been applied in the healthcare domain. [18] propose an original procedure based on combinatorial K-Means clustering designed to find the most appropriate clinical variables to efficiently separate similar patients into groups diagnosed with diabetes mellitus type 2 (DMT2) and underlying diseases. [19] use combinatorial optimization for dataset creation, used for diet planning and dietary healthcare with machine learning. [20] introduce a machine-learning-based prediction model capable of optimal treatment selection for hepatitis C virus (HCV). For effective allocation of medical resources in intensive care units, [21] train regression models using MIMIC-III database for solving a discharge prediction task.
3. Materials and Methods
3.1. Data
Experiments are conducted using three different datasets namely Drugs, Features, and Output generated for each time-stage, having shapes of (n, 902), (n, 10) and (n, 1) in the mentioned order, where n is the number of admissions. These datasets are obtained from preprocessing four tables from MIMIC-III clinical database, namely ADMISSIONS, D_Items, and PRESCRIPTIONS datasets, and a subset of the CHARTEVETS dataset, the latter containing 5 million rows from the whole dataset. The features are O2 saturation pulse oxymetry, Heart Rate, Respiratory Rate, Non Invasive Blood Pressure mean, Non Invasive Blood Pressure systolic, Non Invasive Blood Pressure diastolic, Temperature Fahrenheit, Arterial Blood Pressure systolic, Arterial Blood Pressure diastolic, Arterial Blood Pressure mean. The Drugs dataset is in a dummy format where each drug is present as a column and for a given row takes values of 0 or 1, 0 indicating the presence and 1 the absence of a drug for a given diagnosis in a given stage. Each instance (row) for the Drugs dataset for each stage is the group of drugs given to the patient. The Features dataset is used for comparing the newly-admitted patient features with existing historical patient features at each stage, identifying the “best” or most similar patient ids then selecting their drug treatments, which is the corresponding instance from the Drugs dataset.
3.2. Stages (Timesteps)
Data is divided into three stages based on length of stay logic. Each stage includes aggregated historical charted observations for 10 features and a list of drug treatments for each patient. The first and second stages include 2-day observations, while the final stage can have from 2 to 4-day observations. There are three distinct methodologies used as part of the main experiment, which can be described as data-driven. The base idea among all methodologies is to find the treatment sequence for a given testing instance from the training instances based on existing feature similarity. How similarity is obtained is described in the following sections. Train-test division (3.3) and batch selection (3.4) are done before the actual methodology is performed.
3.3. Train Test Division
We perform a data division for each stage and name it “train-test”, where observations from “test” are the instances for which even though we know the actual treatments (drug sequences), we rely on the historical treatments from training instances to generate new potential procedures. We also know the output label of each testing instance, which is later expanded to match the concatenated dataset size described in section (3.8). This is not a train-test division in the traditional machine learning terminology, but rather a division of past and current admissions and treatment. The key part here is understanding which training instances are the best for a given test instance, so the best drug procedures can be selected. 70% of the observations from each stage are kept as training instances and the rest as testing instances.
3.4. Batch Selection
Training instances for each stage are further filtered before being compared to a testing instance for similarity. The logic of filtering is that if the training instance has a corresponding output of 1 from the Output dataset, meaning the patient has been discharged to Home, the instance has had a good drug prescription sequence over multiple stages. The training instances are filtered based on this logic and for each stage, we end up with training observations or patient observations that have been discharged to Home.
3.5. Distance-Based Approach
3.5.1. Supervised Learning Experiment
The distance-based approach assumes similarity calculation between each testing instance with all training instances. The naming, just like train-test division, is for experimental purposes, the actual approaches are conventional machine learning evaluation metrics for calculating the loss between training and testing vectors. Two metrics are used, MSE and MAE. Using these metrics, we select the ids of the five most similar training instances. The ids are selected so that the corresponding drug treatment sequences can be taken, as elaborated on in the Data (3.1) section.
3.5.2. Mean Squared Error and Median Absolute Error
Each training instance is regarded as the vector of ground truth values. Mean squared error measures the expected value of the mean quadratic loss while MAE measures the expected value of the absolute error loss [22] .
3.6. Clustering-Based Approach
3.6.1. Clustering Experiment
In the clustering experiment, we fit a clustering algorithm on the training data and then make a prediction, assigning each training instance to one of the three clusters using KMeans and Mini Batch KMeans algorithms. We do a similar prediction for the testing instances, assigning each instance to a cluster. We then proceed to iterate over the testing predictions (clusters), selecting all training instances that also belong to the same cluster, then selecting five training instance ids from this selection. Here, unlike the distance-based approach, there is no particular ordering for the selected training instances, meaning that all instances are equally important.
3.6.2. KMeans and Mini Batch KMeans
KMeans algorithm cluster data by trying to separate data into n groups of equal variance, minimizing within the cluster sum of squares. Mini Batch KMeans tries to optimize the same objective function as KMeans but uses KMeans to reduce the computation time [22] .
3.7. Distribution-Based Approach
3.7.1. Statistical Similarity Experiment
As a final approach to our experiment, we use a statistical Kolmogorov-Smirnov test (3.7.2) for selecting the best training instances for a given test instance. The way the training data selection takes place for each testing instance is quite similar to the experiment described in section (3.5). The difference is that we select the training instances based on how closely the feature distribution of the training instance matches one of the test instances based on the p value metric. The closer the value to 1, the more similar the distributions are. We then select the top five most similar training instance ids based on p value ordering from highest to lowest, which later are used for obtaining corresponding drug sequences. The experiment as in all previous experiments is performed for each diagnosis for each of the three stages.
3.7.2. Kolmogorov-Smirnov Test
We perform a two-sample Kolmogorov-Smirnov test for the goodness of fit, where we compare the underlying distributions of two independent samples, in this case, the training and testing samples. We test a two-sided null hypothesis that two distributions are the same for all x, and the alternative is that they are not identical [23] . We accept the null hypothesis if the statistical p value is greater than 0.05.
3.8. Drug Sequence Concatenation and Modeling
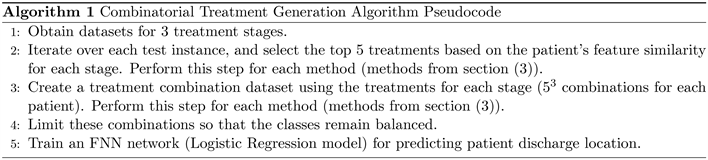
As a result of the experiments, for each patient, we obtain up to five treatment strategies for each stage based on each method. High-level pseudocode of the algorithm (5) is listed in the appendix.
Visualization of the methodology can be seen in Figure 1, where the identification of the top 5 treatments is done using the methods listed in section (3). The full treatment depends on sub-treatments, and as there are three stages and 5 treatments, for a single patient there can be 53 product-based treatment combinations. We gather all such combinations through the concatenation of drug sequences and generate five datasets, one for each method. With this methodology, we obtain a vast number of possible drug combination procedures for each patient. Regarding the output of these combinations, if the output label of a given testing instance is 0, all the concatenated drug treatments for that instance will have a label of 0. This is also true when the label is 1. The shape of each dataset is
, where n is the number of patients coming from the test
set for each diagnosis, and 902 is the total number of unique drugs.
Here an intersection of the row and the column represent whether the drugs were given during the treatment or not. The goal here is to find out how the combination strategy works in an effort to identify the best drug procedures and methodologies. The success of this strategy may also be used for recommending new treatment procedures which have a high likelihood of leading the patient toward a successful discharge. There is a significant class imbalance for each generated dataset, which have shapes of (2500, 902). Out of these 2500 observations, there are only 125 instances that have a positive target output of 1, the rest having 0. As the output is the same, these numbers are the same across all datasets. To tackle this issue, we identify the instances whose output is 0, filter the first 125 instances, and concatenate to the other 125 instances with the output of 1, obtaining a perfect dataset balance. Although the final dataset now has a shape of (250, 902), a significant decrease from the original, this method allows to better evaluate the proposed methodologies, and be confident that model performance is not affected by the class imbalance. The technique is applied to the datasets generated by each methodology. We perform 5-fold cross-validation, each fold selecting observations randomly from the dataset. We then construct a train loader to use for model training and a test loader for model evaluation. For each fold, we reset the model parameter weights. The model parameters can be seen from Table 1. We train a feed forward neural network with a sigmoid activation applied to a linear layer without any hidden layers, which becomes a logistic regression model. The benefit is that we use a neural network optimization pipeline instead of a standard statistical regression model. We try to keep the model as simple as possible so that good performance is attributed to the underlying approach rather than the complexity of the model.
4. Setting
The experiments and conducted in python using “scikit-learn” [22] , SciPy [23] , and “PyTorch” [24] machine learning libaries.
5. Results
We provide a visualization of the training results for each technique, as well as
testing evaluation results for Accuracy, Recall, and F1-scores. The training results can be seen from Figure 2 and the evaluation results can be seen from Table 2. From the figure, you can see that there are oscillations during the learning
![]()
Table 2. Average evaluation results across folds.
for mean_squared_error and median_absolute_error, which is also reflected in test predictions in the table. Learning is much smoother for KMeans, MiniBatchKmeans, and kstest approaches. By looking at the table, you can see that compared to distance-based metrics of mean_squared_error and median_absolute_error error, the models perform significantly well with clustering and distribution-based algorithms. Method names in the charts are based on external library function names, so there are some naming differences in comparison to the names listed in section (3).
6. Conclusion
In this work, we proposed approaches for obtaining drug combination treatment strategies suited for the multi-stage patient treatment task. We identified the importance of having a methodology that can identify the optimal group of drugs across multiple stages, then showed how some of the proposed combination approaches based on existing techniques successfully predict the discharge location of the patient. These approaches may help in finding combinations that have not been explored previously and suggesting alternative treatments, however, based on the dataset sizes and the experimental approach of the work, cautious evaluation of the obtained results is needed before a final drug-treatment recommendation.
7. Discussion and Limitations
Due to the algorithmic and data pre-processing logic of the work, we considered group of drugs combinations instead of one-to-one drug combinations. This approach identifies possible successful treatment groups, however, the fact that independent one-to-one drug effect is not fully examined is a limitation. The best group of drugs for each stage is based on a vector of 10 features, which may not be enough for an entire treatment generation. This is a known limitation and we have proceeded with the limited number of features for the methodological reasons of this work. The class imbalance was handled in this experiment, but it should be of primary importance if we work with datasets of bigger sizes. We will try to address all identified limitations as part of future work.
Funding
This work was partially supported by the RA MESCS Science Committee and BRFFR in the frames of the joint research project SC No21SC-BRFFR-1B029.
Appendices
Appendix
NOTES
1Code: https://github.com/karen-gishyan/project.