The Effect of Promotion via TikTok Live Streaming on Consumers’ Buying Interest in Clothing Products ()
1. Introduction
The role of social media is very large in this digital era. Social media is not only a medium of communication and entertainment, but now social media has turned into business activities, especially marketing. Social media influence is considered an effective form of marketing due to its easy access to potential customers and relatively inexpensive to conventional methods.
TikTok’s recent rise in popularity coincides with the worldwide Covid-19 outbreak, which has resulted in an increasing number of people turning to their mobile devices to find new ways of shopping, working, and socializing (Annur, 2020) .
Based on sources from We Are Social (Rizaty, 2022) , TikTok currently has 1.4 billion monthly active users aged 18 and above globally as of the first quarter of 2022. This represents a 15.34% increase from the previous quarter’s 1.2 billion users.
The data presented indicates that the United States has the highest number of active TikTok users globally, with 136.4 million users as of April 2022. These users contribute to ap-proximately 40% of TikTok’s revenue from advertising and other commercial activities. Indonesia comes in second place, with 99.1 million active TikTok users who spend an average of 23.1 hours per month on the platform. Brazil ranks third with 73.6 million active users who are primarily young people in the country. Russia and Mexico follow closely with 51.3 million and 50.5 million active users respectively. Vietnam has 45.8 million active users, while the Philippines has 40.4 million and Thailand has 38.4 million active TikTok users, ranking them eighth on the list.
This means that TikTok can really be a very effective marketing tool, especially live streaming, to reach many potential customers, and can even reach overseas with relatively cheap and easy costs. Seeing that most TikTok users are teenagers, clothing products are very suitable for marketing on TikTok, specifically marketing via live streaming.
There are various categories of video content in the TikTok application, where fashion products are one of the most watched video categories by TikTok users. This phenomenon also occurs in Indonesia, where the fashion category ranks third out of the five most watched video categories, so that it is used by business players in the fashion product industry to conduct marketing via the TikTok application.
This study aims to determine the effect of TikTok’s social media marketing, especially the live streaming feature, on the desire to buy fashion products, especially clothing in Indonesia. This research will also provide input for business people or clothing industry marketers to consider using the TikTok application, especially live streaming as a medium for marketing fashion or clothing products.
2. Theoretical Basis
2.1. Social Media
In 2021, social media has become an integral part of daily activities, including socializing, selling products, and transforming the marketing industry into digital marketing. Social media is a digital platform that allows users to interact by sharing various forms of content, such as writing, photos, and videos. This content is publicly accessible in real-time, as social media rely on the internet to facilitate its distribution.
According to the McGraw Hill Dictionary (McGraw-Hill, 2003) , social media is a tool for people to exchange information and ideas within a networked virtual community. Tuten and Solomon (2015) define social media as a means for online communication, collaboration, and networking among interrelated and interdependent individuals, communities, and organizations. Howard and Parks (2012) describe social media as a combination of information infrastructure and tools for producing and distributing digital content, with individuals, organizations, and industries as both producers and consumers of this content. Finally, Veil, Buehner, & Palenchar (2011) define social media as communication between humans that is characterized by participation, openness, conversation, community, and connectedness.
2.2. Social Media Marketing
The definition of Social Media Marketing according to Philip Kotler in his book Principles of Marketing (Kotler & Armstrong, 2017) Social Media Marketing is the process of building relationships and building customer trust via social media platforms. Meanwhile, Dave Chaffey explained that social media marketing is the process of using social media platforms to promote products or services and build memorable customer relationships in his book “Digital Marketing: Strategy, Implementation and Practice” (Chaffey & Ellis-Chadwick, 2016) .
There are several elements that are used as success variables in social media marketing, namely Engagement, Traffic Flow, Conversions, Brand Awareness, Lead Generation. Engagement is the level of interaction between users and social media marketing content. These variables include the number of likes, comments, shares, and video views. Traffic flow is the number of visitors who come to the website via social media platforms. This variable is important because it helps determine the effectiveness of social media marketing in driving traffic to websites.
Conversion is the rate at which a customer takes an action after seeing an ad or social media marketing content. This variable includes the number of customers who buy products, register for services, or fill out contact forms. Brand Awareness is the level of brand awareness received by customers. This variable can be achieved via quality content and effective interactions with customers via social media platforms. Lead Generation is the process of acquiring potential new customer information via social media platforms. This variable includes the number of new customers contacted after filling out the registration form or requesting further information via social media platforms, in his book “Digital Marketing: Strategy, Implementation and Practice” (2016).
2.3. TikTok App
Prosenjit & Anwesan (2021) define TikTok as a social media application that allows users to create and share short videos. These videos can feature a variety of content, including comedy, dance, music, food and film reviews, and daily activities. The app enables users to share their content with the public through the application. In addition, TikTok is constantly developing new features, including live streaming, to make it more user-friendly for both entertainment and marketing purposes.
The thing that makes TikTok stand out among other competitors is that this entertainment application allows everyone to be able to become a creator because of its simplicity and ease. Almost five years after its launch in September 2016, TikTok is experiencing a high popularity.
2.4. Live Streaming TikTok
The definition of Live streaming on TikTok according to David Erikcson in his book “TikTok Live Streaming: The Future of Interactive Content” (Erikson, 2021) is defined as a direct transmission feature that allows users to send transmissions directly from the application. Live streaming can add a higher level of interaction on the TikTok platform as it allows users to interact with their audience directly. In the future, the live streaming feature is increasingly popular with users, especially from millennials.
2.5. Buying Interest
According to Michael R Solomon in his book “Consumer Behavior: A Strategic Approach” (Solomon, 2017) Buying interest is defined as a factor that influences a person’s purchase because it takes into account the level of need, desire and trust in a product or service. Factors that influence buying interest according to experts can be influenced by Personality, Social, Psychological and Economic. A person’s personality can affect buying interest because it affects the level of their needs and desires for a product or service. Social factors such as reference groups, family, and friends can influence buying interest because they influence a person’s view and decisions about a product or service.
Psychological factors such as motivation, perception, and attitude can influence buying interest because it affects the level of a person’s needs and desires for a product or service. Economic factors such as income, price, and inflation can affect buying interest because they affect a person’s level of ability to purchase a product or service.
2.6. Apparel Products
According to J. Paul Peter and Jerry C. Olson, in the book “Consumer Behavior and Marketing Strategy” (Peter & Olson, 2017) . A product is everything that can be offered to the market to be accepted or used to meet the needs and desires of consumers. While the definition of clothing is according to the Big Dictionary of Indonesian: “Objects worn to cover part or the whole body, mainly to protect, beautify, or fashion”.
3. Theoretical Basis
3.1. Types of Research
This research is a survey study, which is a study that takes samples directly from the population. Judging from the problems studied, this study is a causality study, which aims to analyze the relationship and influence (cause-effect) of two or more phenomena, via hypothesis testing. Cooper and Schindler (2003: 11) reveal that research based on a theory or hypothesis that will be used to test a phenomenon that occurs is classified as a type of explanatory research (explanation).
3.2. Data Collection Techniques
In this study, data collection techniques will be used using questionnaire techniques. A questionnaire or questionnaire is a data collection technique that is carried out by giving a set of questions or written statements to respondents to be answered. According to Sugiyono (2011: 224) data collection techniques are the most strategic step in research, because the main purpose of the research is to obtain data.
3.3. Research Data
The data needed and used in this study includes primary data. Primary data were obtained directly from respondents via surveys. The questionnaire is distributed in online form via Google Form.
At the beginning of the questionnaire, there were several demographic questions of respondents (gender, age, occupation) and in the second section there were several questions with a choice of answers Yes or No about the characteristics of respondents as TikTok social media users and clothing product users. At the core of the questionnaire are questions with answer choices in the form of a linked scale or five scale points (1 = strongly disagree and 5 = strongly agree) which will be selected based on respondents’ perceptions of variables (about promotion via TikTok live streaming and buying interest).
The sample used in this study amounted to 100 respondents. The source of respondents here was taken randomly at UIN Sunan Kalijaga Yogyakarta, mathematics students from batch 2020 to 2022 totaling 111 students.
100 samples were taken using the Slovin method with a 5% error, namely
with n samples selected, N population and e is the error tolerance.
The filling method was carried out in a self-administered manner, or the respondents filled out the questionnaire independently. This research uses probability sampling technique. Questionnaires were also distributed using random sampling method. Furthermore, the data obtained will be analyzed using the Simple Linear Regression Analysis method.
3.4. Operational Definition of Variables
The operational definition of variables according to Arikunto (2010) is the elaboration of research variables in a clear and detailed manner, so that they can be measured objectively and can be repeated by other researchers in the same research context. The operational definition of this variable is important in research because it makes it easier for researchers to measure and obtain valid and reliable data. In this study, it consisted of an independent variable, namely Clothing Ads use live streaming TikTok (X) a dependent variable, namely an interest in buying clothes after seeing live streaming on TikTok (Y).
3.5. Measurement Scale
Each answer to a question given by a respondent is measured using the Likert scale, which is a scale used to measure the attitudes, opinions and perceptions of a person or group of people about social phenomena.
3.6. Research Instrument Test Methods
The test method of research instruments according to Ghozali (2016) consists of three stages, namely validity test, reliability test, and classical assumption test.
1) Validity Test
The validity test is used to measure whether or not a questionnaire is valid or valid. The degree of validity is obtained by comparing the probability of the return value with its alpha. If the probability ≤ 0.05 then the measuring instrument is said to be valid. A questionnaire is said to be valid if the question on the questionnaire is able to reveal something that the questionnaire will measure.
2) Reliability Test
According to Ghozali (2006: 45) reliability is a tool for measuring a questionnaire which is an indicator of variability. The value of the coefficient of reliability ranges from 0 to 1. If the coefficient value is close to one, the instrument becomes more reliable. The measure used to indicate the question is reliable, if the value of cronbach alpha is above 0.6.
3) Classical Assumption Test
The classic assumption test according to Ghozali (2016) is a statistical test that is performed before conducting inferential data analysis. This test aims to ensure that the data to be analyzed meet the classical assumptions needed in hypothesis testing. The classic assumption test consists of four types of tests, namely data normality test, multicollinearity test, autocorrelation test, and heteroscedasticity test.
3.7. Data Analysis Methods
The data analysis method used in this study is a quantitative analysis technique. Quantitative analysis is an analysis that uses quantitative analysis tools, namely statistical models.
1) Simple Linear Regression Analysis
Simple regression analysis is a statistical method used to test the relationship between one independent variable (X) and one dependent variable (Y). The purpose of a simple regression analysis is to obtain a regression line equation that can be used to predict the value of a dependent variable based on the value of an independent variable.
In simple regression analysis, the regression line equation can be used to predict the value of a dependent variable based on the value of an independent variable. The equation of such regression lines can be expressed in the form of:
where Y is a dependent variable, X is an independent variable, a is an intercept (the value of Y when X = 0), and b is the regression coefficient (indicating how much Y changes if X changes by one unit).
2) Coefficient of Determination
The coefficient of multiple determinations (R2) can be used to determine the amount of the donation or the contribution of the entirety of the free variable (X1, X2, X3, X4, and X5) its effect on the variable is bound (Y), while the rest is affected by the free variable (X) that is not inserted into the model. A model is considered good if the coefficient of determination is equal to one or close to one (Gujarati, 2003: 199) .
3) Test Classical Assumptions
The classical assumption tests used in this study are the Normality Test, Heterokedaticity Test, Autocorrelation Test and Multicholinearity Test.
3.8. Hypothesis Test
1) Test F is used to test the effect of a free/Independent variable (X) in a bound variable (Y) together/simultaneously. The test is carried out by comparing the calculated F value with the Table F value.
2) The t test is used to test the significance of partial and independent influences on dependent variables.
4. Results of Research and Discussion
The results of the analysis that has been carried out in this study have fulfilled the test requirements of simple linear regression analysis. Data collected through questionnaires distributed to respondents have been tested for validity and reliability so that they can be continued with the classical assumption test which consists of the normality test, the non-multicollinearity assumption test and the classic non-heteroscedasticity assumption test and autocorrelation (Table 1).
4.1. Data Analysis
4.1.1. Validity and Reliability Testing
1) Validity testing
The validity test is used to test the accuracy of the measuring device, it can reveal the concept of the symptoms/events measured. The validity test is used to measure the validity or not of a questionnaire, a questionnaire is declared valid if the question/statement on the questionnaire is able to reveal something that will be measured by the questionnaire. The validity test can be used correlation coefficients whose significant value is less than 5% (level of significance) indicating that the statements are valid as indicator shapers. The test results were obtained as follows (Table 2):
Based on Table 1 shows that all statement items used to shave the variables used in this study have an r value of more than 0.3 with a Sig value of 0.00 < 0.05 so it can be said that the overall indicator is valid to be used as an instrument in the study or the questions asked in the study can be used to measure the variables studied.
2) Reliability testing
The reliability test is a tool for measuring a questionnaire which is an indicator of a variable or construct. A questionnaire is declared reliable if the answer to a statement is consistent or stable over time. The reliability test in this study is to use the alpha formula. The results of the reliability test for each variable obtained the following data (Table 3).
Based on Table 2, it shows that all variables have a Cronbach’s alpha coefficient on the Promotion variable questionnaire via live streaming which is 0.710 and the variable of interest in buying clothes which is 0.621 is all above 0.60 so it can be concluded that the variable measuring items and questionnaires are reliable which means that the questionnaire used in this study is a reliable questionnaire.
4.1.2. Validity and Reability Testing
To find out whether the model meets the BLUE (Best linear unbiased estimator) assumption or not, it is necessary to carry out several tests, namely the normality test, multicollinearity test, heteroscedasticity test and autocorrelation test.
1) Normality Test
A normality test is a statistical test used to check whether the observed data comes from a normally distributed population. Normality tests are very important in statistical analysis because most statistical inference techniques require the assumption that the data used are from normally distributed populations.
Several methods that can be used in carrying out the normality test include: Q-Q Plot: This method is used to compare the distribution of data with the normal distribution. If the points in the plot follow the diagonal line well, then the data can be assumed to come from a normally distributed population.
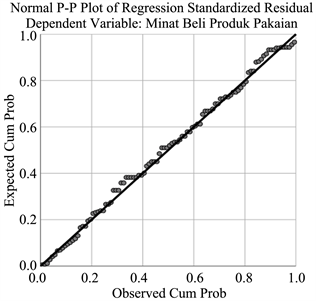
Based on the curve analysis in the figure above, it can be seen that the data spreads around the diagram and follows the regression so that it can be concluded that the processed data is normally distributed data so that the normality test is met.
2) Multicolinearity Test
A multicolinearity test is a statistical test used to check whether there is a strong linear relationship between two or more free variables in a regression model. If multicolinearity is found, then it can cause problems in the interpretation of regression coefficients and the right decision making.
Some methods that can be used in conducting a multicolinearity test include Variance Inflation Factor (VIF): This method is used to assess how much influence one free variable has on another free variable. The higher the value of the VIF, the more likely it is that multicolinearity will occur. Here will use the VIF method (Table 4).
Based on Table 3, it can be seen that the results of the calculation of the tolerance results show that the free variable has a tolerance value of ≥0.10 and VIF ≤ 10. So it can be concluded that there is no multicolinerity between free variables in the regression model.
3) Heteroskedasticity Test
A heteroskedasticity or heteroskedasticity test is a statistical test to check whether the residual error variation of a regression model varies across a range of predictor values. If the residual error variation is unstable, then the regression model is considered to be experiencing heteroskedasticity. To perform a heteroskedasticity test, there are several methods that can be used. Here will use the plot/graph method.
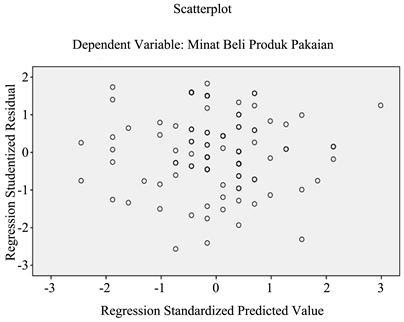
Based on the figure, it can be seen that heteroskedasticity does not occur because there is no clear pattern and the points spread above and below the number 0 on the y-axis, so it can be said that the heteroskedasticity test is met.
4) Autocorrelation Test
An autocorrelation test is a statistical method used to test whether there is autocorrelation in the residual error of a regression model. There are several methods that can be used to test autocorrelation. Here will use the Durbin Watson test method. This method tests whether there is a positive or negative autocorrelation in the residual error of a regression model. The test is based on Durbin-Watson (4) values, which can be calculated from the residual error of the regression model.
If the Durbin-Watson value (4) calculated from the regression model is smaller than the critical dL, then there is evidence of positive autocorrelation on residual errors. Whereas if the calculated value of d is greater than the critical dU, then there is evidence of negative autocorrelation on residual errors. However, if the calculated value of d is between the critical dL and dU, then there is no evidence of significant autocorrelation residual error. After processing with SPSS, the value of d appears (Table 5).
The d value is 1.403 if calculated via Durbin Watson’s table the critical value of dL and dU is about 1.36 and 1.64 so that between dL and dU it can be concluded that there is no evidence of significant autocorrelation in residual error.
4.1.3. Effect of Simultaneous Significance (T-Test) and Simple Linear Regression
It will be studied whether the results of hypothesis testing show a simultaneous influence between Clothing Promotion via live streaming and consumer buying interest. Live streaming provokes consumer attraction visually and emotionally because being able to see the product live for the hypothesis can be seen from Table 6 below.
1) T-Test
The hypothesis test in this study is the t test. The t-test is used to partially test the significance level of the variable X against Y. The sample used was 100 people, so the test used a t test with df = n − 2 (100 − 2 = 98) or df = 98 people, and the significance level (α) = 5% then obtained t Table 7 in 1.984.
Based on Table 5 obtained from the results of data processing using SPSS (Statistical Package for Social Science) version 22, the t-test was obtained from variable X, namely in the calculation of SPSS (Statistical Package for Social
a Predictors: (Constant), live streaming promotion with TikTok. b Dependent Variable: Interest in buying clothing products.
![]()
Table 8. Simple linear regression test.
R = 0.292, R Square = 0.086, F = 9.164, Significance 0.003.
Science) it can be seen that t calculate the Ad variable with TikTok live streaming 3.027 > t table 1.984 and a significant value of 0.003 < 0.05, so that H₁ which reads the promotion variable with TikTok live streaming has a positive and significant influence partially on the Interest in buying clothing products is accepted, while the variable Promotion with TikTok live streaming does not have a positive and partial significant effect on the Interest in buying clothes is rejected. So, it can be concluded that Promotion with TikTok live streaming has a positive and partially significant influence on interest in buying clothing products.
2) Simple Linear Regression Test
A simple linear regression test aims to analyze the Effect of Promotion via live streaming on TikTok on clothing buying interest. Simple linear regression analysis was performed by utilizing the SPSS (Statistical Package for Social Science) 22 for windows application, while the confidence level used in simple linear regression calculations was 95% or with a significance level of 0.05 (α 0.05) (Table 8).
Based on Table 6 (Simple Linear Regression Calculation Results) above, it can be known the simple linear regression equation as follows:
The coefficients of the simple linear regression equation above can be interpreted as the regression coefficient for constant 29.907 shows that if the Promotion variable via live streaming is zero or fixed, it will increase Clothing Buying Interest by 29,907 units. The value of the live streaming promotion variable coefficient of 0.269 shows that if the live streaming promotion variable increases by one unit, it will increase clothing buying interest by 0.269 units or 26.9%.
5. Discussion and Conclusion
After analyzing the data, the next step is to discuss the results of the data that has been obtained about the influence of promotion via TikTok live streaming on clothing buying interest. Testing the hypothesis that there is an influence between TikTok live streaming promotion on consumers’ buying interest in clothing products. This can be seen from the results of the SPSS 22 output with regression analysis of variables that show a positive correlation coefficient (R) (0.292) and a calculated t value of the consumer buying interest variable (3.027) > t table corresponding to a significant level of 5% (1.984). The results of this study show that the influence of promotion via TikTok live streaming affects consumers’ buying interest in clothing products, so it can be concluded that promotion via TikTok live streaming has a positive and significant influence on consumers’ buying interest in clothing products. This means, the better, more creative and often promoted via TikTok live streaming, the consumer’s buying interest in clothing products is also increasing or tends to be more in demand.
The results of this study are also in line with other studies related to the effectiveness and response of the community using live streaming TikTok. Even in Indonesia, the live streaming feature for the TikTok shop is preferred over Shopee in Indonesia. The survey shows that 27.5% of Indonesian respondents use TikTok, the details of which are TikTok (27.5%) Shopee (26.5%) Lazada (20.1%) Instagram (12.2%), Facebook (10.1%) YouTube (3.7%). Most of them sell clothes, beauty and body care, food and beverages to household items. The Ninja Xpress report shows that the transaction value (GMV) of TikTok has increased by up to 411%. Orders at the TikTok Shop increased by 564.1% compared to the previous period (Septiani, 2023) .
There are also other studies that provide similar results related to live streaming on TikTok and the influence of consumer decisions, namely the study of the Communication Studies Study Program, University of Muhammadiyah Cirebon, which examines the word of mouth aspect of live streaming TikTok to buyer decisions with student respondents in the study of the Communication Studies Study Program, Muhammadiyah University of Cirebon. Results The research shows that word of mouth has a significant effect on the TikTok shop live streaming and the results of the study also reveal that purchasing decisions will increase if word of mouth increases its influence through the display and presentation of the Tiktok shop live stream. So the live streaming of the TikTok shop can have a positive effect on the influence of word of mouth to encourage student purchasing decisions, which is in line with this research on the effect of live streaming on TikTok on consumer buying decisions, which is indeed close and influential (Anisa et al., 2022) .
The influence of TikTok live streaming on consumers’ buying interest does not only occur in physical products, but also in services. For example, a TikTok user can live stream while traveling or traveling somewhere. The live stream can show interesting experiences and activities in the place, which can then affect consumers’ buying interest in visiting the place or using the services offered by the party doing the live streaming.
Via this research, the author can suggest to business actors to be more updated regarding social media specifically for TikTok with the live streaming feature. Based on this research and several other studies, it has been proven that live streaming has a strong and significant influence on consumers’ buying interest in clothing products, cosmetics and even services.