Improving Revenue Collections through Tax Reforms: Evidence from National Revenue Authority, Sierra Leone ()

1. Introduction
The need for tax payments has been an occurrence of global significance as it affects every economy irrespective of national differences. Tax is a compulsory charge imposed by a public authority on the income and properties of individuals and companies as stipulated by the government Acts or Laws irrespective of the exact amount of service of the payer in return. Tax payment is not for the direct exchange of goods and services, but a transfer of resources and income from the private sector to the public sector in order to achieve some of the nation’s economic and social goals.
The political, economic, and social development of any country depends on the amount of revenue generated (Canicio & Zachary, 2014) [1], for the provision of infrastructure in that given country; hence, the primary objective of tax reforms is to promote rapid economic growth and alleviate poverty (Mwakalobo, 2015) [2]. However, one means of generating the amount of revenue for providing the needed infrastructure is through a well-structured tax system (Ogbonna & Ebimobowei, 2016) [3], tax is a major player in every society in the world. The tax system is an opportunity for the government to collect additional revenue needed in discharging its pressing obligations.
Tax collections in Sierra Leone are very low. For instance, the ratio of tax revenue shortfalls contributed to higher fiscal deficits (14.7 percent of GDP in 2004) and larger domestic financing. The higher domestic financing may have fueled the inflationary pressure and precipitated an over-valued exchange rate. The underlying argument is that the yield of tax revenue is a function of the existing tax bases, the rates, and the probability of collecting the specific levies. Sierra Leone also suffers from external shocks. Some of these resources include import and export taxes on mineral products whose prices are determined outside the influence of Sierra Leonean authorities. Besides the volatility in prices of mineral products, the granting of numerous tax exemptions such as the abolishment of the export tax on agricultural products and the smuggling of mineral products (such as diamonds and cocoa) across porous borders considerably reduce the tax base (International Monitory Fund Reports, 2009, Sierra Leone) [4].
In a bid to meet the challenges of enhancing revenue collection, various reforms were introduced in the tax systems (Kamara & Mingfei, 2011) [5], ranging from frequent revisions in the tax system, tax rates, harmonization of tariffs, introduction of new taxes, and two autonomous revenue agencies. However, these reforms have not been part of a concerted effort to reform the entire tax system, but part of the efforts is to raise more revenue through budget pronouncements affecting the tax rates or tax brackets. For instance, following the passing of the Minimum Wages Act in 1997, there were seven more income tax brackets and tax rates ranging from 8.0 percent to 50.0 percent, but the Income Tax Act of 2000 reduced the tax brackets to five with the rates ranging from 25.09 percent to 40.0 percent. The reforms were also aimed at increasing efficiency and improving work conditions for the tax administration, and reducing inequalities, distortion, and corruption. The NRA Act of 2000 also provided for the establishment of an autonomous revenue agency (National Revenue Agency). In this regard, tax elasticity constitutes an important ingredient of a tax system (National Revenue Authority (NRA) Reports, 2010) [6].
Despite the reforms introduced in the Sierra Leonean tax system, the country is still embroiled in a budget deficit partly due to poor revenue generation, moreover, very little is known about the performance dynamics of the reforms in terms of raising the revenue mobilization capacity of the tax system and how the reforms have affected each tax source. This study intended to examine the impact of tax reforms on the revenue collections of the National Revenue Authority of Sierra Leone.
2. Data and Methodology
The study adopts the exploratory and ex-post facto design. The exploratory design will be used to gather relevant materials from existing literature that are relevant to the study such as reports from NRA, related articles, journals, the internet, and the database of the Monitoring, Research and Planning Department of NRA. Whilst the ex-post factor design was adopted on the basis that it does not provide the study the opportunity to control the variables mainly because they have already occurred and cannot be manipulated.
2.1. Method and Sources of Data
The study predominantly used secondary sources of data and analyse data descriptively. Secondary data was collected through the review of existing literature that is relevant to the study. The literatures that were consulted included reports from NRA and its projects, related articles, journals, and from the internet. In addition, data was garnered from the Database of the NRA Monitoring Research and Planning Department for this research.
2.2. Techniques of Data Analysis
In analysing the data, gathered statistical charts were employed to establish the relationship between revenue collections in different periods and revenue collections among tax types and departments.
3. Result and Discussion
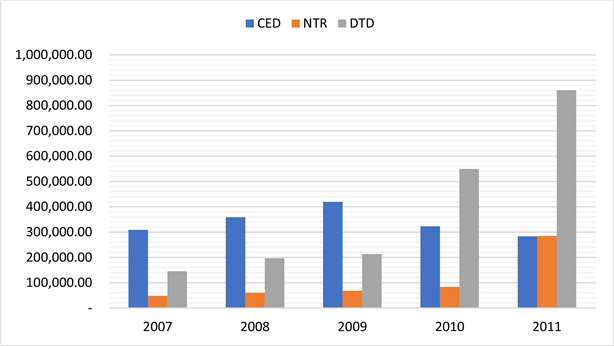
From the consolidation of income tax and customs operations in 2003, the establishment of a Non-Tax Revenue (NTR) Department in 2004, and decentralization of tax administration to the implementation of GST, automation of customs operations, and establishment of a Domestic Tax Department (DTD) in 2011, the National Revenue Authority has torn along sturdy reforms that have reflected on its performance over the years. The outcomes are, among others, a massive boost in domestic revenue collection and improved efficiency in tax and customs administration.
Table 1 was generated to present a periodic comparison of key tax indicators and to provide a glimpse of revenue potency. The three periods were: post-war (2002-2011), NRA era (2003-2011), and the last five years (2007-2011), and the estimates were simple statistical measures (mean and standard deviation) as a way of comparing averages and deviations for nominal collection, tax-GDP ratio, and annual revenue growth rate. The estimates revealed a mixed result. NRA has collected on average Le 630.4 billion over its nine years of operation, more than the average collected in post-war Sierra Leone (Le590.5 billion). However, the average revenue growth rate was better in post-war Sierra Leone (22.2%) than in the NRA era (20.7%). Tax levels (tax-to-GDP ratio) hitherto remained the same over the two periods (11.6 percent). Over the last years though, NRA revenue performance has shown a strong growth pattern. During this period, the average collection was Le840.5 billion, the average growth rate was 26.1 percent, and the mean tax level was 11.8 percent. In fact, it is the estimates in the last two years that provide all the signs of optimism with an average growth rate of more than 30 percent and a tax-GDP ratio of 13.7 percent.
The illustrations from Figure 1 and Table 1 underscored the existing potential for further growth in revenue collection. The upward revenue trend with a high positive slope and coefficient of determination (R2 = 0.817) as demonstrated in Figure 1, points to the expansionary growth path in national revenue, all other things remaining the same. Similarly, the estimated high standard deviation
![]()
Table 1. Descriptive statistics of revenue collection in three sets of periods.
Source: Monitoring, Research and Planning Department (MRP), NRA (June 2021).
for all parameters in the last five years further indicates future revenue expansion.
In short, Sierra Leone, revenue in recent years has garnered measured momentum, bolstered by the successful implementation of the Goods and Services Tax, internal business processes re-engineering, automation, and a boom in the mining sector. These reforms have in a number of ways enabled the Authority to perform consistently (based on its programme targets) following consecutive collection deficits in 2006, 2007, and 2008.
3.1. Revenue Outlook in the Last Five Years
Collection by departments over the last five years revealed an interesting pattern. All departments reported a gradual increase in collection until 2010 when the dynamics changed reflecting the direction of reforms. Figure 1 illustrated that CED collected more revenue than DTD and NTR before 2010 when the GST implementation commenced, and the administration of import sales tax and domestic sales tax was transferred from Customs and Excise Department (CED) to the Goods and Services Tax Department. The fact that non-tax revenue increased tremendously in 2011 is also a reflection of the boom in the extractive industry and payment for licenses, leases, and royalties by operators in the sector.
Between 2010 and 2011, DTD collection increased by more than half (56.6 percent) from Le549.4 billion to Le860.6 billion (Table 2).
However, CED performance slumped (12.2 percent) from Le322.8 billion (2010) to Le283.3 billion (2011) as a consequence of the expansionary trend in
Source: Monitoring, Research and Planning Department (MRP), NRA (June 2021).
Figure 1. Collection by revenue agencies (2007-2011).
![]()
Table 2. Domestic tax department’s collections.
duty concession and the transfer of import and domestic sales tax to GST in 2010 (Table 3).
3.2. Composition of Collection: Direct and Indirect Taxes
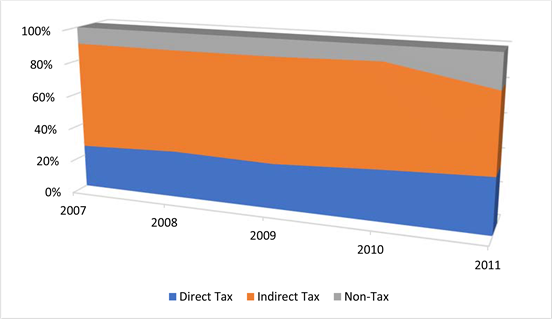
In Sierra Leone, consumption accounts for 40 percent of GDP in our national accounts. The national income level has also increased in recent years to underscore the expansion in the real and service sectors. To NRA, these economic windfalls have been translated into increased consumption and income tax revenues. Indirect taxes or taxes on goods and services accounted for the bulk of total revenue collected in 2011. The evidence in Figure 2 revealed that until 2011, such taxes comprised about two-thirds of total revenue collection, which is a testament to our reliance on consumption taxes. However, the narrowing gap between indirect and direct tax revenues is a prospect for sustainable revenue generation as income and capital are relatively more stable revenue sources than goods and services.
It could be noted from Figure 2 that direct taxes make up a third of revenue collection in 2011, from one-fourth in 2007 and 30 percent in 2010. The rise in both direct tax and non-tax revenues in 2011 which trimmed the composition of consumption tax (to 47 percent) in domestic revenue revealed a gradual growth trend that defines a new beginning in domestic revenue collection that is in line with domestic revenue stability demands. It is also a cause for optimism as the extractive industry continues to expand with renewed hopes of greater contribution to domestic revenue at a time when the tax authority is far advanced in its
![]()
Table 3. Custom and excise department’s collections.
Source: Monitoring, Research and Planning Department (MRP), NRA (June 2021).
Figure 2. Analysis of direct and indirect taxes (2007-2011).
modernization of systems and operations to promote voluntary compliance and maximize collection.
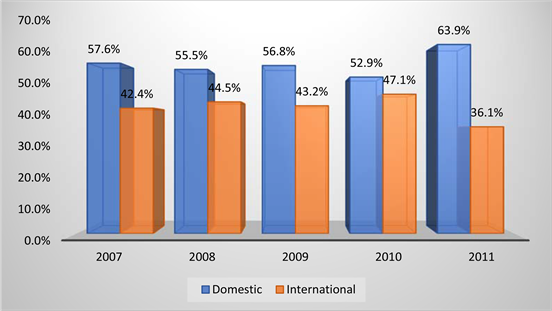
3.3. Domestic and International Trade Tax Fraction in Sierra Leone
Until 2010, revenue collections have been overly reliant (about 47% percent or more) on international trade taxes (import duties, import sales tax, and import excise on petroleum). The sterling consequences of import volume fluctuations, exchange rate volatility, and other forms of international shocks have urged the NRA to reform its systems in order to revamp domestic revenue sources and shift reliance on those sources. This move culminated in the implementation of GST in 2010 and the integration of the GST and Income Tax processes in 2011.
As illustrated in Figure 3, more than half of national tax revenue was collected from domestic sources 4 (corporate tax, personal income tax, domestic GST, and domestic excise) in 2010. The proportion increased to about 64 percent in 2011, following the integration of the GST and ITD business processes into a Domestic Tax Department (DTD). The declining trend in international trade taxes could be associated with the country’s move towards global trade liberalization and gradual commitment to the vision of the World Trade Organization.
3.4. NRA Revenue Performance from 2011 to 2019
Where revenue collection topped Le1.4 trillion, grew by 49.5 percent, and was almost the size of the country’s GDP ten years before (in 2001), the performance is virtually commendable. Since the Authority began mobilizing resources towards improving processes and procedures and systems automation, achieving the “trillion Leones collection” milestone that was once a myth is now a thing of the past. NRA has, in two years, doubled collection (from Le700 billion in 2009 to Le1.43 trillion in 2011. The GST collection was enhanced by an increase in
Source: Monitoring, Research and Planning Department (MRP), NRA (June 2021).
Figure 3. Domestic and international trade tax outlook (2007-2011).
domestic imports, hence the collection of Import GST. PIT was bolstered by an advance P-A-Y-E payment of US$10 million by African Minerals. Although Royalties are accounted for under non-tax revenue, it was payments on Mining Licenses (49.8) and Mining Lease (16.6) that contributed the most (two-thirds) to total non-tax revenue collection in 2011. The bulk of these payments is signature bonuses and licenses payment from petroleum exploration companies for the right to operate in the country.
The year-on-year analysis shown in Table 4 revealed an encouraging growth trend in the collection and an interesting shift the in collection pattern. Revenue collection grew by 36.5 percent between 2009 and 2010 and further increased by almost half that amount in 2011. This boost could be attributed to the implementation of GST, which alone contributed a quarter of total collection in 2010 and about 0.5 percent more (26.3) in 2011. All major tax handles (PIT, GST, CIT, and Import Duty) reported significant growth rates in 2011 (115.3, 52.3, 5.8, and 25.1 percent respectively). That notwithstanding, it is the evolving collection pattern that makes interesting reading: Customs and Excise Department (CED) collected the most (about 60 percent of collection) in 2009 and collected the least (19.8 percent) in 2011. This is the result of sustained reform measures geared towards enhanced collection from domestic sources, amendments in tariffs to match the changing market conditions, and expanding duty-waiver and concessions.
3.5. Revenue Performance (Variance Analysis)
Tax collection is monitored and evaluated at the end of every quarter, half-yearly,
![]()
Table 4. Year-on-year revenue performance (in millions of Leones).
Source: Monitoring, Research and Planning Department (MRP), NRA (June 2021).
and annum using the annual programme target for the period. The target is the minimum the Authority is expected to collect and should do so for all tax handles and collection agencies over the same period. In 2011, NRA was expected to collect Le1.32 trillion. DTD was to collect Le715.7 billion, Le105.9 on CIT, Le265.5 on PIT and Le335.3 on GST, and about Le9 billion on Foreign Travel Ticket (FTT). Similarly, the projected collection by CED was estimated at Le365.8 billion (Le282.9 on import duties, 78.7 on excise on petroleum, and Le3.3 on other excises). The target for non-tax revenue was also estimated at Le239.8 billion (Le7.4 billion on Royalties, Le145 billion on Mining Licenses, Le1.1 billion on Mining Leases, and Le86.3 billion on fines, fees, and other charges). Figure 4 illustrated the actual collection (left) and projected collection (right) for each revenue agency since in 2011 to 2019.
Overall, it was a celebrated spectacle for NRA as it collected a total of Le1.428 trillion, Le107.4 billion (8.1 percent) more than the expected collection in 2011. It could also be seen from Figure 4 that only two departments (DTD) and NTR met and/or exceeded their targets in 2011. The estimated target is an amount agreed computed and agreed upon by all stakeholders (NRA, Ministry of Finance, and the International Monetary Fund).
As illustrated in Table 5, DTD exceeded its target by a mammoth Le144.9 billion (20.2 percent) and NTR by Le45 billion (18.8 percent) compensating for the Le82.5 billion shortfall reported by CED. Major tax handles such as PIT, CIT and GST also surpassed their target by a considerable amount (Le68.7 billion, Le38.5 billion, and Le39.9 billion respectively). Import duty and Excise on Petroleum fell short by Le45.5 billion and Le44.5 billion respectively. The Mines section under NTR also performed reasonably well (reporting a surplus of Le51.8 billion) but projections on fees, fines, and other related charges from related Ministries, Departments, and Agencies (MDAs) fell short of the target by Le6.8 billion.
![]() Source: Monitoring, Research and Planning Department (MRP), NRA (June 2021).
Source: Monitoring, Research and Planning Department (MRP), NRA (June 2021).
Figure 4. Revenue performance (actual versus target) in 2011.
![]()
Table 5. NRA revenue performance in 2011(amount in billions of Leones).
Source: Monitoring, Research and Planning Department (MRP), NRA (June 2021).
It has been shown that collection in 2011 was a significant leap (49.5 percent) from 2010 collection growth in revenue could not cease at least in the short run. Despite these measured improvements in tax collection and operational procedures that ranks among the elite in the sub-region (West Africa), there is significant room for expansion more so in its capacity to handle small and micro enterprises, tax evasion, systems automation, natural resources, and electronic taxation and transfer pricing.
3.6. Quarterly Revenue Performance in 2011
The quarterly revenue data for NRA as illustrated in Figure 5 showed that collection in the third quarter of 2011 recorded a dramatic increase than the other quarter (Le475.6 billion) since the start of 2008. The amount represented significant one-off payments on signature bonuses and exploration mining licenses. Average quarterly revenue collection was estimated at Le357.2 billion in 2011 from Le238.9 billion (Le118.3 billion increase) in 2010 (Source MRPD June 2021). From Figure 5, it could also be observed that, barring Q3 of 2011, NRA quarterly revenue collection showed a gradual stepwise growth pattern since the first quarter of 2009.
Compared to quarterly targets, NRA revenue performance revealed a mixed outlook over the last three but has consistently reported excess over its quarterly targets in 2010 and 2011. Individual operational department’s analysis is done under the topic Revenue Performance 2011 to give a detailed picture of this subject.
3.7. Monthly Distribution of Collection
The trend in monthly revenue is akin to the quarterly revenue trend but there are virulent fluctuations in the former. It has been noted that December is the peak month for revenue collection in Sierra Leone, but this propensity was defied in 2011 and continued to the year 2019 when August was the peak month (Figure 6). The reason is the same: large one-off payments by mining and
![]() Source: Monitoring, Research and Planning Department (MRP), NRA (June 2021).
Source: Monitoring, Research and Planning Department (MRP), NRA (June 2021).
Figure 5. Quarterly Revenue performance: 2008-2011.
![]() Source: Monitoring, Research and Planning Department (MRP), NRA (June 2021).
Source: Monitoring, Research and Planning Department (MRP), NRA (June 2021).
Figure 6. Monthly revenue trend: 2009-2011.
exploration companies in respect of signature bonuses and Mining and Exploration Licenses.
Monthly revenue flow over the years was more often observed to peak towards the end of every quarter (March, June, September, and December) and tail off at the start. This is because large corporate tax payments are usually made during this period in addition to regular monthly payments of PIT and GST. However, the pattern was rarely altered in 2011 when February, August, September, and November reported more collections. The average monthly collection for the period under review was estimated at Le119.1 billion, compared to Le79.6 billion in 2010 (an increase of Le39.4 or 49.5 percent). The daily collection average was Le5.7 billion in 2011 and Le3.8 billion in 2010. The facts so far provide modest evidence that the much-vaunted reform measures are propelling the Authority in the right direction. This trend continues to the year 2019.
Figure 7 represents the monthly collection by the revenue agency. The line graphs depicted the overall pattern of the collection and further suggested those periods and agencies responsible for the greatest fluctuation in the collection. Monthly collection by CED remained relatively stable since 2010 before it reached its highest since the implementation of GST (Le54.9 billion in December 2010). The average monthly collection in 2011 was Le23.6, a drop of about Le3.3 billion from Le26.9 in 2010. NTR emerged from its moderate average monthly collection of close to Le7 billion in 2010 to register a Le23.7 billion average in 2011. Apart from bulk payments in August (Le108.1 billion) and September (Le61.2 billion), and a reported Le26 billion in November, all other monthly collections (9) fell short of their average. The evidence in Figure 7 supported the claim that DTD is the current driving force of revenue collection, taking over from CED in 2010. Its average monthly collection was Le71.7 billion in 2011 and Le 45.8 billion in 2010. In addition to the integration of Income Tax and GST
![]() Source: Monitoring, Research and Planning Department (MRP), NRA (June 2021).
Source: Monitoring, Research and Planning Department (MRP), NRA (June 2021).
Figure 7. Monthly revenue trend by revenue agency.
processes, the payment of US$20 million in advance tax in respect of PIT by African Minerals was another major factor for that achievement. This trend continued up to the year 2019.
3.8. Revenue Performance by Operation Department
3.8.1. Domestic Tax Department (DTD)
The Domestic Tax Department (DTD) collects three broad tax categories: Corporate Income Tax (CIT), Personal Income Tax (PIT) and Goods and Services Tax (GST). The department was established in 2011 as a result of the integration of the Income Tax (ITD) and Goods and Services Tax (GST) business processes and operations. Revenue collected by DTD was reported at Le860.6 billion, growing by 56.6 percent and contributing the most to 2011 revenue mobilization (60% or about 9.4% of GDP).
For the period under review, it was receipts from GST (Le375.3 billion) that contributed the most to DTD as well as NRA collection. PIT also reported Le344.2 billion, a substantial increase (115.3 percent) from last year’s collection (Le155.2 billion). CIT ranked fourth (behind GST, Import Duty, and PIT) in contribution to overall performance in 2010 but dropped a place behind Mines to fifth in 2011. Figure 8 presented a variance analysis based on an annual projection for all the taxes collected by DTD. The chart reported a total surplus variance of Le144.9 billion by DTD and also illustrated favourable variance for all major tax handles (PIT, GST, and CIT).
From the illustration, PIT reported the highest collection surplus (Le68.7 billion) followed by GST (Le39.9 billion) and CIT (Le38.6 billion).
3.8.2 Customs and Excise Department (CED)
Customs and Excise Department (CED) was the largest collection agency in NRA in size (personnel) and performance (revenue collection) until 2010. Although
![]() Source: Monitoring, Research and Planning Department (MRP), NRA (May, 2021).
Source: Monitoring, Research and Planning Department (MRP), NRA (May, 2021).
Figure 8. DTD revenue performance: variance.
it remains the largest in size, there has been a considerable boost in domestic revenue mobilization and expansion in operation which has changed NRA’s collection landscape perhaps forever. This new direction led to transfers in tax handles, automation, strengthening of cross-border operations, and increased focus on customs administration. Figure 9 below revealed a vivid image of the dynamics. CED reported an overall shortfall of Le82 billion in 2011, with both Import Duty and Excise on Petroleum failing to meet the projected revenue. These two tax handles are the major collection streams for the Department.
The projected revenue for Customs and Excise Department (CED) was Le365.8 billion, where Le282.9 billion was expected to have been collected on Import Duty, Le79.7 billion on Excise on Petroleum, and Le3.3 billion on Other Excise before the end of 2011. It turned out only Other Excise met the expected collection at the end of the reporting period. The enormous deficit reported on Import Duty (Le45.5 billion) and Excise on Petroleum (Le44.5 billion) conformed largely to policy pronouncements that resulted in revenue loss in respect of fuel subsidy. The Le283.3 billion collected by CED for this period was about 20.2% of total NRA collection and 3.1% of GDP.
3.8.3 Non-Tax Revenue Department (NTR)
The Non-Tax Revenue (NTR) Department collects and accounts for all Royalties, licenses, fees, fines, and other non-tax charges. The department’s collection is broadly grouped into Mines (for all mining-related revenues) and Other Departments comprising Immigration, Law Court, National Registration Secretariat, Telecommunication Commission, Maritime, Ministries, and other Departments and Agencies. Overall, the department collected Le282.5 billion, of which Mines accounted for Le203.9 billion, and “Other Departments” recorded a total of Le76.9 billion (see Table 5 for details).
The variance analysis shown in Figure 10 revealed a surplus of Le45 billion,
![]() Source: Monitoring, Research and Planning Department (MRP), NRA (June 2021).
Source: Monitoring, Research and Planning Department (MRP), NRA (June 2021).
Figure 9. CED revenue performance: variance.
about 19 percent more than its projected revenue. It is worthy to note that that performance was driven by excess collection on mines revenue handles. In detail, NTR collected half of its revenues on Mining Licenses and 16.6 percent on Mining Lease, which means Royalties but all other fees, fines, and charges accounted for only one-third of non-tax revenues (Table 6).
The remarkable achievement in 2011 was a culmination of a number of factors. NRA has made tremendous efforts to improve its effectiveness in collecting revenue to meet government fiscal targets. The move from tax hunting to revenue mobilization through business processes re-engineering, integration, system automatic, and effectiveness in service delivery, has significantly reduced enforcement
![]() Source: Monitoring, Research and Planning Department (MRP), NRA (June 2021).
Source: Monitoring, Research and Planning Department (MRP), NRA (June 2021).
Figure 10. NTR revenue performance: variance.
![]()
Table 6. Non-Tax Revenue (NTR) performance: 2011 (amount in million Leones).
Source: Monitoring, Research and Planning Department (MRP), NRA (June 2021).
and compliance burdens. From the standpoint of the leadership of the Authority, strengthening institutional capacity, integration, expansion, and improvement in operations are the cornerstone to sustained productivity and success in the tax and customs operations of Sierra Leone.
3.8.4 Composition of Revenue
Revenues collected in Sierra Leone could be grouped into three broad categories: Domestic tax, (ii) International trade taxes, and (iii) Non-tax revenue. Domestic taxes are those imposed on domestically sourced income and capital and locally traded goods and services. Taxes imposed on cross-border activities are classified as International Trade Taxes and non-tax revenues comprise all payments for mining licenses, leases, and other fees, fines, and charges. From the evidence in Figure 11 (left), national taxes percent in total revenue (45) was 9 percent more than the taxes on international trade (36) and more than twice the non-tax revenues (19 percent). All International Trade Taxes are collected by the customs and Excise Department.
Figure 11 (right) disclosed that Import duties (42 percent) accounted for the greatest share of collection on International Trade Taxes (Le516.2 billion). Import GST replaced Import Sales Tax in 2010 and was 30 percent of International Trade Taxes in 2011 and Excise on Petroleum was 28 percent. The decreasing share of international trade taxes in total revenue in Sierra Leone is a pointer to the Authority’s steps towards enhancing domestic revenue collection and sustainability.
3.8.5 Distribution of Tax Revenue
Taxes are collected from income and capital, goods and services, trade, and cross-border activities. This section looks at various classifications of tax revenue to present a detailed and explicit picture of the collection since in 2011 to the year 2019. Taxes on goods and services comprise all indirect taxes paid on GST, Import duty, Excise on Petroleum, Royalties, Foreign Travel tickets and Domestic Excise. Taxes on income and capital embrace direct taxes such as PIT, CIT, and Payroll tax. More than half (59 percent) of the tax revenues generated in Sierra Leone in 2011 was on goods and services (Figure 12, left). This fact reflects the prevailing economic reality in a country where consumption share of
![]() Source: Monitoring, Research and Planning Department (MRP), NRA (June 2021).
Source: Monitoring, Research and Planning Department (MRP), NRA (June 2021).
Figure 11. Domestic and international trade taxes.
income is the largest in the measure of economic performance (GDP).
The estimated growth rate (Figure 12, right) showed that taxes on income and capital grew more than taxes on goods and services (64 and 16.6 percent respectively) in 2011.
Personal Income Tax (PIT) share of total taxes on income and capital (52.7 percent) exceeded Corporate Income Taxes (46.8 percent) with Payroll tax representing a negligible (0.5 percent) proportion in 2011. The magnitude of PIT share to total collection on direct taxes in 2011 was consistent with reported figures in previous years. The level of Payroll tax, paid by non-citizens and non-ECOWAS employees in Sierra Leone, in direct and domestic taxes has been relatively constant over the last couple of years.
The composition of taxes on goods and services was depicted in Figure 13 (left). GST (domestic and import) alone accounted for 42 percent of tax revenues collected on goods and services and 26.3 percent of overall revenue collected by NRA from 2011 to the year 2019. Other major contributors to the collection of goods and services include Import Duty (32 percent) and Excise on Petroleum (21 percent). Royalties, imposed mostly on the volume of minerals
![]() Source: Monitoring, Research and Planning Department (MRP), NRA (June 2021).
Source: Monitoring, Research and Planning Department (MRP), NRA (June 2021).
Figure 12. Tax Revenue distribution and growth.
![]() Source: Monitoring, Research and Planning Department (MRP), NRA (June 2021).
Source: Monitoring, Research and Planning Department (MRP), NRA (June 2021).
Figure 13. Taxes on Income and capital and goods and services.
produced (diamond, iron ore, rutile, bauxite, and gold) for export, accounted for only 3 percent of total collection on goods and services and 1.1 percent share of total revenue (Table 7).
Table 7 further revealed that national revenue taken from goods and services (47.3 percent) outweighs collection on income and capital (33.5 percent) in both 2010 and 2011 and to the year 2019. There is also evidence that revenue from domestic sources (collected on income and capital and domestic consumption related taxes) represented a greater fraction than those on International Trade but the reverse was true until 2009. This is a clear indication of our domestic tax effort and drive towards effectiveness in tax administration.
Table 7 further revealed that import duties (16.6) and import GST (17.1) are significant contributors to domestic revenue but PIT (23.3), Corporate Tax (10.1) and Domestic GST (9.2) are the major drivers of revenue collection. Despite the above, the Authority recognizes the fact that the current tax and compliance levels are low to support Government spending; hence there is room for improvement in tax and customs administration. This underscored the need to tackle tax evasion, minimize revenue leakages, expand the revenue base and diversify operations.
![]()
Table 7. Distribution of Tax revenue (2010 and 2011)
Source: Monitoring, Research and Planning Department (MRP), NRA (June 2021).
3.8.6 Mining and Non-Mining Related Revenue
Sierra Leone’s mining sector contributed Le302.8 billion in revenue in 2011, the highest the country has ever reported for the sector. Figure 14 illustrated that mining-related revenues constituted 21.2 percent of revenue collected by NRA in 2011, which means a whopping 78.8 percent was collected on income and capital, goods and services, and cross-border merchandising and trade.
The reported revenue for mines and minerals could signify the dawn of a new era in Sierra Leone as the mines and minerals sector continues to attract intense international interest for proper planning to avert the well-documented resource curse amid the influx of large-scale foreign investment in the sector.
3.8.7 Operational Report: Tax and Customs
This section of the report covers tax and customs operational activities on taxpayer records, compliance, audit, debt and enforcement, and risk management. Both the operations of DTD and CED have been duly enhanced to ensure better taxpayer, compliance and risk management.
1) NRA Taxpayer Register
The taxpayer registers of NRA showed an expansion in taxpayers by 15.4 percent from 4,224 in 2010 to 4874 taxpayers in 2011. This measured increase in tax base was a result of improved taxpayer records and an effort to widen the domestic tax net. NRA taxpayer register has been dominated by GST-registered businesses (47.9 percent in 2010 and 50.3 percent in 2011), most of whom are mandatory registrations as provided by the GST Act, 2009 (Table 8). Holders of Personal Income Tax (PIT) constitute about a third of taxpayers in the NRA register in 2011, with a 6.7 percent increase in employers and a 714 (2.6 percent) rise in the number of salaried employees.
Table 8 also revealed the proportion of corporate entities in 2010 and 2011 and up to the year 2019. Although it’s a smaller fraction (15.9 and 16.2 respectively), there was a 17.2 percent growth in the number in 2011 and up to the year 2019, which was accompanied by the expansionary trend in the number of all
![]() Source: Monitoring, Research and Planning Department (MRP), NRA (June 2021).
Source: Monitoring, Research and Planning Department (MRP), NRA (June 2021).
Figure 14. Mining and non-mining revenue.
taxpayers in 2011and up to 2019 is the reason for optimism. This is an indication of the Authority’s move to expand the domestic tax net and enhance revenue generation.
2) Taxpayer Compliance and Enforcement
Taxpayer compliance could be assessed on the basis of their return filing, payment, and reporting. Table 9 below illustrated returns filed by registered GST and those classified as companies or Trades for the purpose of payment of corporate taxes 5. The table does not include PAYE tax returns, which were not available at the time of this report. Returns filed were classified into four: 1) total expected 2) on-time filing 3) late filing and 4) non-filing. Table 9 illustrated that at least half of the expected returns were filed on time for all categories of filers. Although this represented an encouraging fraction of voluntary compliance, it is the proportion of non-filers (at least a third of expected returns for all categories) that raised
![]()
Table 8. Number of active taxpayers by tax type.
Source: NRA Taxpayer Register 2011 (Large Taxpayer Office and Small and Medium Taxpayer Office).
![]()
Table 9. Return filing by major tax streams in 2011.
Source: Large Taxpayer Office and Small and Medium Taxpayer Office, June 2021.
concern. Non-filers could be less or non-compliant, which is a threat to revenue collection and require immediate enforcement measures to reverse the situation.
The fact that about two-thirds of returns were filed, with fewer late filers means the situation could be improved when taxpayers are fully aware of the sanctions associated with late filing and non-filing.
3) Tax Audit
The data provided in Table 10 below was based on only completed audit cases in 2010 and 2011 i.e., more audits were initiated in each than were completed. From Table 10, it could be observed that audits yielded more returns in 2011 (Le43.7 billion) than in 2010 (Le19.8 billion including interest and penalties), with yield-per-audit averaging Le672 million in 2011 compared to Le414 million in 2010. The reason for this could be the outcome of joint or integrated audits as a result of the consolidation of the business processes of the Income Tax and GST in 2011.
Since 2010, the total amount collected on interest and penalties resulting from audits was le13 billion, all was collected on LTO cases in the year 2010. SMTO audit report also showed a significant increase in the number of completed audits at the end of 2011. The number of taxpayers audited was 9 in 2010 and increased to 37 in 2011; this indicated significant improvement in the number of taxpayers audited.
4) CED Compliance Measures
The CED compliance model is built on strengthening controls, enhancing customs border protection ability to respond to specific security concerns and detect and respond to high-risk cargoes. The implementation of the Automated Systems for Customs Data (ASYCUDA++) has prompted significant changes in compliance and risk management at customs. It has led to a rationalized customs clearance process and reduced time for all importers. Its compliance improvement
![]()
Table 10. Audited cases and amount recovered in 2011.
Source: Large Taxpayer Office and Small and Medium Taxpayer Office, June 2021.
strategy is meant to deliver security assistance and revenue collection. The strategy aims to maximize voluntary compliance and reduce delays. It is based on the general self-assessment move of the Authority which shifts the risk of under-declaration to clients and minimizes the need for scrutinizing every declaration or transaction.
5) Establishment of ASYCUDA Support Unit
The implementation of ASYCUDA has resulted in the speeding up of customs clearance through the introduction of computerization and simplification of procedures, thus minimizing compliance costs to businesses and administrative costs to NRA. Its establishment also brought about four units meant to support the automated system. These units include the risk management unit, Post clearance audit unit, tariff unit, and valuation unit. The risk management unit worked on the profiling importers and brokers and that analysis has been completed and updated in the ASYCUDA system. The post Clearance Audit unit completed several audits and their report was submitted for management attention and action. The HS Tariff and Rules of Origin Unit has reviewed the 2007 HS Tariff and addressed the defects that existed. Members of staff in the valuation unit and other stakeholders were trained on the World Trade Organization (WTO) Agreement on Customs Valuation (ACV) which is currently being applied.
4. Discussion
The study empirically examined the effect of tax reforms on revenue collections at the National Revenue Authority. Whiles other studies have looked at individual tax Like Goods and Services Tax GST) reforms, the Income Tax reforms, etc. this study looks at the overall effect of the various reforms undertaken by the NRA on revenue collections.
The Authority reported a milestone collection in 2011, reaching a trillion for the first time in its 9 years of operation. Total revenue collected in 2011 amounted to Le1.43 trillion, 49.5 percent more than 2010 and 14.9 percent of GDP, the highest ever tax-GDP ratio and nominal collection. This trend continues increasingly up to date.
The establishment of the Domestic Tax Department (DTD) in early 2011, brings a boost to NRA revenue collection, particularly in the most recent years as actual revenue collection in both nominal and real terms, improved sharply from a relatively low base of Le995.5 billion in 2010 (before DTD) to Le1.4 trillion, Le1.9 trillion and Le2.2 trillion in 2011, 2012 and 2013 respectively.
The Domestic Tax Department (DTD) collection which consists of both Income Tax (IT) and the Goods and Services Tax (GST) amounted to Le1.27 trillion recording a surplus of Le143.2 billion (representing 11.6%).
Total NRA revenues have increased significantly since the creation of NRA. The revenue to GDP ratio has changed much less, although 2010-2013 did see slightly higher ratios than the immediately preceding years. Total NRA collections for 2014 amounted to Le2174 bn, reflecting a decline in 2013 collections of approximately 1%. This can be attributed to the closure of the two largest iron ore mines and the economic impact of the Ebola outbreak, which hit revenues substantially in the latter half of the year. Looking at revenue collections by tax type, it can be seen that income taxes (both personal and corporate) provide for 42% of Sierra Leone’s revenues, with GST providing for a further 20%. A further 20% of revenues came from non-GST customs and Excise. Extractive and Non-Tax Revenues account for most of the remainder.
5. Conclusions
In conclusion, tax structure reforms have a significant impact on revenue collections. It also shows a pragmatic relationship with revenue collections. This means that over time the various reforms being instituted have led to an increase in revenue collections. It is also evident that the prevailing economic conditions (GDP) have an influence on tax revenue collections. There is a positive relationship depicted in the study between GDP and tax revenue collections. Therefore, the NRA must continually reform the tax system with the aim of improving the effectiveness of tax collections. Finally, findings from the research show that tax reforms are an effective means of improving revenue collections.
However, there are still challenges in GST administration in Sierra Leone, insufficient information and database pose a big challenge to accurately and properly tax the informal sector and tax avoidance schemes have been made possible as a result of loopholes and ambiguities in the laws. Tax efficiency relied on research studies, and highly educated and well-trained staff (Abdella & Clifford, 2010) [7]. We recommend that NRA have well-informed, and trained personnel with refresher training in tax laws and proper regulations to clearly explain the tax laws to taxpayers. Future researchers should focus on looking at mechanisms that enhance the cooperation of tax-payers to understand and be willing to conform to tax reforms and tax laws.