Malaria and Climate Variability in Two Northern Stations of Nigeria ()
1. Introduction
It is well known that most tropical countries are malaria endemic where the human Plasmodium species of mosquitoes’ parasites are high within the general population, leading to different locations reporting cases of malaria infection. In Nigeria, malaria is one of the main causes of hospital visits and death in the population. Inhabitants are being exposed continually to the effects of climate sensitive diseases which kill millions of individuals. Malaria as one of these diseases kills almost 1 million per year (WHO, 2004) among vector-borne diseases and infections, there is no other disease that poses much threat to our existence as malaria (Desta & Ensar, 2017).
Worldwide, about 3.3 billion people are at risk of being infected while not less than 660,000 people died in 2010 as a result of malaria infection (WHO, 2012).
Malaria is caused by Plasmodium parasite, which is transmitted through the bites of infected mosquitoes and requires moisture for breeding. These infected mosquitoes can be linked to four species, namely; Plasmodium falciparum, Plasmodium Vivax, Plasmodium ovale or Plasmodium malariae. There is now a fifth Plasmodium knowlesi which is also known to cause human dx, though not yet reported in Nigeria. Nearly 100% of cases presented to health facilities in Nigeria are caused by falciparum.
There are different factors that determine the prevalence and transmission of malaria as well as the life span of the vector. Understanding the relationship between prevalence of malaria and other factors does not come directly. This is due to different biology of the process and socio-economic factors impacting the disease (Arab et al., 2014). Malaria incidence and transmission is also influenced by geographical dynamics (Caminade, 2014). The weather/climate factors that determine the survival of vectors of disease-causing agents are basically air temperature, precipitation, relative humidity, wind, solar radiation, topography, fresh water ponds, rivers, lakes while the other factors include vegetation, hosts like birds etc., natural predators, parasites, pathogens of the vector (CEIDH, 2001). These factors listed above also aid the transmission of the disease (Pavan & Reddy, 2014). From different geographical dynamics, climate factors play a big (if not the biggest) role in malaria incidence and transmission (Cairns et al., 2015). The incidence and severity of malaria are closely related to disease carrying vectors (Patz et al., 2003) and human activities (Carter & Mendis, 2002). Climate and other factors such as air temperature, humidity, rainfall, and wind speed affect the life cycle of the parasites by altering the duration and parasite behavior (Gubler et al., 2001). Arab et al. (2014) established a significant association between malaria rates and several climate variables (temperature, precipitation and pressure). Mohammadkhani et al. (2016) worked on climatic factors and malaria incidence in Kerman, South East of Iran which showed that the most significant meteorological factor on the incidence of malaria was temperature. As monthly temperature increases, there is a corresponding increase in the incident rate. The relationship between rainfall and malaria indicated that reported cases of malaria are more prevalent during moderately dry periods (Kibret et al., 2019). The dry periods allow for breeding time and reduction in cases of malaria is due to rain wash out, malaria appear to reduce during periods of low temperature especially during the wet period, which possibly suggests that relatively low temperatures are less favorable to mosquito reproduction (Oluleye & Akinbobola, 2010). Rainfall, relative humidity as well as maximum and minimum temperatures are predictors of malaria incidence in tropical rain forest and guinea savanna area of Nigeria and that malaria incidence is more prevalent during the rainy and dry cool season (Akinbobola & Omotosho, 2013).
There is a positive relationship between malaria occurrence and rainfall, probably because it creates many stagnant pools of water, which are fertile breeding grounds for mosquitoes (Akinbobola & Omotosho, 2013). Malaria occurred throughout the year but more prevailing at beginning of rainy season and the meteorological parameter which has most impact on malaria prevalence in the study area was observed to be wind speed (Omonijo et al., 2011). Malaria transmission rate are reported to be optimum at 32˚C - 33˚C (Parham & Michael, 2010). The development for P. vivax parasite is optimum when the minimum air temperature falls within 14.5˚C and 16.5˚C and that of P. falciparum is observed between 16.5˚C to 18˚C. Furthermore, the study reported that it takes a much time for the completion of sporogony P. vivax at the air temperature of 16˚C and shorter time at the air temperature of 18˚C, while when the air temperature is between 28˚C - 30˚C the process can be completed within a very short time ((NIMR, 2001). Oguntade et al. (2020) observed that, weather patterns and ecological factors continue to serve as important drivers of its occurrence and transmission with all the intervention to reduce the prevalence of the disease. Increased malaria incidence corresponds with the months with the highest rainfall (June-August). There was a significant positive effect of rainfall on malaria incidence at one month lag, while temperature and humidity had significant influences at lag four. Lubinda et al. (2021) showed that the most affected population is ages greater or equal to 5 years despite the facts that all population are affected. There are much more effects of climate variables on malaria than mosquito nets and indoor residual spraying interventions. It was established that when there is occurrence of conducive temperature and rainfall, all efforts and intervention to reduce the occurrence of malaria may not be effective.
Liu et al. (2021) observed that the combination of high temperature with high relative humidity and high rainfall could drastically increase the transmission of malaria. Dabaro et al. (2021) found that elevation, rainfall and temperature were the major determinants of malaria incidence in the study area.
In the same vein, weather/climate effects are significant in the transmission of the recently found disease, COVID-19. Huang et al. (2020) reported that COVID- 19 transitional host is not yet known but there was evidence that it can be transmitted from bat to human. The transmission of the virus is through air droplets from human to human. It has been reported that some climate parameters like temperature, humidity, wind, and precipitation may favour either the spread or the disturb of epidemic cycles (Cheval et al., 2020). Bashir et al. (2020) reported that weather condition affected the transmission of viruses and the density of people. Dalziel et al. (2018) observed that climate indicators can be considered as the best predictors because weather conditions play a significant role in the transmission of the coronavirus. Epstein (2001) reported that the extreme weather associated with long-term changes in climate made a significant contribution to the West Nile virus spreading in the US and Europe. A study by Haque and Rahman (2020) showed that high temperature and high humidity significantly reduced the transmission of COVID-19. Coccia (2020) observed that accelerated transmission dynamics of COVID-19 is due to mainly the mechanism of “air pollution-to-human transmission” (airborne viral infectivity) rather than human-to-human transmission.
In light of the above, even though some research has looked into identifying the link between weather variables and the spread of viruses, researches are still at the preliminary stage on the relation between them. Most of these studies are still not forth coming in Nigeria as a result of inaccessible data. This study therefore aimed at creating a link and simple understanding of the complex relationship between weather parameters (rainfall, relative humidity, maximum and minimum temperatures) and Malaria to better understanding how to tackle this important disease with the available data. The objectives of this study are to determine the weather parameters that are favorable to the prevalence of this disease, the peak period (month and season) of this disease and to develop a Disease-weather statistical model that will predict the actual contribution of these parameters on the prevalence of malaria in Kano and Jos.
2. Data and Methods
2.1. Study Area: Kano and Jos, Nigeria
Figure 1 is the map of the study area. This study was conducted in Kano and Jos, the Sahel and Guinea Savannah ecological zone of north-western and central Nigeria respectively Kano is the capital of Kano state in northwestern Nigeria, located in the Sahelian geographic region of the Sahara. Situated within 12˚00'N and 8˚31'E with geographical area of 499 km2 (193 square miles). Kano has an average of about 690 mm (27.2 inches) of precipitation per year, the bulk of which falls from June through September. Kano is typically very hot throughout the year, though from December through February, the city is noticeably cooler. Nighttime temperatures are cool during the months of December to February, with average low temperatures of 11˚ - 14˚C. The average relative humidity of Kano during dry season ranges from 16% - 23% while during rainy season it ranges from 48% - 66%. Jos is the capital city of Plateau state, located at the middle belt of Nigeria, with a population of about 900,000 people (2006 census). It is situated almost at the geographical centre (Lat 9.93˚N and Long 8.83˚E) of Nigeria and about 179 km (111 miles) from Abuja, with an elevation of about 1238 meters (or 4062 feet) height above sea level. Average relative humidity is about 66% during the dry season and 78% during the rainy season. Average monthly temperature ranges from 21˚C - 25˚C (70 - 77˚F), and from mid-No- vember to late January, night-temperatures drop to as low as 11˚C (52˚F). Hail sometimes falls during rainy season because of the cooler temperature at high altitudes. Jos is a favorite’s holiday location for both tourists and expatriates based in Nigeria. Jos receives about 1400 millimeters (55 inches) of rainfall annually, the precipitation arising from both convective and orographic sources.
2.2. Data and Sources
Monthly records of reported malaria cases from 1997 to 2018 were collected from the hospital records. For Kano and Jos, Abdullahi Wase Specialist Hospital and Plateau state general hospital, were used respectively. They are government standard hospitals which are central to the city. Also, same data were collected from Plateau state general hospital, Jos. These hospitals were chosen because of their data consistency, availability and proximity to the meteorological observatory. Monthly data by state which is mostly available, for example, are not sufficient to make statistical inferences regarding the effects of weather on the risk for disease incidence: weather changes too quickly and affects local regions and stations diversely. Thus, case-related data typically collected for public-health reporting may not be sufficient to be used to determine the role of weather on the incidence of a specific infectious disease. The malaria data are the confirmed
![]()
Figure 1. Map of Nigeria showing the study areas.
cases of P. falciparum. Data on weather factors e.g., rainfall (mm), relative humidity (%), minimum and maximum temperature (˚C) were obtained from the Nigeria Meteorological Agency, Abuja, Nigeria. Despite the availability of meteorological data up to date, malaria data were largely not continuous in recent years, therefore, the available data were used which is still considered good because it is continuous. To understand the impact of weather on malaria, information on weather parameters at patient locations is needed, but this is not always accessible due to confidentiality or data availability. Weather parameters at nearby locations are often used as a proxy, but the accuracy of this practice may not be known (Djennad et al., 2018).
2.3. Methods
The data collected were assessed for normality following which the appropriate parametric or nonparametric tests were applied at an alpha (α) of 0.05. Deviations from monthly average values of the malaria incidence and weather variables being considered between the two zones were tested for significance using Mann-Whitney U test. Month differences in the number of malaria cases, rainfall, relative humidity, minimum and maximum temperature for the study sites were also assessed using Kruskal-Wallis test for within site differences. Time series analysis was applied to determine the associations of malaria incidence with weather/climate variability. This was done in two ways. A temporal variation of the variables was analyzed. The monthly prevalence of malaria in the stations were taken as a dependent variable, and meteorological variables such as monthly average maximum temperature, monthly average minimum temperature, monthly average relative humidity and total amount of rainfall were independent variables and a local weather model was generated as
Local weather model:
(1)
The malaria cases a month t, denoted by Yt, was considered as an dependent variable while predictor variables were the local weather. In the local weather model, all the weather variables considered were added due to better data distribution. The ns(t) denotes the natural cubic spline function on the observational time to remove seasonality variations of each location in respective local weather models. Cross-correlations between monthly malaria occurrence and monthly meteorological data time series were analyzed to find the time lag(s) of meteorological factors preceding malaria at which the series showed strongest correlation. Different lag time for local weather models were designed as moving averages from the month of the event (0 month) to 3 months prior (0 - 1, 0 - 2, and 0 - 3-month average).
3. Results and Discussion
3.1. Temporal Variation of Weather Factors and Malaria Cases
The monthly average of malaria reported cases, rainfall, relative humidity minimum and maximum temperature for Kano and Jos is presented in Figure 2.
The time series (monthly) graph of malaria cases (Appendix 1) shows a clear increasing trend from January to August while a decreasing trend is observed from August to December in Jos. That cannot be said of Kano where an increasing
![]()
![]()
Figure 2. Monthly variation of malaria reported cases, rainfall, relative humidity minimum and maximum temperature for Kano and Jos (1997-2018).
trend was observed till June and fairly stable cases until December where the peak was observed. This shows that consecutive observations (months) showed a fairly increase of malaria incidence over the twenty-two years. Besides, there was an identical pattern of trends of monthly malaria occurrence in each year indicating that the relative amplitude of seasonal changes was constant over time.
From the figures, there is minimal seasonal variation of malaria occurrence with weather parameters in Kano except with minimum temperature and relative humidity where a fairly distinct pattern is observed. In Jos it shows a distinct seasonal pattern in rainfall and relative humidity where the peak of these variables coincides with the peak of reported malaria cases. The seasonality of monthly precipitation seems to correlate with malaria cases, with the notable exception of Jos Highlands. The other distinctive characteristic of Jos Highlands is the low temperature, since the station is located at high altitude. The results of time series analysis varied across study locations (Figure 2).
3.2. Correlations between Malaria Cases and Weather Parameters
Correlations between malaria cases and weather parameters are presented in Figure 3(a).
Malaria incidence in Kano and Jos were positively associated with rainfall, relative humidity and minimum temperature but negatively associated with maximum temperature. This relationship is significant in Jos with all the variables while it’s only significant with rainfall and relative humidity in Kano. This suggests that, weather factors play a dominant role in the prevalence of malaria in Jos than Kano. This may likely be due to the high altitude.
Figure 3(b) shows the cross correlation at current month to three-month lag. Cross-correlation analysis showed that minimum temperature, maximum temperature, relative humidity and rainfall have significantly lagged correlations with malaria case occurrence (Figure 3(b)).
![]() (a)
(a)![]() (b)
(b)
Figure 3. (a) Correlation between malaria cases and weather variables; (b) cross correlation between malaria cases and weather variables in Kano and Jos.
Cross-correlation analysis showed that the weather variables considered have significantly lagged correlations with malaria case occurrence (Figure 3). Malaria incidence in Kano was positively associated with rainfall (0 - 3 month) lag while its positive 0 - 2 months lag and change direction in the 3rd month to negative in Jos. The same result was observed with relative humidity in both stations. At the lag of 3 months, minimum temperature was significantly associated but was more significant in Kano. Maximum temperature is positively associated from 0 - 3 months in Kano while it changes from negative to positive in the 3rd month in Jos. Although the exact strength of the associations differed by lags, the transitions in direction of the association from negative to positive with maximum temperature was only observed in Jos.
3.3. Relationship between Malaria Incidence and Weather Variables (a 3d Plot to Show the Relationship amongst Variables)
Figure 4 is the 3d plot to show the relationship amongst variables in the two stations Kano.
For example, in b, the lowest incidence of malaria (2060) occurred when the rainfall is less than 20 mm and relative humidity of ~20% in Kano while the same pattern is also observed in Jos. Lowest incidence corresponds to times with low rainfall and low relative humidity.
Figure 5 is the 3d plot to show the relationship amongst variables in the two stations (Jos) Box plot of the monthly incidence.
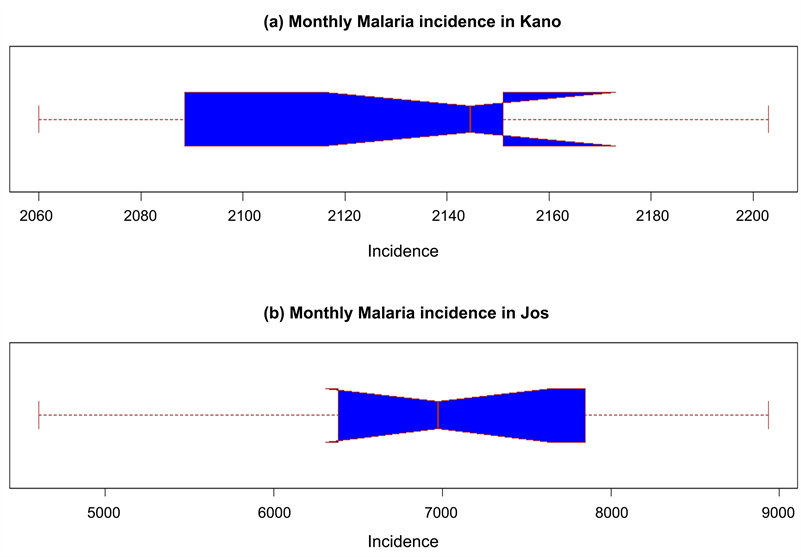
Appendix 2 shows the box plot of the monthly incidence. The box shows the interquartile range (IQR). The IQR is the 25 to 75 percentiles also known as Q1 and Q3. The IQR is where the center 50% of the data points will fall.
The whiskers add 1.5 times the IQR to the 75 percentile (aka Q3) and subtract 1.5 times the IQR from the 25 percentiles (aka Q1). The whiskers should include 99.3% of the data if from a normal distribution.
The brown middle line shows the median of the data.
![]()
Figure 4. 3d plot to show the relationship amongst variables in the two stations (Kano).
![]()
Figure 5. 3d plot to show the relationship amongst variables in the two stations (Jos).
The Notch shows a confidence interval around the median which is normally based on the median +/− 1.57 × IQR/sqrt of n. According to Graphical Methods for Data Analysis if two boxes’ notches do not overlap there is “strong evidence” (95% confidence) their medians differ.
Figure 5(a) indicates that the 25th percentile is about 2900, 75th percentile about 2150. And the lower and upper limits of the notch are about 2120 and 2175.
If the distance between the median and the 25th percentile and the distance between the median and the 75th percentile is extremely different and/or the sample size is low, the notch will be wider. If it’s wide enough that the notch boundary is more extreme than the 25th and 75th percentiles (aka, the box), then the notched box plot will display this “inside out” shape as in (a).
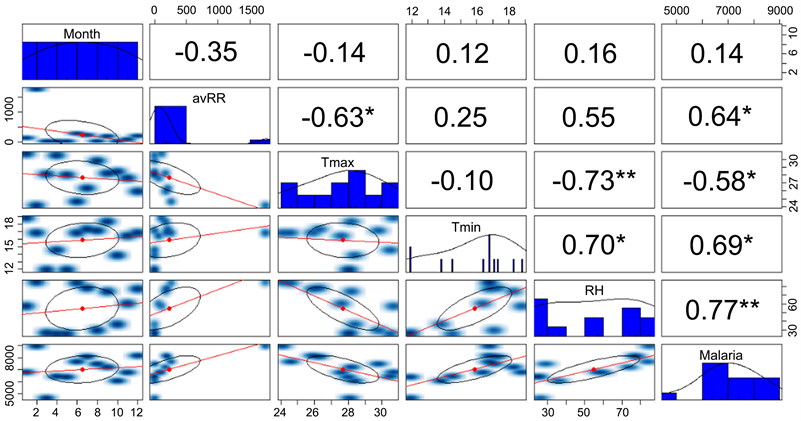
Appendix 3 is the directional Distribution (Standard Deviational Ellipse; the black ellipse shape). This is also a significant plot but with a detailed representation. For example, one star means significant at 90%, two stars at 95% and three stars at 99% significant levels. There is a positive correlation (0.77) between Malaria and RH at 95% significant level. There is a positive correlation (0.64) between Malaria and avRR at 90% significant level.
How a Directional Distribution (Standard Deviational Ellipse; the black ellipse shape) works:
For example, between Malaria and RH, there is an increasing trend (with a significant positive correlation of 0.77) but the dispersion from the mean centre (red dot in the ellipse) is spread less along the transect.
The opposite is the case for tmax and malaria. Here there is a decreasing trend with a negative correlation of 0.58. The dispersion from the mean center (red dot in the ellipse) is spread less along the transect too.
3.4. Malaria-Weather Model
Table 1 gives the models generated by the regression analysis carried out. Linear
![]()
Table 1. Estimates of the regression model with seasonal effects on malaria incidence in Kano and Jos.
![]()
Table 2. Parameter estimates and fit of the model.
regression model was the best fit model based on the selection criteria due to higher adjusted R Square and low P values (Table 1 & Table 2). The results indicate that the model was significant at p < 0.5 level
(R-square = 82.04%; and adjusted R-square = 71.77%) (Table 2) and (R-square = 33.03%; and adjusted R-square = 0.00%) for Jos and Kano respectively
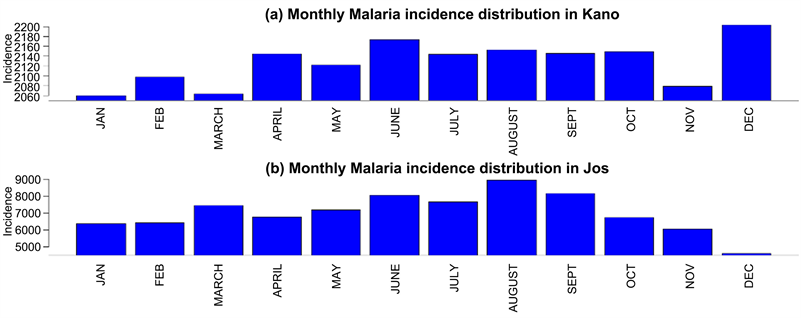
The months of August and December (for Jos and Kano respectively) have more malaria cases than other months suggesting that it is the month in which the highest number of malaria cases occurred. The least number of malaria cases occurred in December and January for Jos and Kano respectively.
3.5. Discussion
A lot of research work have been done on the impacts of temperature and rainfall as the primary determinants of malaria occurrence. For example, the finding of Dabaro et al. (2021) revealed that rainfall, temperature, and elevation were the major drivers of the malaria disease. Haque and Rahman (2020) also in way found that two indicators (minimum temperature and average temperature) showed relationship with COVID-19 cases. These results pointed to the facts that COVID-19 is showing same pattern with malaria. It has been well documented that there is profound biological influence on development and life cycle of both plasmodium parasites and mosquito vectors. Temperature seems to be a very important factor in determining parasite development, and the length of incubation period is highly sensitive to the ambient temperature. In this work, there were positive associations of malaria occurrence with minimum temperature, rainfall, relative humidity in Kano and Jos while negative association was observed with maximum temperature at lag zero. This relationship is significant in Jos with all the variables while it is only significant with rainfall and relative humidity in Kano. This reveals that, weather factors play a dominant role in the prevalence of malaria in Jos than Kano. This result is in agreement with Lubinda et al. (2021) which found a significant spatio-temporal shift in Diurnal Temperature Range (DTR)/environmental predictors influenced malaria incidence- rates, even in areas with declining trends. This may likely be due to the high altitude which modifies the local weather of Jos to suite the survival of larvae. Ernst et al. (2006) found that altitude and proximity to the forest were independently associated with increased malaria risk in all years, including epidemic and non-epidemic years. Furthermore, Matsushita et al. (2020) found positive rainfall-malaria overall associations in lowland whereas similar associations were not found in highland.
However, malaria incidence in Kano was positively associated with rainfall (0 - 3 month) lag while it’s positive 0 - 2 months lag and change direction in the 3rd month to negative in Jos. The same result was observed with relative humidity in both locations. At 3 months lag, minimum temperature was significantly associated but was more significant in Kano. Maximum temperature is positively associated from 0 - 3 months in Kano while it changes from negative to positive in the 3rd month in Jos. The strength of the associations is observed to differ by lags, the transitions in direction of the association from negative to positive with maximum temperature was only seen in Jos. Matsushita et al. (2020) observed a positive association at lags of 2 to 4 months at rainfall in both lowland and highland areas. Also, temperature had an interactive effect on malaria with relative humidity and rainfall (Liu et al., 2021). The combination of high relative humidity, temperature and rainfall could accelerate the transmission of malaria. Meteorological factors may affect malaria transmission interactively (Liu et al., 2021).
The lead time before the positive effects varied by location, but the time-dep- endent associations observed in this study agree with findings of Akinbobola and Omotosho (2013). The positive association observed at 0- to 3-month lags also seems biologically relevant given the life cycle of Anopheles mosquitoes and parasites. Malaria occurrence in Jos on the other hand, had different responses to maximum temperature, showing a negative association (Dabaro et al., 2021). These findings showed how complex these relationships are, which in turn requires a thorough investigation of different approaches. For example, Plasmodium development also depends on the diurnal temperature range as much as maximum temperature (Blanford et al., 2013) and this could be a consideration for future study.
Observed relationships between rainfall and malaria also varied by study locations which are also in different regions which corroborate the facts that the effect of weather variability can be location specific. It is not strange to understand that stagnated pools of water enhance mosquito survival and breeding. However, different region experiences varying effects of precipitation both in amount and frequency on epidemiological and entomological parameters. Several works corroborate this hypothesis (Briët et al., 2008). For example, as much as rainfall may promote malaria transmission by creating ground pools and other water sources in which vectors can breed, yet heavy rains can also flush out the larvae of the virus (Reiter, 2001). Drought at where rainfall is normally distributed may eliminate predators and result in safe havens for mosquitoes since mosquitoes are susceptible to a range of vertebrate and invertebrate predators found in the wetlands (Lafferty, 2009). The effects of rainfall are location specific and may require interpretation of biology of disease and land use/land cover of individual sites. In this study, other parameters like, land-use, land cover, water Management etc., were not included. These could highly determine the transmission pattern, which is the limitation of the study in general.
4. Conclusion
In this study, the local weather factors have an impact on malaria prevalence. The study showed the relationship between malaria incidence and climatic parameters at varying lags in Kano and Jos.
Their associations with malaria occurrence vary from location to location. The result might be because of the different environmental and physical conditions of the study areas. Variability in seasonal weather patterns is mostly responsible for the fluctuations in the disease occurrences in each and every season of the year, hence there is clear evidence of seasonality in malaria transmission. The findings revealed that each site must be dealt with separately considering the peculiarities of the station. The dependent nature of each location is a key to minimizing the possible impact of climate variability and change and this could help in maximizing the use of effective control and prevention. Temperature, relative humidity and rainfall are predictors of malaria because they influence malaria transmission either directly or indirectly. Vector control mechanisms should be guided by local weather conditions and public health awareness on adequate usage of intervention measures to lessen the burden of malaria. Our results suggest that geographically makeup can influence or greatly determine the structure of climate-malaria relationships, which might provide some ideas for understanding relationships between environmental factors and the disease. More attention should be given to control of vector and public health awareness on proper usage of intervention measures to reduce the seasonal malaria incidence stimulated by suitable weather conditions.
The limitation of this study is the number of reported cases of malaria. The accuracy of cases that occurred may be different from cases reported in the hospitals. This can be due to inaccessibility to health facilities in the area. However, clinical diagnosis reported is still sufficient to capture the association trends with weather factors. Other possible risk factors of malaria were not included in the study for a holistic assessment of critical drivers in both stations. Factors such as demographic characteristics, socioeconomic factors and public health control measures, immigration-emigration etc., regarding malaria may have an influence on the response with weather variables. However, this study provides baseline health information for future malaria intervention planning in the two stations.
Acknowledgements
The authors acknowledge the Nigerian Meteorological Agency (NIMET) for providing us with meteorological data set and also to Abdullahi Wasai Special Hospital and Plateau state hospital for providing us with medical records.
Appendix
Appendix 1. Monthly Average of Malaria Reported Cases for Kano and Jos (1997-2018)
Appendix 2. Box Plot of the Monthly Incidence
Appendix 3. Directional Distribution (Standard Deviational Ellipse; The Black Ellipse Shape)