1. Introduction
With the increasing popularity of digital investment platforms, such as Robinhood, an app that offers zero-commission trading, financial products and services have become progressively available to individuals. Various sources, such as Youtube, are now a go-to for individuals wishing to gain financial knowledge. However, this phenomenon is followed by an increased complexity of financial products and financial decisions households face.
The research argues that a lower financial literacy is linked to less wealth accumulation and planning for retirement (Lusardi, 2019). This is confirmed by various works of literature which also claim that specific demographic groups which have lower financial knowledge, such as the young, women, the elderly, and poorer households, tend to make more financial mistakes. Furthermore, important demographic differences exist in the financial knowledge levels of the Swiss population (Brown & Graf, 2013). It is within this context that this study aims to shed more light on the financial literacy levels of young people in Switzerland.
The first objective of this research is to assess the level of financial literacy of individuals under 35 in Switzerland. To do so, a quantitative survey was conducted, and the data was analyzed to provide further details about the demographic differences in terms of financial knowledge within that age group. The main variables that will be analyzed are gender, education, income and wealth, and the actual investment.
2. Theoretical Framework
Financial literacy is the capacity of individuals to make educated everyday financial decisions about money management such as budget, wealth, saving, and retirement planning using the economic information available to them (Lusardi, 2019).
Additionally, it is linked to financial behaviors that are strongly correlated to wealth accumulation such as pension planning, stock market participation, the ability to withstand negative income shocks, and behavior toward debt. Indeed, empirical evidence compiled by the Flat World project shows similar results in view of financial literacy and financial behavior across 15 different countries (Lusardi & Mitchell, 2014).
The article is based on Lusardi and Mitchell’s Big Three questions (Table 1) to measure literacy, which has been first used in 2004 for the U.S. Health and Retirement Study. The questions allow researchers to replicate and compare results
![]()
Table 1. Big 3 financial literacy questions.
for financial literacy across countries and demographic factors such as age, gender, and education. These questions were designed according to four principles.
Simplicity: The questions should assess the basic ability required for intertemporal decision making. This implies decisions with consequences at various points in time.
Relevance: The questions should be general and relate to every day financial decisions.
Brevity: A lower number of questions help with reusability.
Capacity to differentiate: The questions should allow comparisons of different levels of knowledge across respondents.
Furthermore, financial decisions faced by households are made up of various underlying concepts. To measure financial literacy, both the interest rate, inflation, and risk diversification were taken into consideration. The Big Three questions were designed according to these principles.
It is important to point out that the results obtained from these questions can only act as a proxy for actual financial knowledge. However, research has been carried out using more complex sets of questions and shows similar results. Thus, the questions constitute an adequate estimate of financial literacy (Van Rooij et al., 2011).
The Big 3 financial literacy questions have been used for further surveys across the entire world. Both Lusardi and Mitchell (2011) carried out the so-called Financial Literacy around the World project—in short FLat World. It included data from 15 countries and served as an international study comparing the financial literacy across all 15 countries (Lusardi & Mitchell, 2011).
According to their findings, as displayed by Table 2, the average financial literacy level amounted to approximately 30%. Beside this, roughly 50% of all respondents could answer the questions concerning inflation and interest rates correctly. When looking at those countries, it becomes obvious that they broadly stem from developed and only a few of them from developing countries.
That is, despite the existence of sophisticated financial markets in many areas of the world, the project delivers evidence that the common level of knowledge in view of financial literacy is relatively moderate. Against this backdrop, it is worth noting that the financial knowledge, as indicated by its project name, is relatively flat. In addition to that, the widespread use of complex financial products does not go hand in hand with the financial literacy of the countries’ individuals (Lusardi, 2019).
Gender
Following the results of the Global Financial Literacy Survey, as shown in Figure 1, men tend to show higher levels of financial literacy than women across most countries analyzed. To collect the data, financial literacy questions were included into the Gallup World Poll survey. Accordingly, approximately 150.000 individuals from around 140 different countries gave answers to financial literacy questions (Klapper et al., 2015).
![]()
Table 2. Findings from the FLAT world project across 15 countries.
Source: Lusardi (2019). Note: DK indicates the answer Do not know. *Questions that have slightly different wording than the baseline financial literacy questions.
![]() Source: S & P Global FinLit Survey. Source: Hasler & Lusardi (2017). Note: With kind permission for publication from the author Annamaria Lusardi.
Source: S & P Global FinLit Survey. Source: Hasler & Lusardi (2017). Note: With kind permission for publication from the author Annamaria Lusardi.
Figure 1. Financial literacy rates among men and women around the world.
Similar results were generated through the aforementioned Flat World project. Here, the gender gap can be observed regardless of age, income, and education. Women are also more likely to answer do not know to financial literacy questions. This may highlight overconfidence in men and more self-awareness in women. This trend is observable across countries as well. In countries with higher social equality such as Finland, only 27% of women answer all three questions correctly, whereas 44% of men do (Kalmi & Ruuskanen, 2019).
Furthermore, the amount of do not know answers for women is double that of men, at around 18% versus 10% for men. These differences are even greater when more advanced literacy questions are asked (Van Rooij et al., 2011). One could think that this is due to a lower level of involvement of married women in household financial decision making. However, empirical data shows that the gap in knowledge is even higher when considering single women versus single men compared to married men and women.
Women also tend to have a lower interest for financial markets and score themselves lower than men when asked to assess their own financial knowledge. Brown and Graf (2013) demonstrate that a lack of interest in financial matters does not explain the gap either as there is still a significant difference in financial literacy when comparing women and men who claim to be interested in financial markets.
Age and Education
Financial literacy tends to have a hump shaped graph across the lifecycle. As data from the US demonstrates in Figure 2, financial literacy is lower among younger respondents, increases as people age and face more complex financial decisions, and finally decreases as people reach the retirement age. Interestingly, younger people have a better understanding of risk diversification compared to older individuals (65 and above), while the latter are more knowledgeable regarding
![]() Source: US national financial capability study (2015).
Source: US national financial capability study (2015).
Figure 2. Financial literacy across age in the US.
inflation.
A study conducted in the Netherlands shows that 70% of people who had achieved a university education were among the top quartile of respondents for basic literacy questions (Van Rooij et al., 2011). When asked more advanced literacy questions this percentage dropped to 43%. Another study demonstrates that financial literacy among young people is strongly correlated with educational attainment (Lusardi et al., 2010). People who had graduated from high school had better scores in the financial literacy questions. If they attended college, the scores were even better.
Income and Wealth
Income and wealth are also strongly correlated with financial literacy. People in lower income brackets tend to have a lower level of financial knowledge which increases along with income. The same can be said about wealth. Wealth increases along with financial literacy across the lifecycle, as people get older and gain more financial knowledge, they tend to accumulate more wealth up until retirement when their financial literacy decreases, and they start spending their wealth.
Financial Literacy and Stock Market Participation
Van Rooij et al. (2011) provide an extensive way to measure financial literacy and how it affects stock market participation. Financial literacy has been found to be a strong predictor of participation in the stock market. Individuals investing in stocks have usually better financial knowledge. Previous research proposes different factors for stock market participation such as the influence of peers, cognitive ability, or lack of wealth. However, according to the authors, these explanations are incomplete because they do not clearly explain why some households do not hold stocks. While demographic factors such as age, gender, income, and education are strongly correlated with stock market participation, when controlling for these variables, financial literacy remains a comparable if not more important factor for stock market participation.
Financial Literacy in Switzerland
Brown and Graf (2013) analyzed financial literacy in Switzerland through a survey with a sample of 1500 participants from the German speaking part, aged between 20 and 74. It is important to note that self-employed participants were ruled out of this survey. The participants were asked the same Big Three financial literacy questions mentioned beforehand.
The results shown in Table 3 highlight that about 50% of the sample were able to answer all three questions correctly. This is on par with results from Germany and the Netherlands which are among the top performing nations in terms of financial literacy. The first differences in demographics can be observed by looking at the percentage of all correct answers by age group.
Here, 52.4% of participants aged between 36 and 50 were able to answer all three answers correctly. Whereas the age groups 35and younger and Older than 65 both performed worst.
![]()
Table 3. Financial literacy and socioeconomic characteristics.
Note:DK indicates that respondents refused to answer the question or did not know the answer. Source: Brown and Graph (2013).
Table 3 also indicates an important gender gap as 62% of men answered the three questions correctly versus 39.3% of women. Brown and Graf (2013) tested financial interest as a possible explanation for this gap. They found that when accounting for financial interest there was still a difference of about 20 percentage points in both groups (those that had financial interest and those that did not). Women are also more likely to answer “do not know” to at least one of the questions.
Investments Made by Individuals in Switzerland
Another study conducted in Switzerland shares insights in terms of holding securities concerning individuals (Dietrich et al., 2020).
As Figure 3 illustrates, 68% and 52% of respondents from Gen-Z and Gen-Y replied that they have never held any securities. In comparison, respondents from older generations were much more likely to hold securities. The most common objectives sought by investors were growing wealth and saving for retirement. Additionally, young people were found to have a shorter investment horizon than older generations.
Concerning cryptocurrency ownership, results from a 2021 survey (Statista, 2021) show that about 11% of the swiss population own or use cryptocurrencies. With regards to overall interest in financial markets there are no significant differences between age groups. Nevertheless, men living in German-speaking Switzerland tend to have a higher interest than other demographic groups.
In addition, as Figure 4 shows, an important gender gap exists across all age groups. The survey included 1.217 participants in Switzerland. Accordingly, men are overall more interested in financial matters than women. Furthermore, more
![]() Note: The age groups are divided as such: Gen Z (born 1997-2012), Gen Y (born 1981-1996), Gen X (born 1965-1980), Baby Boomers (born 1955-1964), 65 and above (born 1954 or earlier). Source: Dietrich et al. (2020).
Note: The age groups are divided as such: Gen Z (born 1997-2012), Gen Y (born 1981-1996), Gen X (born 1965-1980), Baby Boomers (born 1955-1964), 65 and above (born 1954 or earlier). Source: Dietrich et al. (2020).
Figure 3. Swiss individuals holding securities or held them in the past.
men tend to own securities than women and while 51% of the men surveyed currently held securities, only 32% of women did (Dietrich et al., 2020).
More specifically, Figure 5 reveals the mean level of interest in financial markets by age group and gender. The data shares the lowest rate of interest amongst females in generation X and the highest level of interest amongst those females aged 65 and above.
Methodological Approach
Firstly, the research aims at investigating the financial literacy of individuals aged 35 and under in Switzerland. Secondly, it shall shed light at potential differences with regards to financial literacy and investment behavior based on demographics such as, gender, education, and income. To gather the data, a quantitative online survey was conducted in November and December 2021.
The data collected from the survey was then exported to an Excel workbook, where it was scanned for errors and edited to prepare it for the analysis. Once the data was cleaned and ready, the open-source statistical software JASP was used to generate frequency tables and to observe the relevant results. Lastly, Excel was used to create various graphical visualizations to help the reader digest the data in a more understandable manner.
3. Findings
Gender
Table 4 examines the percentages of correct and don’t know answers by gender to the three financial literacy questions and provides the results for the whole sample as a way of comparison. The results demonstrate an important gender gap. For interest and inflation questions there was around 20% difference in correct answers between men and women. The difference is even higher and amounted to around 36% for the risk diversification question.
Furthermore, women were also more likely to answer don’t know to all three questions. Overall, the percentage of men answering all three questions correctly was around 62% higher than for women. Similarly, and the percentage of don’t
![]() Note: The age groups are divided as such: Gen Z (born 1997-2012), Gen Y (born 1981-1996), Gen X (born 1965-1980), Baby Boomers (born 1955-1964), 65 and above (born 1954 or earlier). Source: Dietrich et al. (2020).
Note: The age groups are divided as such: Gen Z (born 1997-2012), Gen Y (born 1981-1996), Gen X (born 1965-1980), Baby Boomers (born 1955-1964), 65 and above (born 1954 or earlier). Source: Dietrich et al. (2020).
Figure 5. Mean level of interest in financial markets by age group and gender.
![]()
Table 4. Percentage of correct and don’t know answers by question and by gender.
![]()
Table 5. Percentage of correct and don’t know answers by education level.
know answers for women was slightly more than double that of men.
Education
Table 5 demonstrates the percentage of correct and don’t know answers by education level. People without a university education even scored slightly higher to the interest rate question.
However, when taking all three questions into account, 55% of those with a higher education were able to answer the three questions correctly versus 38.7% for those without a higher education. Those without a higher education were also more likely to answer don’t know at least once.
Income and Wealth
When looking at the financial literacy by income and wealth in Table 6, the results show no significant relationship between those variables and the percentage of correct answers. It is important to note that the respondents were not split evenly among each income and wealth class. Almost half of the respondents had a total net worth of less than 10,000 CHF and most of them had an income between 2000 CHF and 8000 CHF. Surprisingly, 75% of those without an income were able to answer all three questions correctly and 72% of those with a net worth between 20,000 CHF and 50,000 CHF were also able to answer all three questions correctly.
Investments
It was found that 26% of respondents owned stocks, 30% owned cryptocurrencies, and 16% owned both. Furthermore, as shown in Table 7, people who answered two or more of the financial literacy questions correctly, were much more likely to owns stocks and cryptocurrencies than people that answered zero or one question correctly. This indicates a potential positive correlation between financial literacy and investment, both in stocks and cryptocurrencies.
Additionally, 49% (n = 54) of the survey participants said they invested in traditional investment products. Figure 6 shows in which particular financial product individuals invested. Accordingly, the 3rd pillar represents the most
![]()
Table 6. Percentage of all 3correct and don’t know answers by wealth and income.
frequently used product class followed by stocks and funds. Investments in real estate, bonds, and gold pose product classes with a frequency of 10% or less amongst all participants surveyed.
Figure 7 demonstrates that the most popular source was family and friends, followed by consulting a financial advisor.
Furthermore, almost 60% of the people who invested in stocks did so in an independent manner, meaning they picked and bought stock themselves without external help. Additionally, 38% of participants indicated that they bought stocks on well-established platforms such as Swissquote and International Brokers. Only 31% percent of the participants that owned stocks did so for more than three years and almost 60% owned stocks for less than 2 years.
![]()
Table 7. Percentage of individuals holding stocks or cryptocurrencies depending on the number of correct answers.
![]()
Figure 6. Number of people invested in traditional financial products.
![]()
Figure 8. Motives for not investing by percentage of individuals that did not invest.
However, 90% of stock owners confirmed that their investments had increased in value. More than 80% replied that they were at least somewhat likely to buy more stock and only 10% said they were not likely at all to buy more stock.
Figure 8 reveals the motives for those young individuals in Switzerland not investing at all. The number one reason for individuals not investing was lack of knowledge, closely followed by a lack of capital and lack of time, whereas the following groups were not interested, found investing to be too complicated, or feared losing money.
4. Discussion
Gender
Previous research highlighted a significant gender gap in financial literacy between men and women. Firstly, men were more likely to answer all three questions correctly and women were more likely to reply don’t know to those questions. For Switzerland, Brown and Graf (2013) found that 62% of men were able to answer all three questions correctly versus 39.3% for women.
The results from the survey show that this difference is still present among the younger population and similar results were found. Indeed, 59.4% of men surveyed answered all three questions correctly versus 36.6% of women.
Additionally, when comparing the amount of at least one don’t know answer by gender, the survey results also showed that women were more likely to reply, don’t know, however, the percentage of don’t know answers was higher for both men and women when compared to the results found in previous research.
Furthermore, the results found by Brown and Graf (2013) regarding self-assessed financial interest and financial knowledge were also confirmed among the younger population of Switzerland.
Male respondents from the survey sample had a much higher interest in financial markets than women and scored their level of financial knowledge slightly higher than women. These results imply that the lower financial literacy of women can be a factor leading them to accumulate less wealth in their lifetime, thus creating a wealth gap between men and women.
Education
Similarly to previous research, level of education seems to be correlated with financial literacy. People with a university education were more likely to answer all three financial literacy questions. The survey results show that 55% of those with a university degree answer all three questions correctly versus 38.7% for the rest.
Nevertheless, these results are much lower than those found by a study in the Netherlands (Van Rooij et al., 2011), where 70% of those with a university education answered all three questions correctly. Furthermore, the results found show that a higher education level may not indicate a higher level of interest in financial markets, as in the sample, people without a university degree were found to have a higher financial interest.
In this case, gender was a much more telling sign. Lastly, because 72% of the survey respondents had a higher education, the results found do not necessarily apply to the whole age group. Further research should be done to better assess the financial literacy level of young people without a university degree.
Income and Wealth
Previous research states that income and wealth are correlated positively with financial literacy. In this regard, the results found by this study were inconclusive as no significant trend was found. This is probably because the groups in each income and wealth class were not sufficient in size.
To get better results a study with a higher number of participants would need to be conducted. Furthermore, the results were biased towards those employed part-time and/or unemployed, as only 50% of the respondents were employed full-time.
Investments
The results from the survey indicate that about 26% percent of the people surveyed owned stocks and 30% percent owned cryptocurrencies. The percentage of young people that own cryptocurrencies in Switzerland is much higher than the 11% percent previously estimated for the total population.
Furthermore, the survey results imply that there is a positive relationship between financial literacy and stock and cryptocurrency ownership. People with higher financial literacy scores were more likely to invest in either asset. The differences in gender found for financial literacy are also present when comparing stock and cryptocurrency ownership by gender, men tend to invest more than women.
It was also found that most young people get financial advice from their friends and family. They also invest in a rather independent manner, as 60% percent of the people survey picked and bought stocks without external help.
Moreover, the most common motive for investing in stocks was found to be saving for retirement. This result confirms previous research on the subject where growing wealth and saving for retirement were the most common reasons for investing.
Lastly, perhaps the most important result regarding investment is the reasons young people have for not investing. Indeed, 41% of people that did not invest mentioned it was due to a lack of knowledge. This result shows that the low financial literacy found among young people is closely linked to whether they invest or not. As 90% of the people surveyed stated that their stock investments had increased in value, it seems that not investing represents a lost opportunity for young individuals to accumulate wealth.
5. Conclusion
Previous studies on financial literacy have shown that it is relatively low across nations. The basic financial concepts that are interest rate, inflation, and risk diversification are not well understood by most of the population. Moreover, previous research has observed that some demographic groups are more likely to have a lower financial literacy.
There are significant differences in financial literacy between men and women, people with higher education and those without, and people in different age groups. While Switzerland is one of the better-performing nations concerning financial literacy, it is still affected by these demographic differences. In general, women, young people, and those without a university degree tend to have a lower level of financial literacy.
The results observed highlight that there are significant differences with regard to gender and education. Firstly, young women in Switzerland tend to have a much lower financial literacy compared to men. Secondly, young people with a university education showed much better results than those without one.
Thirdly, it was also found that men and those with a university degree were much more likely to invest in stocks and cryptocurrencies. In this regard, one surprising result from the survey is that a higher percentage of people invested in cryptocurrencies than stocks. Lastly, when people were asked why they did not invest, the main reason was because of lack of knowledge. This could indicate that the level of financial literacy is a factor impacting whether people invest or not.
However, while investing can be considered as being risky in the short term, in the long term it poses a proven way to increase wealth. Because this research was conducted using a sample of 111 young individuals in Switzerland, the results observed are likely to be biassed towards certain groups. Here, most respondents were male individuals holding a university degree. To address this issue, further research should include a greater sample base to provide more conclusive results.
Furthermore, the observations of this paper would need to be tested statistically to determine whether there are causal links between financial literacy and the demographic differences found in this research. As the results of this paper have shown, 90% of people that invested in stocks saw their investments increase in value. In addition to that, lack of knowledge was the main reason individuals chose not to invest. This implies that financial literacy can affect an individual’s ability to accumulate wealth.
Appendix
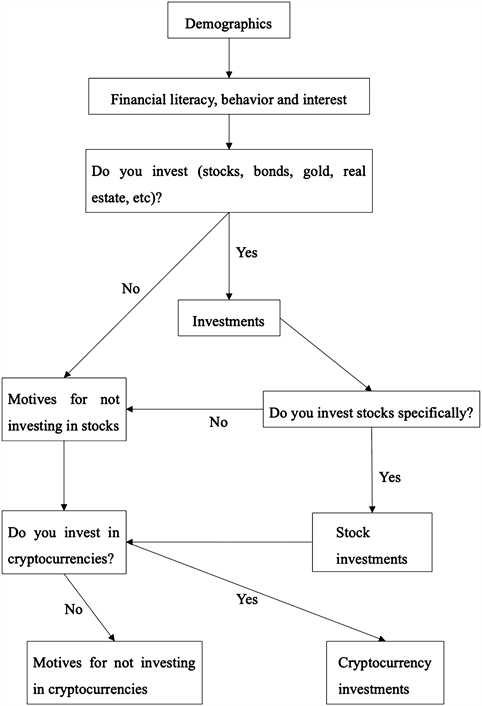
Appendix 1: Survey Structure
Appendix 2: Distribution of the Sample Population